生态环境学报 ›› 2026, Vol. 35 ›› Issue (1): 88-98.DOI: 10.16258/j.cnki.1674-5906.2026.01.008
付守琪1( ), 余朝毅2, 邬乐欢2, 张琪3,*(), 袁筱茜1, 杨钢洪1, 潘月鹏4
收稿日期:2025-09-04
修回日期:2025-11-21
接受日期:2025-12-20
出版日期:2026-01-18
发布日期:2026-01-05
通讯作者:
* E-mail: 作者简介:付守琪(1979年生),男,高级工程师,硕士研究生,主要从事大气污染防治及环境管理咨询研究工作。E-mail: 357973088@qq.com
基金资助:
FU Shouqi1(), YU Chaoyi2, WU Lehuan2, ZHANG Qi3,*(), YUAN Xiaoqian1, YANG Ganghong1, PAN Yuepeng4
Received:2025-09-04
Revised:2025-11-21
Accepted:2025-12-20
Online:2026-01-18
Published:2026-01-05
摘要: 为破解大气污染物排放增量与环境承载力阈值之间的核心矛盾,以舟山群岛新区为对象,基于WRF-CAMx耦合模型,结合2022年环境空气质量数据、大气污染源清单及规划情景排放增量,按月量化PM2.5(管控目标20 µg·m−3)约束下SO2、NOx、VOCs的大气环境容量。结果显示:舟山2022年污染物排放具有显著的产业指向性,NOx排放量30076 t·a−1(60.3%来自临港船舶柴油机;17.3%来自燃煤电厂),VOCs排放量44562 t·a−1(70%来自石化工艺与修造船溶剂使用);环境容量测算表明,基准情景(A,现状排放)下,单独排放时NOx、VOCs、SO2可新增排放量分别为30859、40117、11436 t·a−1,协同排放时分别为16842、22081、9276 t·a−1,且仅1、12月无环境容量;增强基准情景(B,叠加规划增量:SO2为8413 t·a−1,NOx为17299 t·a−1,VOCs为2006 t·a−1)下,单独排放时三类污染物可新增排放量降至9237、12015、4892 t·a−1,协同排放时降至5053、6631、2998 t·a−1,且整个冬季(1-2月、12月)均无环境容量;23 µg·m−3为PM2.5质量浓度临界阈值,低于此阈值承载力受本地排放主导,高于阈值时受区域污染输入影响显著。舟山群岛新区大气环境承载力与现有规划基本协调,需通过分区管控、错峰生产、区域联防等精准措施提升承载力。
中图分类号:
付守琪, 余朝毅, 邬乐欢, 张琪, 袁筱茜, 杨钢洪, 潘月鹏. 基于WRF-CAMx模型的舟山群岛新区大气环境承载力测算及多污染物协同控制研究[J]. 生态环境学报, 2026, 35(1): 88-98.
FU Shouqi, YU Chaoyi, WU Lehuan, ZHANG Qi, YUAN Xiaoqian, YANG Ganghong, PAN Yuepeng. Calculation of Atmospheric Environmental Carrying Capacity and Coordinated Control of Multi-Pollutants in Zhoushan Archipelago New Area Based on the WRF-CAMx Model[J]. Ecology and Environmental Sciences, 2026, 35(1): 88-98.

图1 模拟区域网格域嵌套示意图
Figure 1 Schematic diagram of grid domain nesting in the simulation domain
| 模型选项 | 设置 |
|---|---|
| 模型版本 | V 7.0 |
| 网格嵌套方式 | 3层网格双向嵌套 |
| 水平分辨率 | 9/3/1 km |
| 垂直分层层数 | 25 |
| 水平平流 | PPM |
| 垂直对流 | 隐式时间欧拉后插+空间中央差/迎风格式 |
| 水平扩散 | 1阶K理论闭合方案 |
| 垂直扩散 | 显式ACM2非局地方案 |
| 干沉降 | Wesely(1989)阻力模型 |
| 湿沉降 | SeinfeldandPandis,1998方案 |
| 气相化学机理 | CB05 |
| 气相化学算法 | EBI |
| 气溶胶方案 | AERO6/CF方案 |
| 网格烟羽(PiG)模块 | 关 |
| 边界条件 | MOZART-4全球模型实时结果 |
| 初始条件 | MOZART-4全球模型实时结果 |
| 3D输出开关 | 打开 |
| 时间积分步长 | 6 min |
表1 WRF-CAMx模型参数设置
Table 1 WRF-CAMx Model Parameter Settings
| 模型选项 | 设置 |
|---|---|
| 模型版本 | V 7.0 |
| 网格嵌套方式 | 3层网格双向嵌套 |
| 水平分辨率 | 9/3/1 km |
| 垂直分层层数 | 25 |
| 水平平流 | PPM |
| 垂直对流 | 隐式时间欧拉后插+空间中央差/迎风格式 |
| 水平扩散 | 1阶K理论闭合方案 |
| 垂直扩散 | 显式ACM2非局地方案 |
| 干沉降 | Wesely(1989)阻力模型 |
| 湿沉降 | SeinfeldandPandis,1998方案 |
| 气相化学机理 | CB05 |
| 气相化学算法 | EBI |
| 气溶胶方案 | AERO6/CF方案 |
| 网格烟羽(PiG)模块 | 关 |
| 边界条件 | MOZART-4全球模型实时结果 |
| 初始条件 | MOZART-4全球模型实时结果 |
| 3D输出开关 | 打开 |
| 时间积分步长 | 6 min |
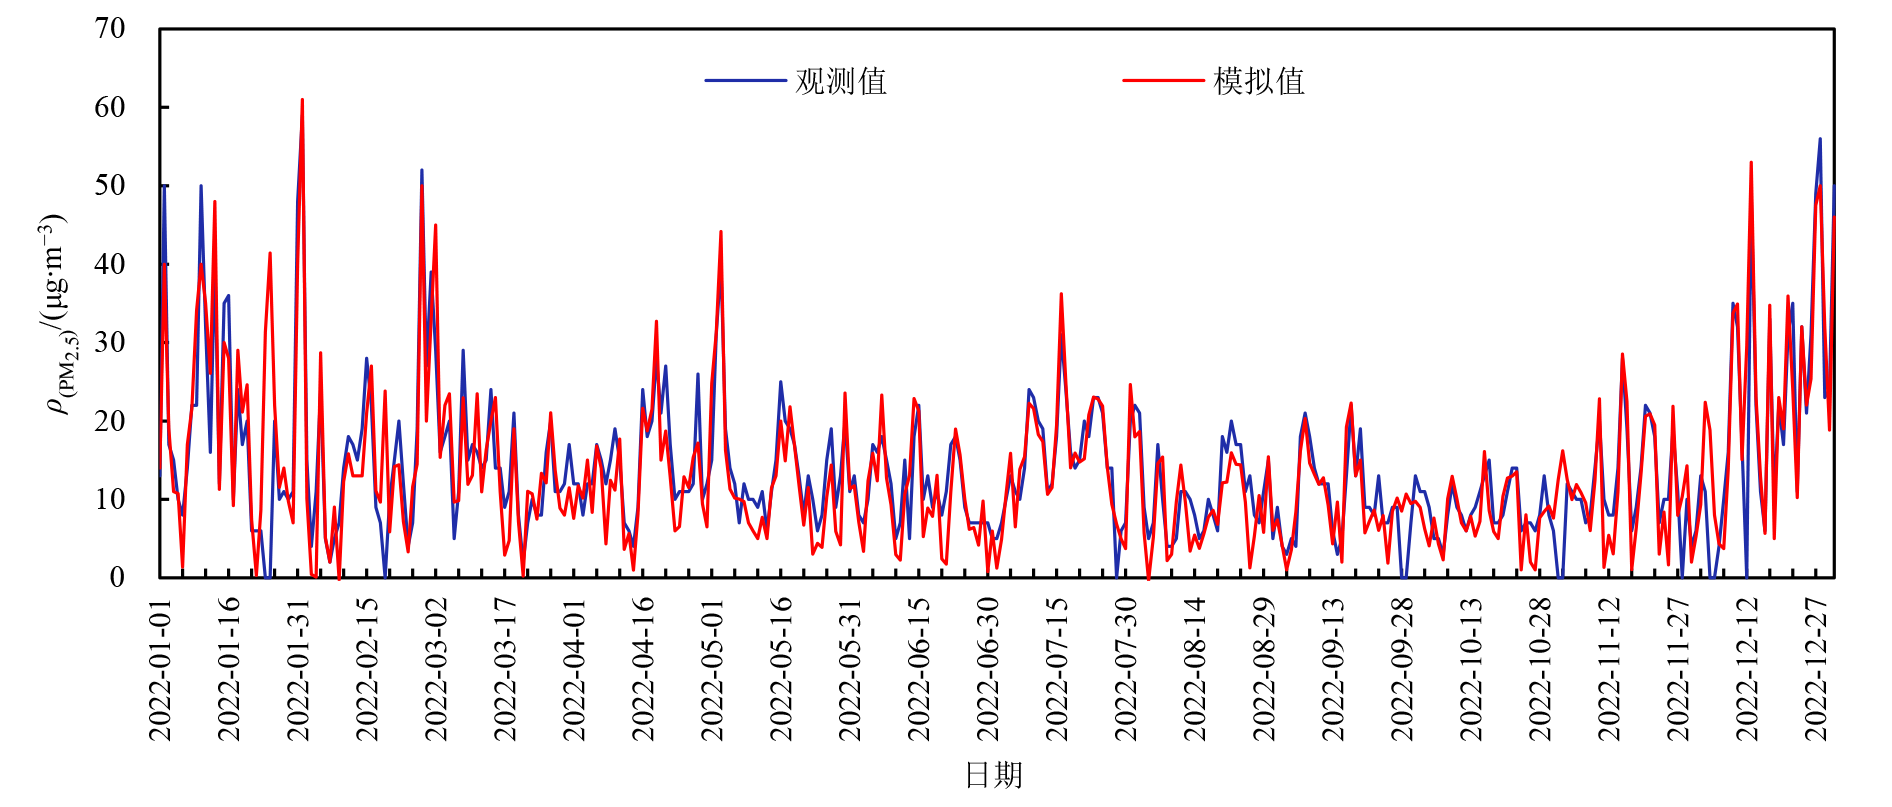
图2 舟山PM2.5模拟与观测对比图(以定海檀枫为例)
Figure 2 Comparison Chart of PM2.5 Simulation and Observation in Zhoushan (Taking Tanfeng, Dinghai as an Example)

图3 PM2.5四季代表月份模拟值与观测值空间对比图 底图为模拟值, 圆点为观测值
Figure 3 Spatial comparison of simulated and observed PM2.5 values for representative months of the four seasons
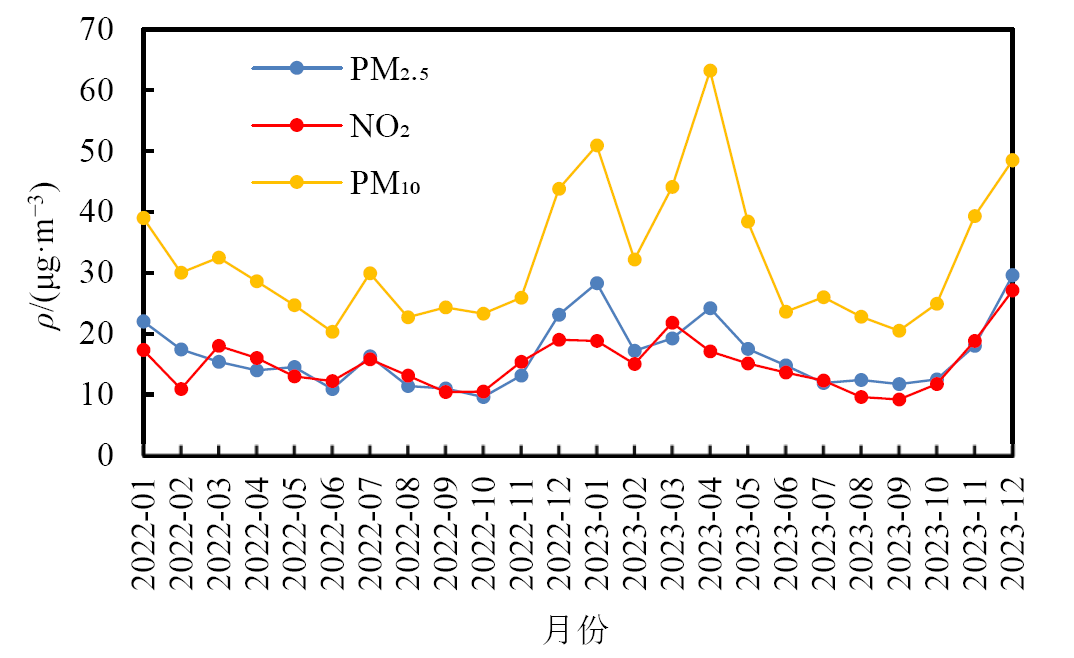
图4 2022-2023年舟山群岛新区大气污染物质量浓度月均值
Figure 4 Monthly average concentrations of atmospheric pollutants in Zhoushan Archipelago New Area (2022?2023)
| 情景编号 | 情景设置 |
|---|---|
| A | 基准情景。2022年气象场及舟山提供的清单数据,估算2022年PM2.5质量浓度达到20 µg·m−3的环境容量 |
| B | 增强基准情景。2022年气象场及舟山所提供的增强清单数据,估算2022年PM2.5质量浓度达到20 µg·m−3的环境容量 |
表2 算例情景设置
Table 2 Case scenario settings
| 情景编号 | 情景设置 |
|---|---|
| A | 基准情景。2022年气象场及舟山提供的清单数据,估算2022年PM2.5质量浓度达到20 µg·m−3的环境容量 |
| B | 增强基准情景。2022年气象场及舟山所提供的增强清单数据,估算2022年PM2.5质量浓度达到20 µg·m−3的环境容量 |
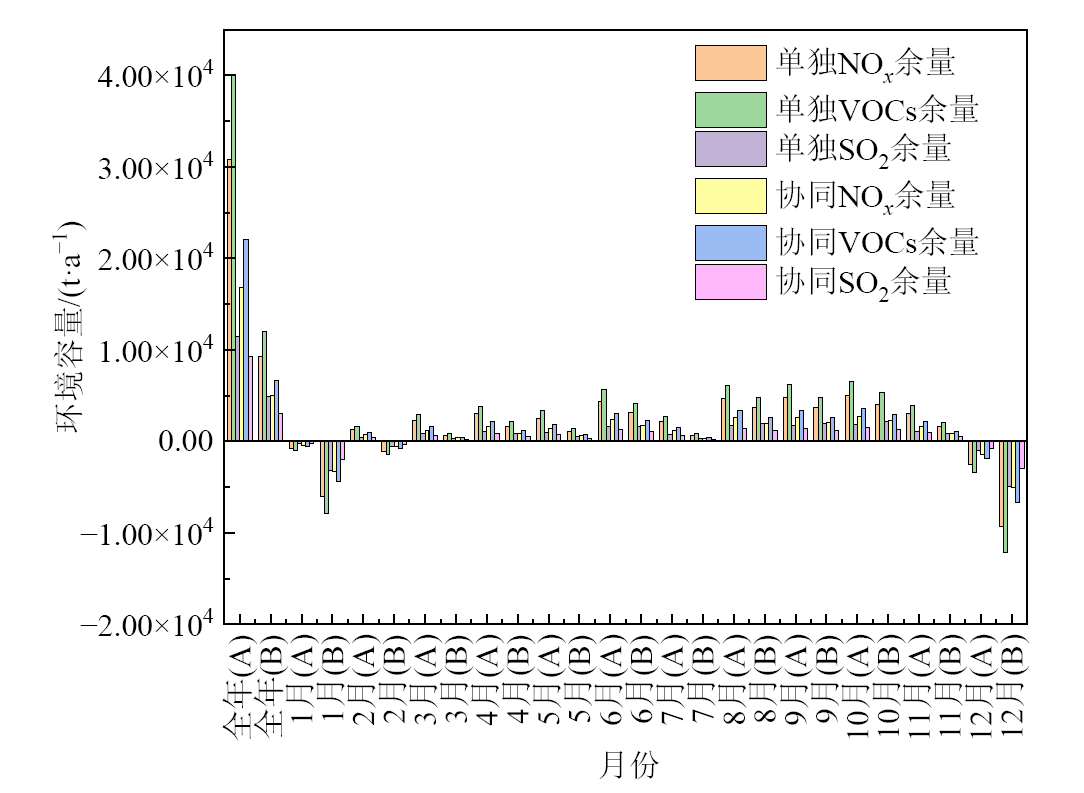
图5 2022年以PM2.5浓度为约束下多污染物在不同排放情景中环境容量月变化情况及全年总量 横坐标括号内字母代表排放情景
Figure 5 Monthly variation and annual total of multi-pollutant environmental capacity under the constraint of PM2.5 concentration in different emission scenarios in 2022
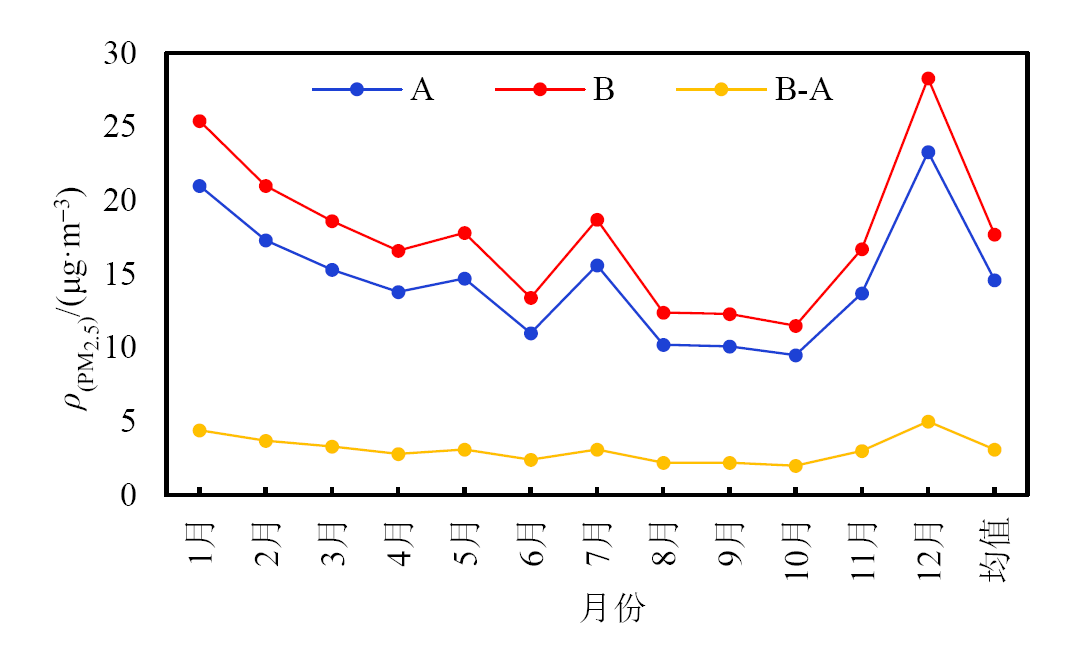
图6 2022年不同排放情景下PM2.5质量浓度月均值变化
Figure 6 Changes in PM2.5 environmental quality concentration before (A) and after (B) source addition in 2022
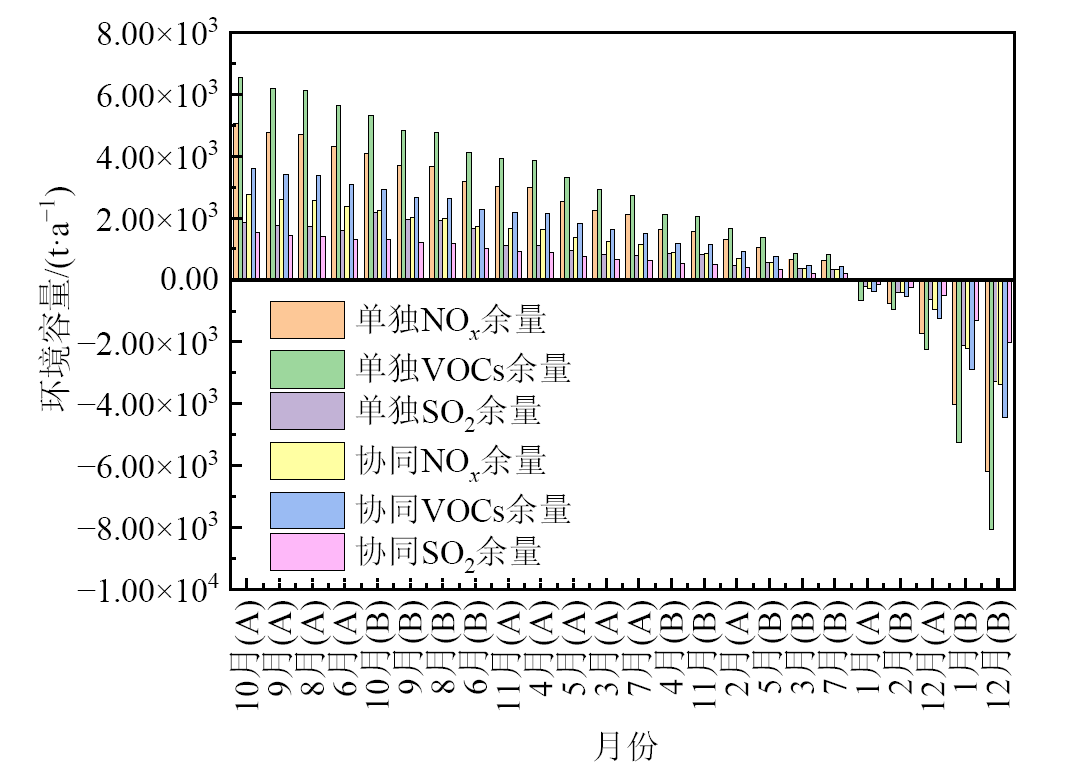
图7 2022年以PM2.5浓度为约束下多污染物在不同排放情景中环境容量升序排列情况
Figure 7 Ascending arrangement of multi-pollutant environmental capacity under the constraint of PM2.5 concentration in different emission scenarios in 2022

图8 舟山市代表月份风场与地形图
Figure 8 Wind field and topographic map of Zhoushan City in representative months
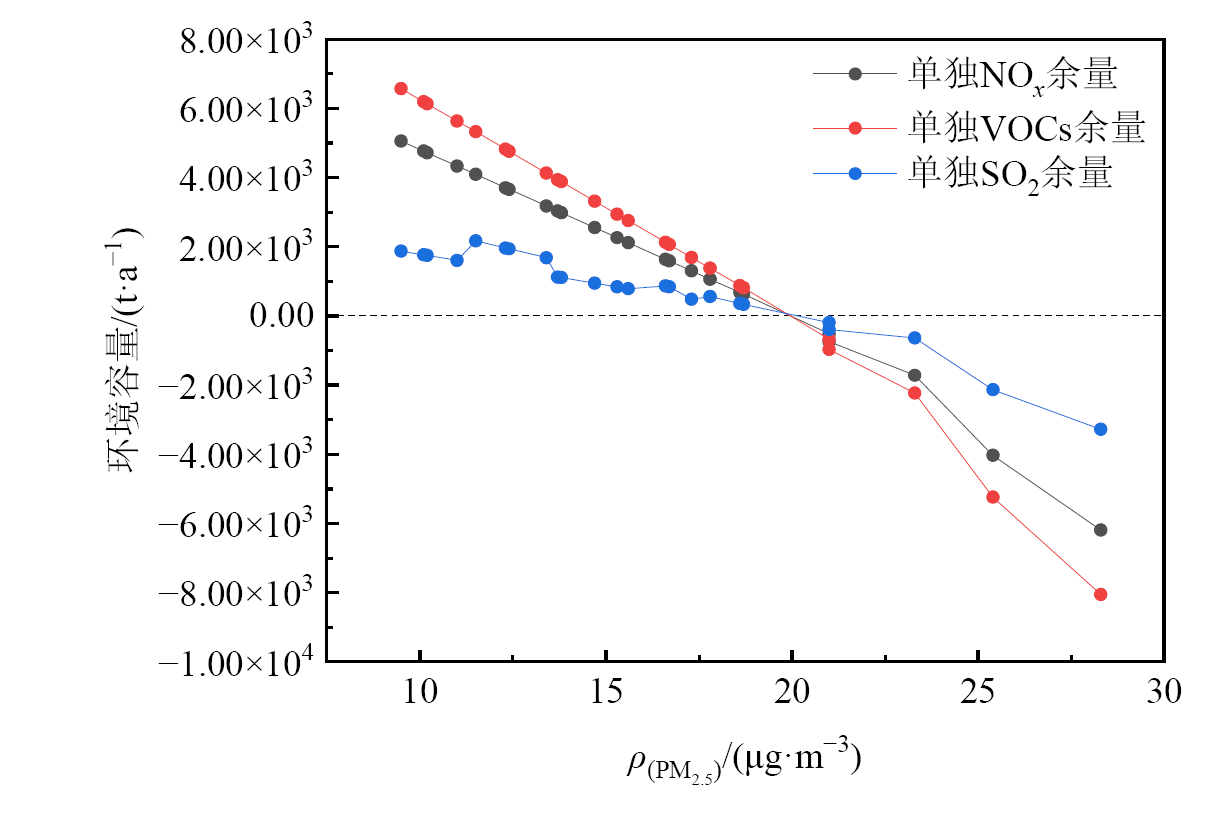
图9 2022年以PM2.5质量浓度为约束下多污染物单独排放容量
Figure 9 Individual emission capacity of multi-pollutants under the PM2.5 concentration constraint in 2022
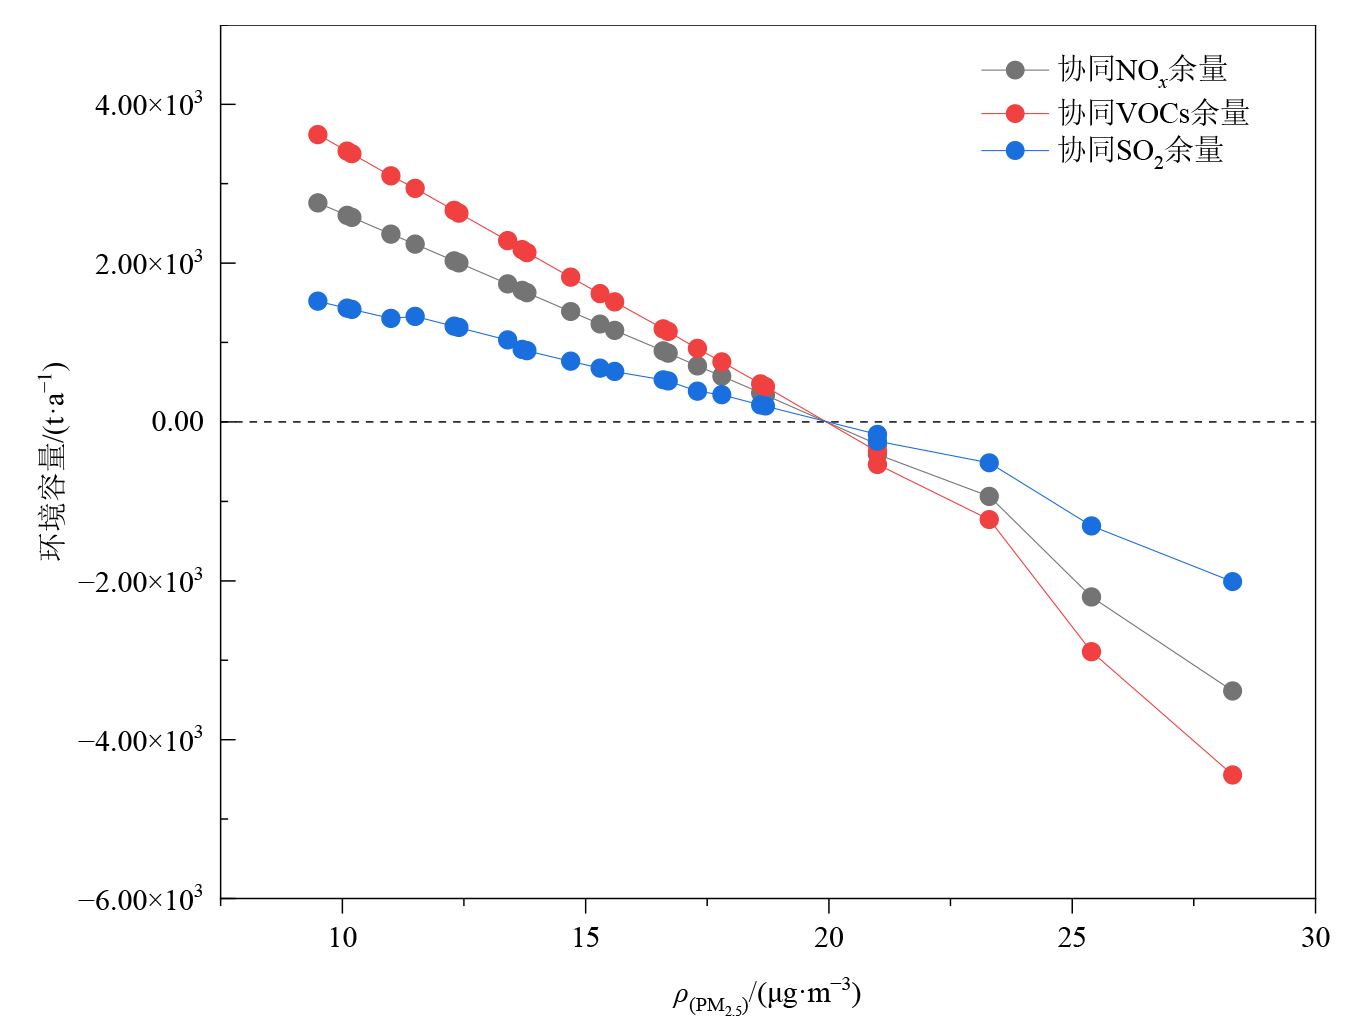
图10 2022年以PM2.5质量浓度为约束下多污染物协同排放容量
Figure 10 Synergistic emission capacity of multi-pollutants under the PM2.5 concentration constraint in 2022
| [1] | APTE J S, MARSHALL J D, COHEN A J, et al., 2015. Addressing global mortality from ambient PM2.5[J]. Environmental Science&Technology, 49(13): 8057-8066. |
| [2] |
DI R M, MA Y G, FENG J L, et al., 2022. Compositional variations of primary organic aerosol tracers of PM2.5 in Shanghai during the 2019 China International Import Expo[J]. Atmospheric Research, 275: 106205.
DOI URL |
| [3] |
STANAWAY J D, AFSHIN A, GAKIDOU E, et al., 2018. Global., regional., and national comparative risk assessment of 84 behavioural., environmental and occupational., and metabolic risks or clusters of risks for 195 countries and territories, 1990-2017: A systematic analysis for the Global Burden of Disease Study 2017[J]. The Lancet, 392(10159): 1923-1994.
DOI URL |
| [4] |
WANG H L, QIAO L P, LOU S R, et al., 2016a. Chemical composition of PM2.5and meteorological impact among three years in urban Shanghai, China[J]. Journal of Cleaner Production, 112(Part 2): 1302-1311.
DOI URL |
| [5] |
WANG Q, LIU M, YU Y P, et al., 2016b. Characterization and source apporttionment of PM2.5-bound polycyclic aromatic hydrocarbons from Shanghai city, China[J]. Environmental Pollution, 218: 118-128.
DOI URL |
| [6] |
YU H, YANG W, WANG X H, et al., 2019. A seriously sand storm mixed air-polluted aera in the margin of Tarim Basin: Temporal spatial distribution and potential sources[J]. Science of the Total Environment, 676: 436-446.
DOI URL |
| [7] |
ZHANG K, ZHOU L, FU Q Y, et al., 2020. Sources and vertical distribution of PM2.5 over Shanghai during the winter of 2017[J]. Science of the Total Environment, 706: 135683.
DOI URL |
| [8] | 蔡银寅, 2021. 大气环境资源的配置公平问题[J]. 气象科学进展, 11(3): 165-172. |
| CAI Y Y, 2021. On fair allocation problems of atmospheric enviromental resources[J]. Advances in Meteorological Science and Technology, 11(3): 165-172. | |
| [9] | 柴莹莹, 孟晓杰, 申璐, 等, 2021. 基于污染源布局规划调整的大气环境承载力研究[J]. 环境工程技术学报, 11(4): 657-662. |
| CHAI Y Y, MENG X J, SHEN L, et al., 2021. Research on atmospheric enviromental carring capacity based on adjustment of pollution sources layout[J]. Journal of Environmental Engineering Technology, 11(4): 657-662. | |
| [10] | 陈优良, 李亚倩, 2021. 长三角PM2.5和O3变化特征及与气象要素的关系[J]. 长江流域资源与环境, 30(2): 382-396. |
| CHEN Y L, LI Y Q, 2021. Characteristics of PM2.5 and O3 and its relationship with meteorological factors in Yangtze River Delta[J]. Resources and Environment in the Yangtze Basin, 30(2): 382-396. | |
| [11] | 戴轩宇, 2008. 线性规划法在区域大气环境容量计算中的应用: 以江苏省张家港市为例[D]. 南京: 南京大学. |
| DAI X Y, 2008. Application of linear programming method in regional atmospheric environmental capacity calculation: A case study of Zhangjiagang City, Jiangsu Province[D]. Nanjing: Nanjing University. | |
| [12] | 郭林浩, 2023. 基于WRF/CMAQ模式的区域大气环境承载力研究[D]. 内蒙古: 内蒙古大学. |
| GUO L H, 2023. The regional atmospheric carring capacity based on WRF/CMAQ Model in the Hohhot-Baotou-Erdos-Bayannur Region[D]. Inner Mongolia: Inner Mongolia University. | |
| [13] |
郝吉明, 许嘉钰, 吴剑, 等, 2017. 我国京津冀和西北五省 (自治区) 大气环境容量研究[J]. 中国工程科学, 19(4): 13-19.
DOI |
|
HAO J M, XU J Y, WU J, et al., 2017. A study of the atmospheric environmental capacity of Jingjinji and of the five northwestern provinces and autonomous regions in China[J]. Strategic Study of CAE, 19(4): 13-19.
DOI |
|
| [14] | 胡颢琰, 孙毅, 潘静芬, 等, 2023. 舟山市生态环境质量报告书 (2022年)[R]. 舟山: 舟山市生态环境局. |
| HU H Y, SUN Y, PAN J F, et al., 2023. Zhoushan City Ecological Environment Quality Report (2022)[R]. Zhoushan: Zhoushan Ecological Environment Bureau. | |
| [15] | 李江苏, 段良荣, 张天娇, 2024. 中国城市PM2.5和PM10时空分布特征和影响因素分析[J]. 环境科学, 45(4): 1938-1949. |
| LI J S, DUAN L R, ZHANG T J, 2024. Analysis of Spatio-temporal Distribution Characteristics and Influencing Factors of PM2.5 and PM10 in Chinese Cities[J]. Environmental Science, 45(4): 1938-1949. | |
| [16] | 刘新, 刘林春, 尤莉, 2019. 内蒙古呼包鄂地区近56年来大气环境容量变化特征分析[J]. 气象与环境科学, 42(1): 86-92. |
| LIU X, LIU L H, YOU L, 2019. Characteristice analysis of atmospheric environmental capacity variation for recent 56 years in Hohhot-Baotou-Erdos Region in Inner Mongolia[J]. Meteorological and Enviromental Sciences, 42(1): 86-92. | |
| [17] | 刘燕, 黄文萍, 2011. 呼和浩特市大气环境容量研究与应用[J]. 内蒙古科技与经济 (11): 52, 70. |
| LIU Y, HUANG W P, 2011. Research and application of atmospheric environmental capacity in Hohhot City[J]. Inner Mongolia Science Technology & Economy (11): 52, 70. | |
| [18] | 卢小丽, 鲁玉龙, 刘玉磊, 等, 2018. 绍兴市大气环境容量与污染控制研究[J]. 环境科学导刊, 37(6): 52-57. |
| LU X L, LU Y L, LIU Y L, et al., 2018. The study of atmospheric enviromental capacity and pollution control in Shaoxing[J]. Environmental Science Survey, 37(6): 52-57. | |
| [19] | 孟凡, 李时蓓, 2021. 大气环境容量理论的再思考和总量控制[J]. 环境科学研究, 34(7): 1583-1591. |
| MENG F, LI S B, 2021. Revisiting atmospheric environmental capacity theory and emission cap[J]. Research of Enviromental Sciences, 34(7): 1583-1591. | |
| [20] | 潘勇, 郑捷, 肖航, 2023. 长三角地区典型PM2.5污染过程和跨区域传输对宁波污染贡献评估模拟[J]. 环境科学, 44(2): 634-645. |
| PAN Y, ZHENG J, XIAO H, 2023. Simulation evaluation of the contribution of typical PM2.5 pollution and trans-regional transport to ningbo pollution in the Yangtze River Delta[J]. Environmental Science, 44(2): 634-645. | |
| [21] | 田俊杰, 丁祥, 安静宇, 等, 2023. 长三角区域人为源活性挥发性有机物高分辨率排放清单[J]. 环境科学, 44(1): 58-65. |
| TIAN J J, DING X, AN J Y, et al., 2023. High-resolution emission inventory of reactive volatile organic compounds from anthropogenic sources in Yangtze River Delta Region[J]. Environmental Science, 44(1): 58-65 | |
| [22] | 汪辉, 刘强, 王昱, 等, 2019. 基于Model-3/CMAQ和CAMx模式的台州市PM2.5数值模拟研究[J]. 环境与可持续发展, 29(3): 93-96. |
| WANG H, LIU Q, WANG Y, et al., 2019. Numerical study of PM2.5 pollution in Taizhou based on Model-3/CMAQ and CAMx[J]. Environment and Sustainable Development, 29(3): 93-96. | |
| [23] | 王宏超, 王晓辉, 2017. 基于A值法的区域大气环境容量研究——以宁国市工业区为例[J]. 广东化工, 44(24): 76-77, 83. |
| WANG H C, WANG X H, 2017. Study on regional atmospheric environmental capacity based on a value method: Taking Ningguo industrial zone as an example[J]. Guangdong Chemical Industry, 44(24): 76-77, 83. | |
| [24] | 谢永霞, 门雪燕, 李永革, 等, 2020. 安阳市大气环境容量核算技术路线研究[J]. 绿色科技, (4): 43-45. |
| XIE Y X, MEN X Y, LI Y G, et al., 2020. Research on the technical route of atmospheric environmental capacity accounting in Anyang City[J]. Journal of Green Science and Technology, (4): 43-45. | |
| [25] | 徐大海, 王郁, 朱蓉, 2018. 中国大陆地区大气环境容量及城市大气环境荷载[J]. 中国科学: 地球科学, 48(7): 924-937. |
| XU D H, WANG Y, ZHU R, 2018. Atmospheric environmental capacity and urban atmospheric load in mainland China[J]. Science China: Earth Sciences, 48(7): 924-937. | |
| [26] | 薛文博, 付飞, 王金南, 等, 2014. 基于全国城市PM2.5达标约束的大气环境容量模拟[J]. 中国环境科学, 34(10): 2490-2496. |
| XUE W B, FU F, WANG J N, et al., 2014. Modeling study on atmospheric environmental capacity of major pollutants constrained by PM2.5 compliance of Chinese cities[J]. China Environmental Science, 34(10): 2490-2496. | |
| [27] | 叶深, 王鹏, 黄祎, 等, 2023. 长三角城市群城市空间形态对PM2.5与O3污染空间异质性特征的影响研究[J]. 生态环境学报, 33(10): 1771-1784. |
| YE S, WANG P, HUANG Y, et al., 2023. Urban morphology and the influence of the spatial heterogeneity of PM2.5 and O3 pollution: The case of the Yangtze River Delta[J]. Ecolgy and Environmental Science, 33(10): 1771-1784. | |
| [28] | 尹稚祯, 何秉宇, 陈瑞, 2018. 工业园区SO2大气环境容量时间变化特征分析[J]. 新疆大学学报(自然科学版), 35(4): 522-527. |
| YIN Z Z, HE B Y, CHEN R, 2018. Analysis of time variation characteristics of SO2 atmospheric environmental capacity in industrial park[J]. Joural of Xinjiang University (Natural Science Edition), 35(4): 522-527. | |
| [29] | 张书源, 程全国, 邢红彬, 2022. 基于数据挖掘技术的PM2.5污染与居民死亡人数的暴露-反应关系[J]. 沈阳大学学报 (自然科学版), 34(1): 17-23. |
| ZHANG S Y, CHENG Q G, XING H B, 2022. Exposure-response relationship between PM2.5 pollution and death toll of residents based on data mining technology[J]. Joural of Shenyang University (Natural science), 34(1): 17-23. | |
| [30] | 张懿华, 2022. 长三角地区PM2.5区域性污染时空变化特征[J]. 环境科学研究, 35(1): 1-10. |
| ZHANG Y H, 2022. Spatial-temporal characteristics of PM2.5 regional pollution in Yangtze River Delta Region[J]. Research of Enviromental Sciences, 35(1): 1-10. | |
| [31] | 赵安周, 相恺政, 刘宪锋, 等, 2022. 2000-2018年京津冀城市群PM2.5时空演变及其与城市扩张的关联[J]. 环境科学, 43(5): 2274-2283. |
| ZHAO A Z, XIANG K Z, LIU X F, et al., 2022. Spatio-temporal evolution patterns of PM2.5 and relationship with urban expansion in Beijing-Tianjing-Hebei Urban Agglomeration from 2000 to 2010 to 2018[J]. Environmental Science, 43(5): 2274-2283. | |
| [32] | 中华人民共和国生态环境部, 2012. 环境空气质量标准: GB 3095—2012 [S]. 北京: 中国环境科学出版社. |
| Ministry of Ecology and Environment of the People's Republic of China, 2012. Ambient Air Quality Standards: GB 3095—2012 [S]. Beijing: China Environmental Science Press. |
| [1] | 杜若愚, 马潇瑶, 陈江耀. 基于NO+ PTR-QMS在线观测评估广州市夏季大气VOCs的光化学损失及二次环境效应[J]. 生态环境学报, 2026, 35(1): 112-123. |
| [2] | 张蔷, 李令军, 鹿海峰, 刘保献, 李琪, 王涵霖. 北京地区9种典型绿化树种的BVOCs释放及二次污染生成潜势[J]. 生态环境学报, 2025, 34(9): 1432-1441. |
| [3] | 包雪儿, 包海, 赵玲玲, 昂给拉玛. 内蒙古高原农作物挥发性有机物排放特征[J]. 生态环境学报, 2025, 34(9): 1442-1451. |
| [4] | 陈思宇, 孙丽娟, 苏枞枞, 于兴娜. 太原市春夏季VOCs组成特征及其对二次有机气溶胶和臭氧的贡献[J]. 生态环境学报, 2025, 34(4): 548-555. |
| [5] | 高星星, 包海, 丁艳旭. 夏季呼和浩特市生物源挥发性有机物排放速率空间分布[J]. 生态环境学报, 2024, 33(12): 1902-1913. |
| [6] | 许肖云, 饶芝菡, 蒋红斌, 张巍, 陈超, 杨永安, 胡艳丽, 魏海川. 遂宁工业园区夏季VOCs污染特征及其对O3、SOA生成潜势研究[J]. 生态环境学报, 2023, 32(5): 956-968. |
| [7] | 李少宁, 李婷婷, 陶雪莹, 赵娜, 徐晓天, 鲁绍伟. 4种落叶树种释放有益挥发性有机物的比较研究[J]. 生态环境学报, 2023, 32(1): 123-128. |
| [8] | 李少宁, 陶雪莹, 李慧敏, 赵娜, 徐晓天, 鲁绍伟. 侧柏和垂柳释放有益BVOCs组分生长季动态变化特征研究[J]. 生态环境学报, 2022, 31(2): 257-264. |
| [9] | 李少宁, 陶雪莹, 李绣宏, 赵娜, 徐晓天, 鲁绍伟. 植物释放有益挥发性有机物研究进展[J]. 生态环境学报, 2022, 31(1): 187-195. |
| [10] | 白建辉. 亚热带森林BVOCs排放和其影响因子之间的相互关系[J]. 生态环境学报, 2021, 30(5): 889-897. |
| 阅读次数 | ||||||
|
全文 |
|
|||||
|
摘要 |
|
|||||