生态环境学报 ›› 2025, Vol. 34 ›› Issue (9): 1442-1451.DOI: 10.16258/j.cnki.1674-5906.2025.09.011
包雪儿1( ), 包海1,2,*(), 赵玲玲1, 昂给拉玛1
收稿日期:2025-03-24
出版日期:2025-09-18
发布日期:2025-09-05
通讯作者:
*E-mail: baohai@imnu.edu.cn
作者简介:包雪儿(2001年生),女,硕士研究生,主要从事生物源挥发性有机物的研究。E-mail: 3311954216@qq.com
基金资助:
BAO Xueer1(), BAO Hai1,2,*(), ZHAO Lingling1, ANG Geilama1
Received:2025-03-24
Online:2025-09-18
Published:2025-09-05
摘要:
农田生态系统正成为继森林和草原之后第三大生物源挥发性有机物(Biogenic Volatile Organic Compounds,BVOCs)排放源。以内蒙古高原主要农作物[玉米(Zea mays L.)、马铃薯(Solanum tuberosum L.)和水稻(Oryza sativa L.)]为对象,采用动态箱采样结合ATD-GC/MS技术,测定其BVOCs排放特征,并通过G93与G95模型耦合温度、光合有效辐射(PAR)等参数,计算标准状态(T=303 K,PAR=1000 μmol∙m−2∙s−1)下的排放速率,结果表明:1)3种农作物均排放α−蒎烯、崁烯、β−蒎烯、β−月桂烯、α−水芹烯、3−蒈烯、α−萜品烯、对伞花烃、柠檬烯、γ−萜品烯、萜品油烯(单萜烯)、异戊二烯和苯、甲苯、乙基苯、间二甲苯、对二甲苯、邻二甲苯(BTEX)等18种挥发性有机物;2)玉米的异戊二烯、单萜烯和苯系物排放速率分别为15.8-363、4.36-94.5、46.9-706 µg∙g−1∙h−1,马铃薯这3种物质的排放速率分别为4.47-26.1、10.3-149、5.76-78.4 µg∙g−1∙h−1,水稻分别为3.69-12.7、3.52-25.8、1.70-15.1 µg∙g−1∙h−1;3)玉米的异戊二烯、单萜烯和BTEX在标准状态下的排放速率分别为156、9.49、125 µg∙g−1∙h−1,马铃薯这3种物质在标准状态下的排放速率分别为16.9、39.6、14.1 µg∙g−1∙h−1,水稻分别为3.66、4.05、3.41 µg∙g−1∙h−1。内蒙古高原主要农作物BVOCs排放速率呈现明显的温度与PAR依赖性及日变化规律。该结果可为研究内蒙古高原BVOCs排放速率对区域环境臭氧浓度的贡献提供科学依据。
中图分类号:
包雪儿, 包海, 赵玲玲, 昂给拉玛. 内蒙古高原农作物挥发性有机物排放特征[J]. 生态环境学报, 2025, 34(9): 1442-1451.
BAO Xueer, BAO Hai, ZHAO Lingling, ANG Geilama. Characteristics of Volatile Organic Compounds Emissions from Crops in the Inner Mongolian Plateau[J]. Ecology and Environmental Sciences, 2025, 34(9): 1442-1451.
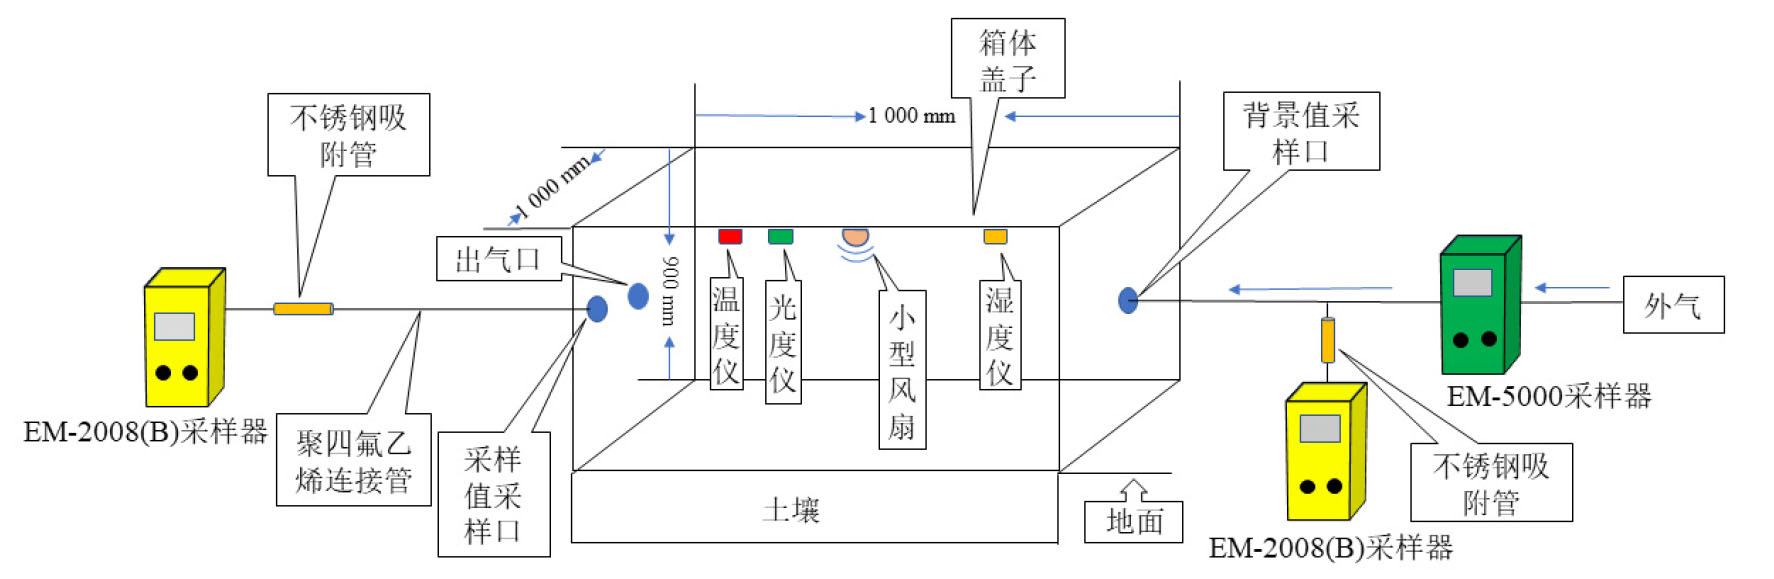
图1 动态采样箱示意图
Figure 1 Diagram of the dynamic chamber system
| 有效样品数、BVOCs种类及气象条件1) | 农作物种类、采样日期及其BVOCs排放速率/(µg∙g−1∙h−1) | ||||||||||||||
|---|---|---|---|---|---|---|---|---|---|---|---|---|---|---|---|
| 玉米Zea mays L. | 马铃薯Solanum tuberosum L. | 水稻Oryza sativa L. | |||||||||||||
| 20230715 | 20230716 | 20230717 | 平均值 | 20230720 | 20230722 | 20230723 | 平均值 | 20230814 | 20230815 | 20230816 | 平均值 | ||||
| 有效样品数 | 12 | 12 | 12 | 12 | 12 | 12 | 12 | 12 | 12 | ||||||
| 异戊二烯 | 25.5-763 | 13.2-249 | 8.72-77.7 | 15.8-363 | 6.20-9.19 | 3.48-37.3 | 3.72-31.8 | 4.47-26.1 | 1.94-8.51 | 8.41-10.1 | 0.73-19.6 | 3.69-12.7 | |||
| α−蒎烯 | 0.98-64.6 | 0.67-20.1 | 0.02-0.46 | 0.57-28.4 | 1.12-11.1 | 0.36-20.5 | 0.04-9.74 | 0.51-13.8 | 1.05-10.2 | 0.02-3.09 | 0.08-0.18 | 0.38-4.48 | |||
| 崁烯 | 0.03-63.4 | 0.20-29.6 | 0.25-0.53 | 0.48-31.6 | 2.55-19.4 | 2.67-34.5 | 0.05-9.09 | 1.76-20.9 | 0.17-3.97 | 0.05-5.94 | 0.03-0.71 | 0.08-3.54 | |||
| β−蒎烯 | 0.06-0.35 | 0.46-5.25 | 0.24-1.59 | 0.25-2.40 | 0.20-57.9 | 2.70-36.2 | 0.01-11.9 | 0.97-35.4 | 0.51-3.81 | 0.04-5.79 | 0.06-0.50 | 0.20-3.37 | |||
| β−月桂烯 | 0.02-0.25 | 0.99-9.00 | 0.01-0.53 | 0.34-3.26 | 2.60-58.4 | 2.79-34.9 | 2.79-11.9 | 2.73-35.1 | 0.41-3.84 | 0.04-5.38 | 0.06-0.50 | 0.17-3.24 | |||
| α−水芹烯 | 0.30-0.51 | 0.23-1.14 | 0.03-5.26 | 0.19-2.30 | 0.13-5.89 | 3.00-8.46 | 0.11-3.16 | 1.08-5.84 | 0.02-0.14 | 0.34-0.74 | 0.04-0.05 | 0.13-0.31 | |||
| 3−蒈烯 | 0.23-0.37 | 0.10-7.68 | 0.03-2.41 | 0.12-3.49 | 0.07-5.26 | 0.36-1.55 | 0.01-9.55 | 0.15-5.45 | 0.03-0.10 | 0.03-0.97 | 0.01-0.11 | 0.02-0.39 | |||
| α−萜品烯 | 0.50-1.38 | 0.06-4.56 | 3.83-29.8 | 1.46-11.9 | 0.40-6.50 | 2.28-2.99 | 0.06-1.81 | 0.91-3.77 | 0.01-0.26 | 0.20-0.43 | 0.05-1.14 | 0.09-0.61 | |||
| 对伞花烃 | 0.41-7.66 | 0.33-6.35 | 0.02-8.02 | 0.25-5.21 | 1.10-7.88 | 0-21.1 | 0.01-6.56 | 0.37-11.9 | 0.41-2.88 | 0.02-2.70 | 0.41-6.30 | 0.28-3.96 | |||
| 柠檬烯 | 0.14-1.25 | 0.02-6.10 | 0.23-4.99 | 0.13-4.11 | 0.63-8.29 | 0.97-16.9 | 0-6.73 | 0.53-10.6 | 0.16-2.86 | 4.41-6.30 | 0.08-0.42 | 1.55-3.72 | |||
| γ−萜品烯 | 0.16-1.18 | 0.03-1.09 | 0.10-0.50 | 0.10-0.92 | 0.04-1.54 | 3.11-9.25 | 0.02-4.26 | 1.06-5.02 | 0.25-1.20 | 1.27-3.32 | 0-0.03 | 0.51-1.52 | |||
| 萜品油烯 | 1.39-1.41 | 0-1.10 | 0.01-0.44 | 0.47-0.98 | 0.22-1.51 | 0.15-0.87 | 0.17-0.36 | 0.18-0.91 | 0.07-0.48 | 0.25-0.40 | 0-0.97 | 0.11-0.62 | |||
| 单萜烯2) | 4.22-142 | 3.09-91.9 | 4.77-54.5 | 4.36-94.5 | 9.06-184 | 18.4-187 | 3.27-75.2 | 10.3-149 | 3.09-29.7 | 6.67-35.1 | 0.82-10.9 | 3.52-25.8 | |||
| 苯 | 4.10-79.3 | 1.50-53.8 | 1.39-22.5 | 2.33-51.9 | 1.11-24.2 | 1.07-4.45 | 1.20-13.6 | 1.13-14.1 | 0.18-2.00 | 0-1.89 | 0-7.05 | 0.06-3.65 | |||
| 甲苯 | 15.1-810 | 57.1-858 | 6.31-80.4 | 26.2-583 | 9.19-28.9 | 0-32.3 | 0.77-59.9 | 3.32-40.4 | 3.85-17.2 | 0-5.13 | 0-3.71 | 1.28-8.70 | |||
| 乙苯 | 7.54-16.3 | 0-20.5 | 6.12-20.8 | 4.55-19.2 | 0-6.81 | 0-4.81 | 0-7.50 | 0-6.37 | 0.81-2.00 | 0-1.15 | 0-0.33 | 0.27-1.16 | |||
| 间,对二甲苯 | 13.7-19.9 | 3.50-36.9 | 7.25-24.2 | 8.15-27.0 | 0.54-10.7 | 0-7.47 | 0-10.8 | 0.18-9.67 | 0-0.28 | 0-1.22 | 0-0.40 | 0-0.63 | |||
| 邻二甲苯 | 8.03-18.1 | 1.95-22.2 | 7.25-35.8 | 5.73-25.4 | 1.36-10.7 | 1.99-5.09 | 0.06-7.88 | 1.14-7.87 | 0.26-1.57 | 0-1.03 | 0-0.33 | 0.09-0.98 | |||
| BTEX3) | 48.5- 944 | 64.1- 991 | 28.3- 184 | 46.9- 706 | 12.20- 81.4 | 3.06- 54.1 | 2.03- 99.7 | 5.76- 78.4 | 5.10- 23.09 | 0- 10.42 | 0- 11.8 | 1.70- 15.1 | |||
| 温度4)/℃ | 30.7-40.8 | 36.4-43.8 | 41.5-50.3 | 36.2-45.0 | 36.0-54.8 | 35.4-49.5 | 25.6-41.8 | 32.3-48.7 | 41.7-51.3 | 32.7-49.3 | 32.2-50.3 | 35.6-50.3 | |||
| PAR5) | 293- 2333 | 286- 2261 | 252- 2058 | 277- 2217 | 355- 1943 | 547- 1884 | 303- 1708 | 402- 1774 | 432- 1730 | 513- 2215 | 472- 1973 | 472- 1973 | |||
表1 内蒙古高原主要农作物BVOCs排放速率及其气象条件
Table 1 Emissions of Biogenic volatile organic compounds (BVOCs) from major crops and meteorological conditions in Inner Mongolia Plateau
| 有效样品数、BVOCs种类及气象条件1) | 农作物种类、采样日期及其BVOCs排放速率/(µg∙g−1∙h−1) | ||||||||||||||
|---|---|---|---|---|---|---|---|---|---|---|---|---|---|---|---|
| 玉米Zea mays L. | 马铃薯Solanum tuberosum L. | 水稻Oryza sativa L. | |||||||||||||
| 20230715 | 20230716 | 20230717 | 平均值 | 20230720 | 20230722 | 20230723 | 平均值 | 20230814 | 20230815 | 20230816 | 平均值 | ||||
| 有效样品数 | 12 | 12 | 12 | 12 | 12 | 12 | 12 | 12 | 12 | ||||||
| 异戊二烯 | 25.5-763 | 13.2-249 | 8.72-77.7 | 15.8-363 | 6.20-9.19 | 3.48-37.3 | 3.72-31.8 | 4.47-26.1 | 1.94-8.51 | 8.41-10.1 | 0.73-19.6 | 3.69-12.7 | |||
| α−蒎烯 | 0.98-64.6 | 0.67-20.1 | 0.02-0.46 | 0.57-28.4 | 1.12-11.1 | 0.36-20.5 | 0.04-9.74 | 0.51-13.8 | 1.05-10.2 | 0.02-3.09 | 0.08-0.18 | 0.38-4.48 | |||
| 崁烯 | 0.03-63.4 | 0.20-29.6 | 0.25-0.53 | 0.48-31.6 | 2.55-19.4 | 2.67-34.5 | 0.05-9.09 | 1.76-20.9 | 0.17-3.97 | 0.05-5.94 | 0.03-0.71 | 0.08-3.54 | |||
| β−蒎烯 | 0.06-0.35 | 0.46-5.25 | 0.24-1.59 | 0.25-2.40 | 0.20-57.9 | 2.70-36.2 | 0.01-11.9 | 0.97-35.4 | 0.51-3.81 | 0.04-5.79 | 0.06-0.50 | 0.20-3.37 | |||
| β−月桂烯 | 0.02-0.25 | 0.99-9.00 | 0.01-0.53 | 0.34-3.26 | 2.60-58.4 | 2.79-34.9 | 2.79-11.9 | 2.73-35.1 | 0.41-3.84 | 0.04-5.38 | 0.06-0.50 | 0.17-3.24 | |||
| α−水芹烯 | 0.30-0.51 | 0.23-1.14 | 0.03-5.26 | 0.19-2.30 | 0.13-5.89 | 3.00-8.46 | 0.11-3.16 | 1.08-5.84 | 0.02-0.14 | 0.34-0.74 | 0.04-0.05 | 0.13-0.31 | |||
| 3−蒈烯 | 0.23-0.37 | 0.10-7.68 | 0.03-2.41 | 0.12-3.49 | 0.07-5.26 | 0.36-1.55 | 0.01-9.55 | 0.15-5.45 | 0.03-0.10 | 0.03-0.97 | 0.01-0.11 | 0.02-0.39 | |||
| α−萜品烯 | 0.50-1.38 | 0.06-4.56 | 3.83-29.8 | 1.46-11.9 | 0.40-6.50 | 2.28-2.99 | 0.06-1.81 | 0.91-3.77 | 0.01-0.26 | 0.20-0.43 | 0.05-1.14 | 0.09-0.61 | |||
| 对伞花烃 | 0.41-7.66 | 0.33-6.35 | 0.02-8.02 | 0.25-5.21 | 1.10-7.88 | 0-21.1 | 0.01-6.56 | 0.37-11.9 | 0.41-2.88 | 0.02-2.70 | 0.41-6.30 | 0.28-3.96 | |||
| 柠檬烯 | 0.14-1.25 | 0.02-6.10 | 0.23-4.99 | 0.13-4.11 | 0.63-8.29 | 0.97-16.9 | 0-6.73 | 0.53-10.6 | 0.16-2.86 | 4.41-6.30 | 0.08-0.42 | 1.55-3.72 | |||
| γ−萜品烯 | 0.16-1.18 | 0.03-1.09 | 0.10-0.50 | 0.10-0.92 | 0.04-1.54 | 3.11-9.25 | 0.02-4.26 | 1.06-5.02 | 0.25-1.20 | 1.27-3.32 | 0-0.03 | 0.51-1.52 | |||
| 萜品油烯 | 1.39-1.41 | 0-1.10 | 0.01-0.44 | 0.47-0.98 | 0.22-1.51 | 0.15-0.87 | 0.17-0.36 | 0.18-0.91 | 0.07-0.48 | 0.25-0.40 | 0-0.97 | 0.11-0.62 | |||
| 单萜烯2) | 4.22-142 | 3.09-91.9 | 4.77-54.5 | 4.36-94.5 | 9.06-184 | 18.4-187 | 3.27-75.2 | 10.3-149 | 3.09-29.7 | 6.67-35.1 | 0.82-10.9 | 3.52-25.8 | |||
| 苯 | 4.10-79.3 | 1.50-53.8 | 1.39-22.5 | 2.33-51.9 | 1.11-24.2 | 1.07-4.45 | 1.20-13.6 | 1.13-14.1 | 0.18-2.00 | 0-1.89 | 0-7.05 | 0.06-3.65 | |||
| 甲苯 | 15.1-810 | 57.1-858 | 6.31-80.4 | 26.2-583 | 9.19-28.9 | 0-32.3 | 0.77-59.9 | 3.32-40.4 | 3.85-17.2 | 0-5.13 | 0-3.71 | 1.28-8.70 | |||
| 乙苯 | 7.54-16.3 | 0-20.5 | 6.12-20.8 | 4.55-19.2 | 0-6.81 | 0-4.81 | 0-7.50 | 0-6.37 | 0.81-2.00 | 0-1.15 | 0-0.33 | 0.27-1.16 | |||
| 间,对二甲苯 | 13.7-19.9 | 3.50-36.9 | 7.25-24.2 | 8.15-27.0 | 0.54-10.7 | 0-7.47 | 0-10.8 | 0.18-9.67 | 0-0.28 | 0-1.22 | 0-0.40 | 0-0.63 | |||
| 邻二甲苯 | 8.03-18.1 | 1.95-22.2 | 7.25-35.8 | 5.73-25.4 | 1.36-10.7 | 1.99-5.09 | 0.06-7.88 | 1.14-7.87 | 0.26-1.57 | 0-1.03 | 0-0.33 | 0.09-0.98 | |||
| BTEX3) | 48.5- 944 | 64.1- 991 | 28.3- 184 | 46.9- 706 | 12.20- 81.4 | 3.06- 54.1 | 2.03- 99.7 | 5.76- 78.4 | 5.10- 23.09 | 0- 10.42 | 0- 11.8 | 1.70- 15.1 | |||
| 温度4)/℃ | 30.7-40.8 | 36.4-43.8 | 41.5-50.3 | 36.2-45.0 | 36.0-54.8 | 35.4-49.5 | 25.6-41.8 | 32.3-48.7 | 41.7-51.3 | 32.7-49.3 | 32.2-50.3 | 35.6-50.3 | |||
| PAR5) | 293- 2333 | 286- 2261 | 252- 2058 | 277- 2217 | 355- 1943 | 547- 1884 | 303- 1708 | 402- 1774 | 432- 1730 | 513- 2215 | 472- 1973 | 472- 1973 | |||
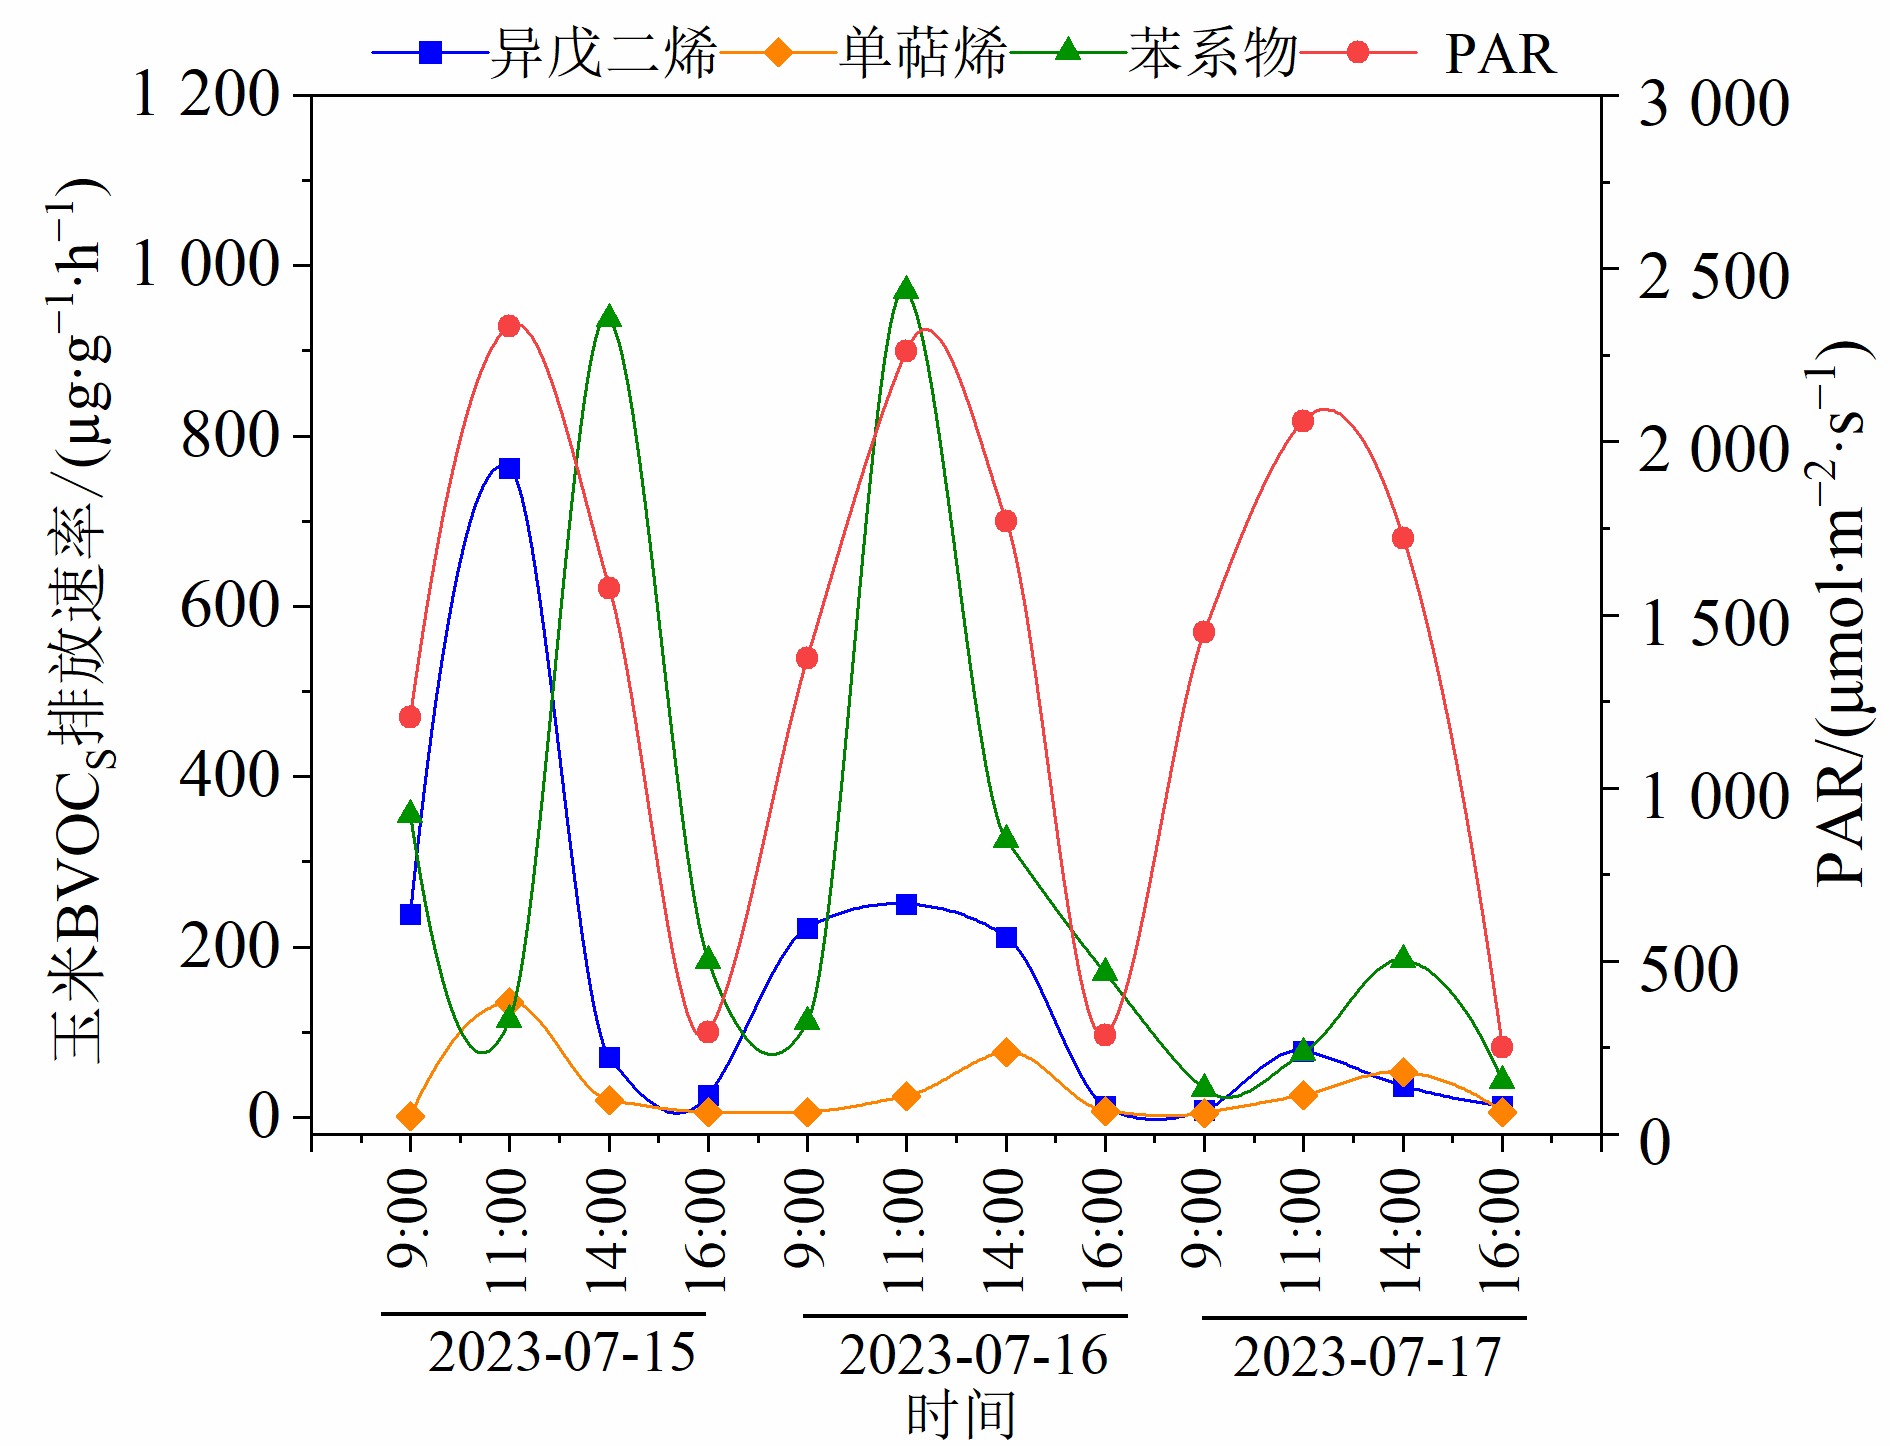
图2 玉米BVOCs排放速率随PAR的变化趋势
Figure 2 The variation of BVOC emissions from maize with PAR

图3 玉米BVOCs排放速率随温度的变化趋势
Figure 3 The variation of BVOC emissions from maize with temperature
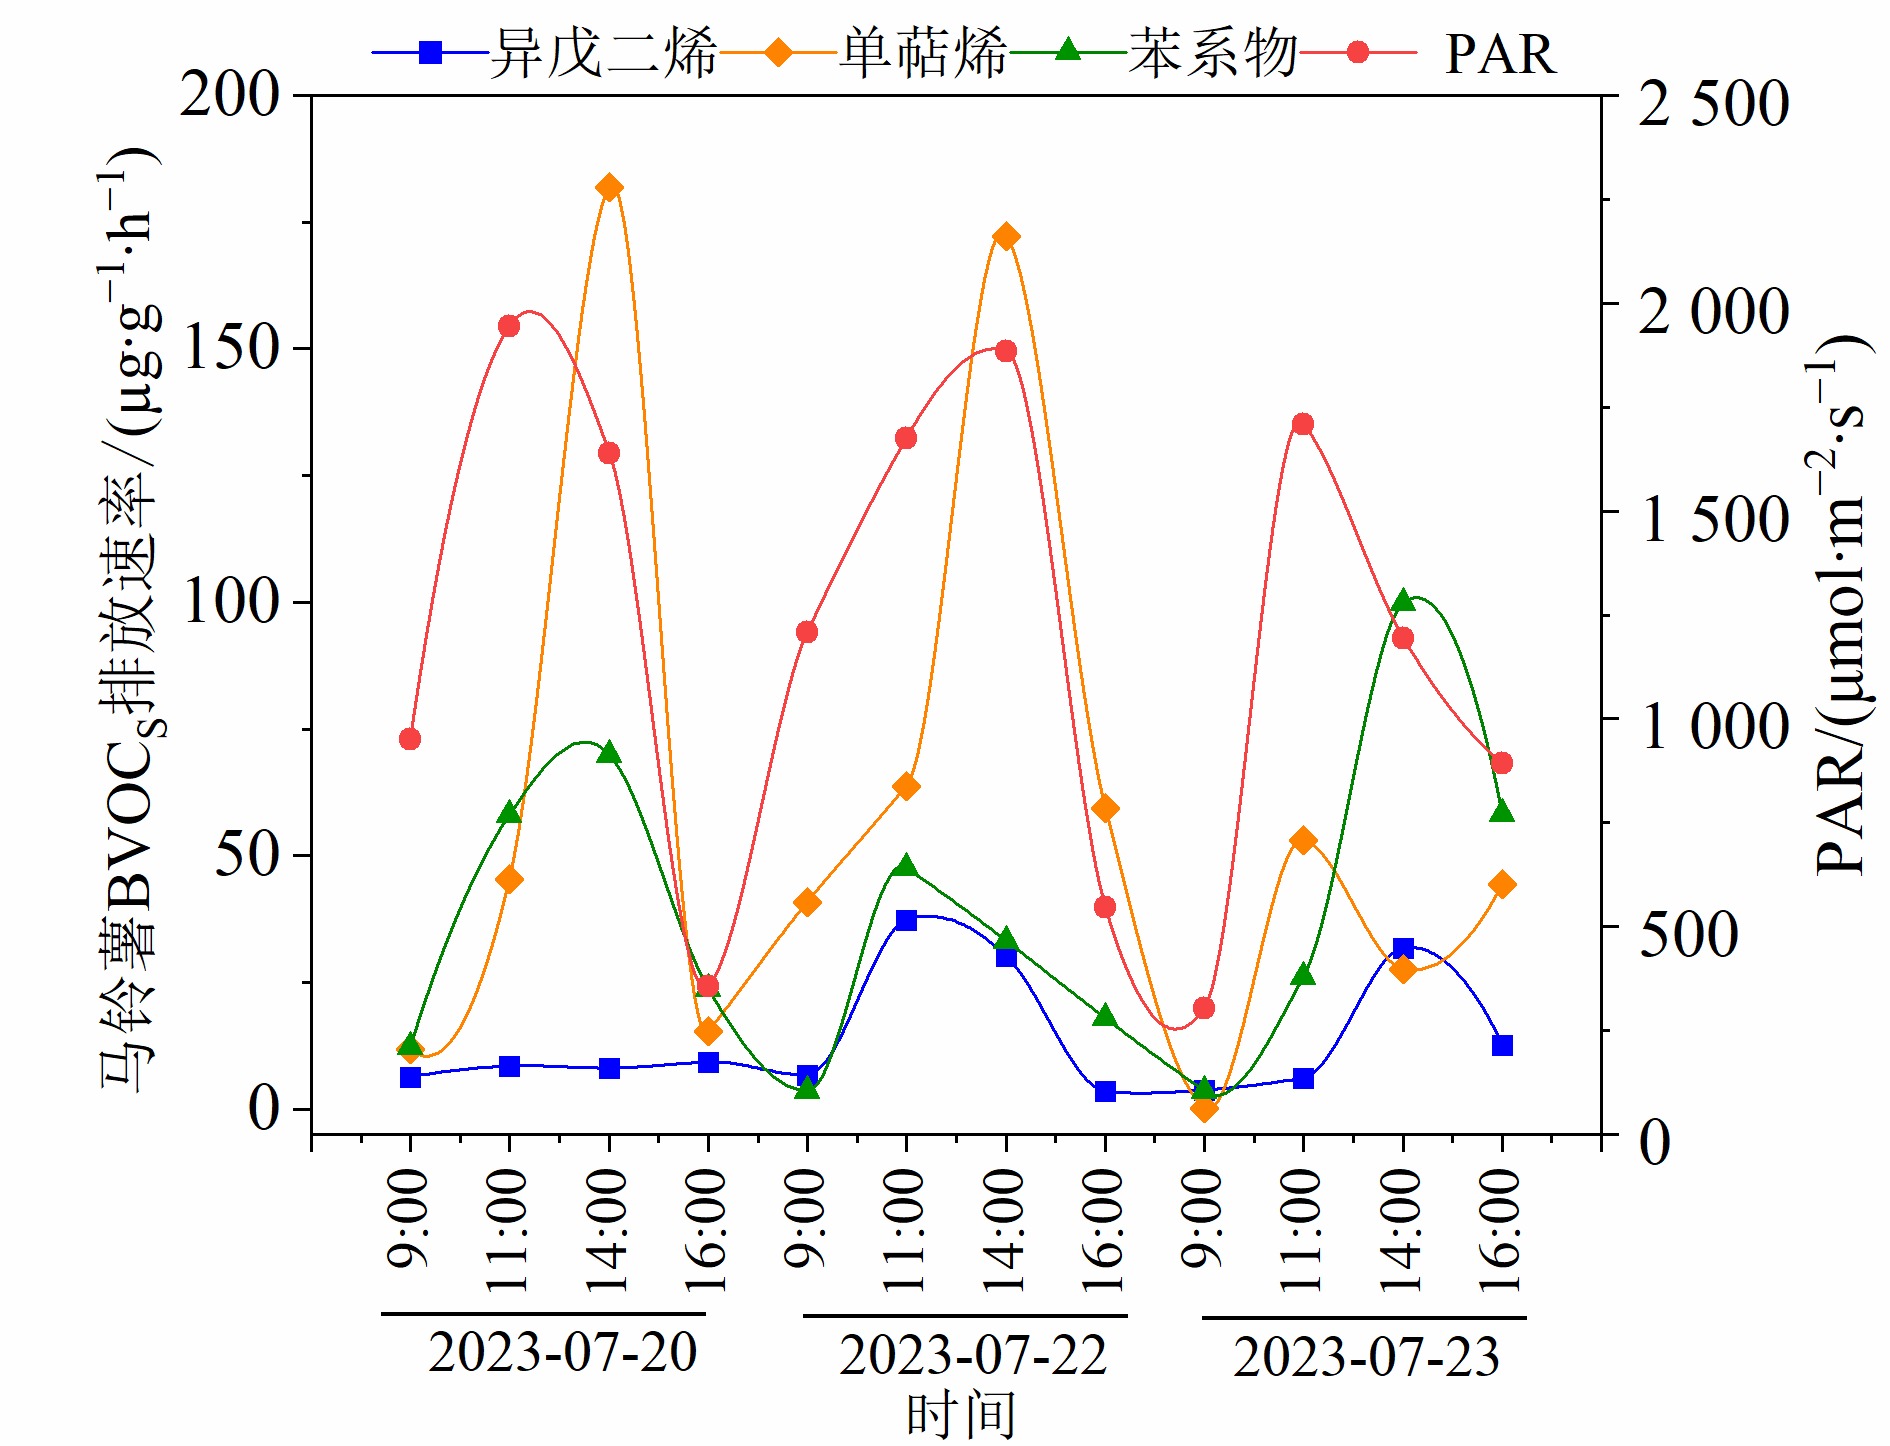
图4 马铃薯BVOCs排放速率随PAR的变化趋势
Figure 4 The variation of BVOC emissions from potato with PAR
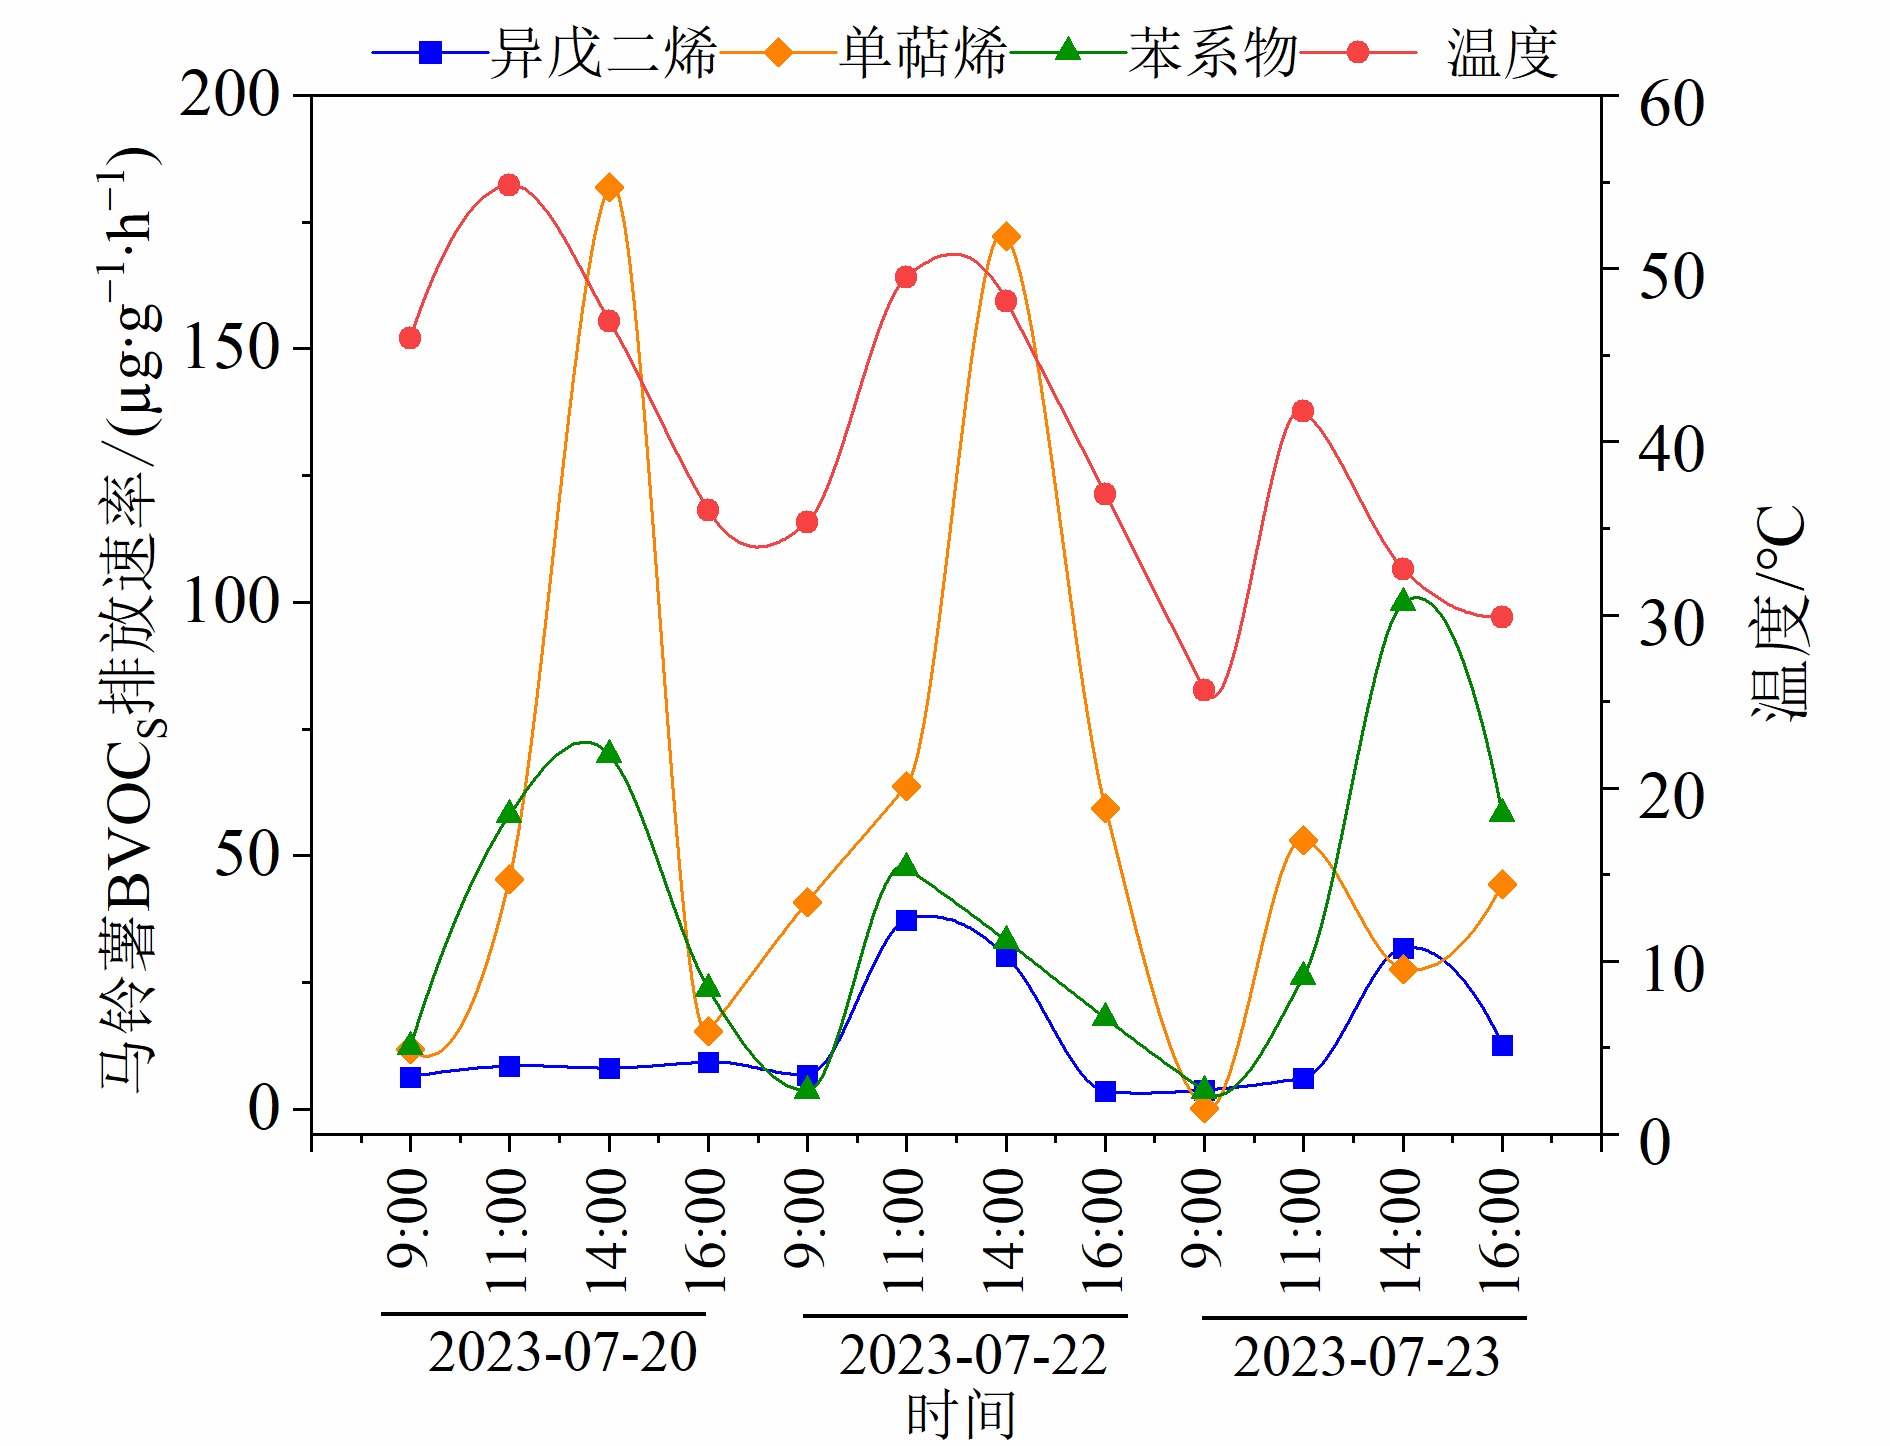
图5 马铃薯BVOCs排放速率随温度的变化趋势
Figure 5 The variation of BVOC emissions from potato with temperature
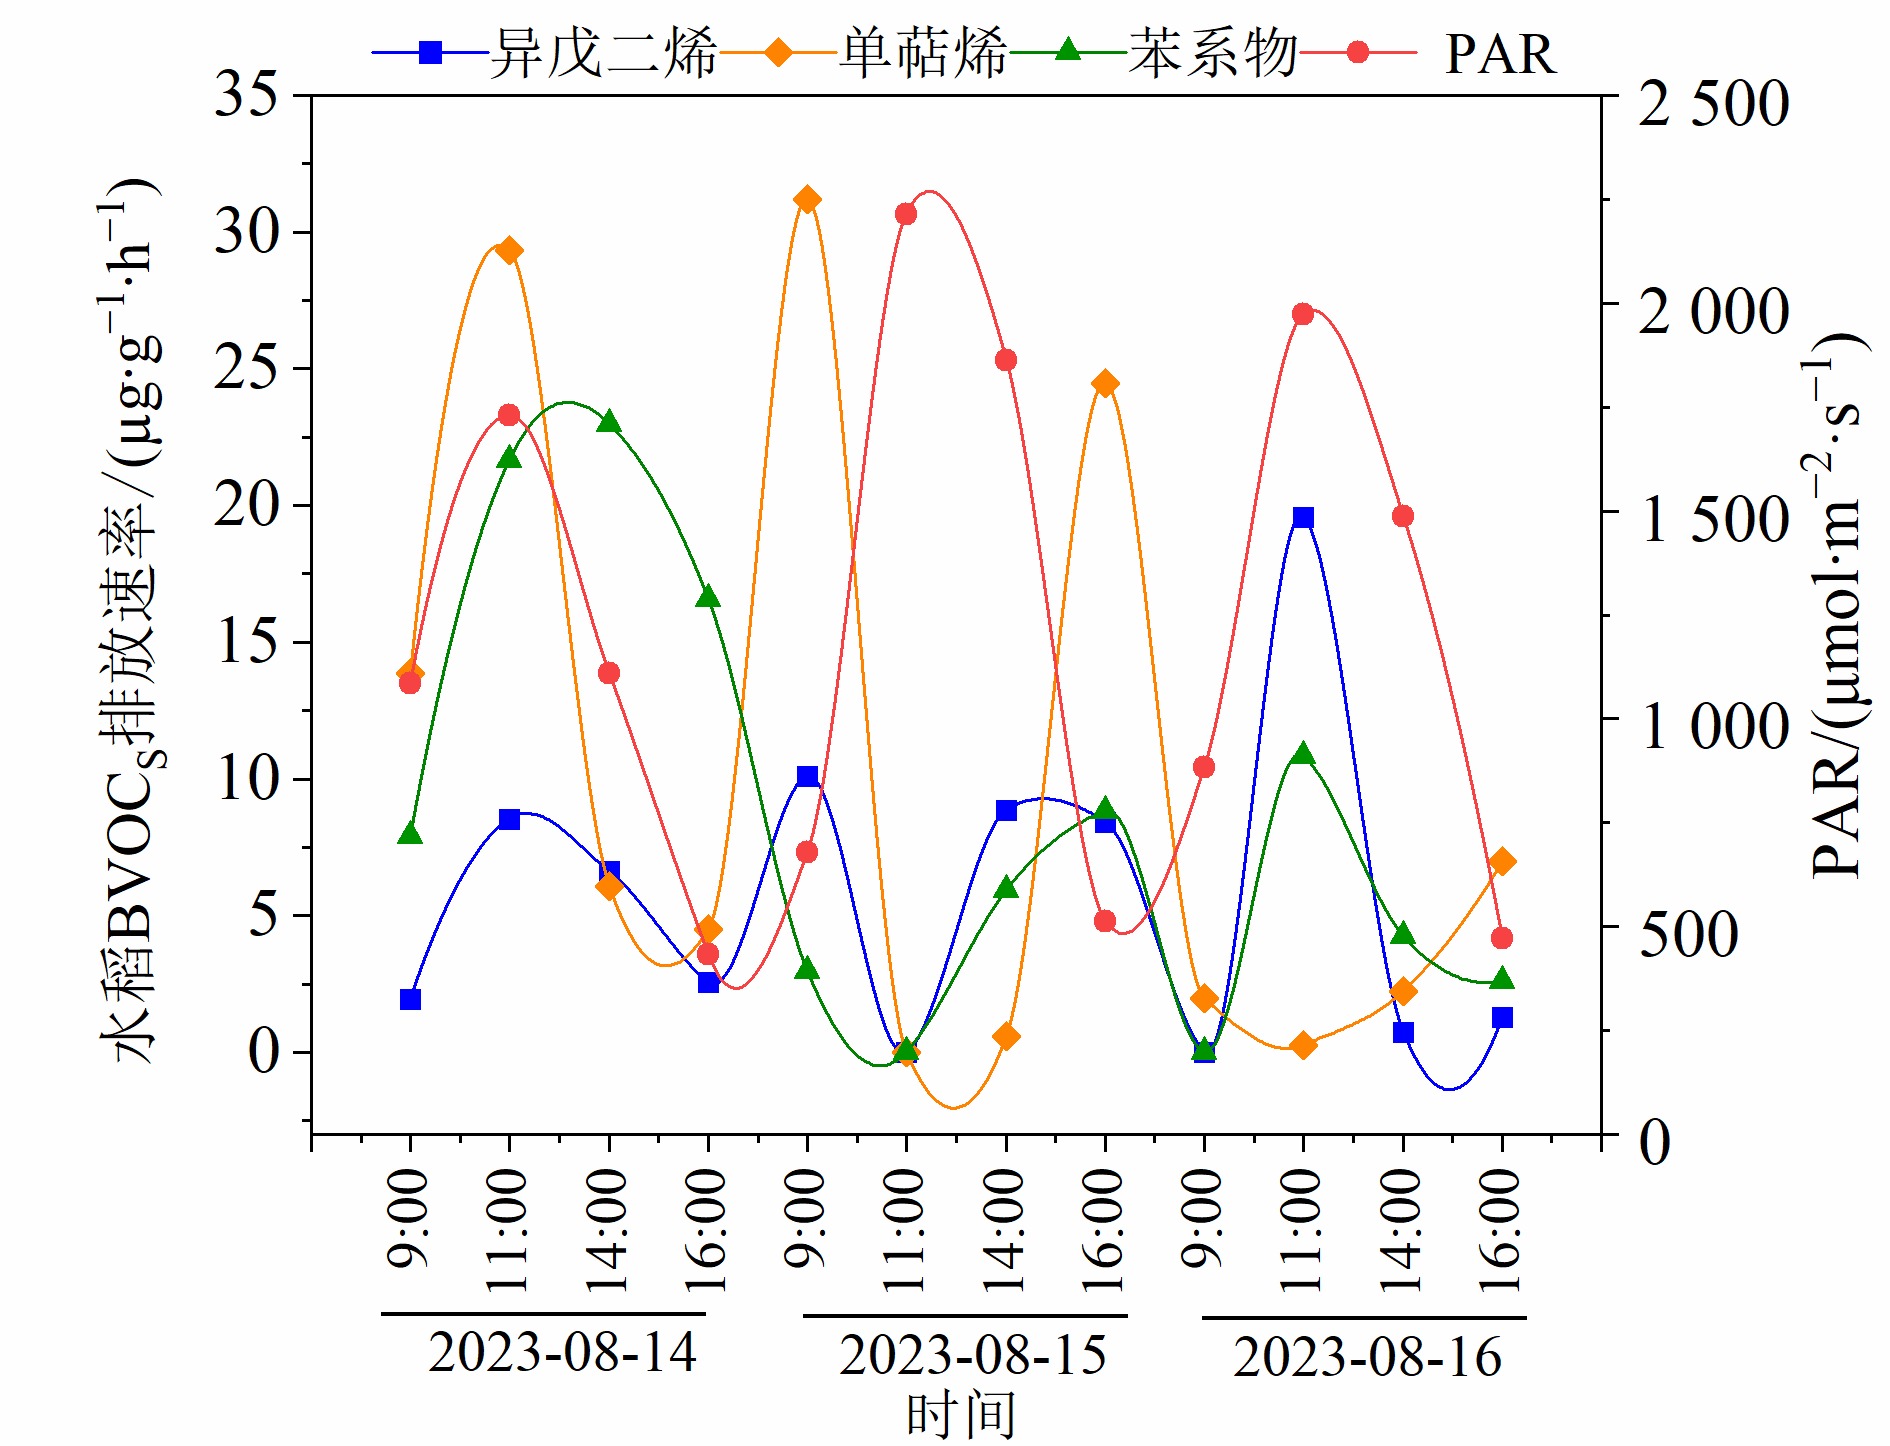
图6 水稻BVOCs排放速率随PAR的变化趋势
Figure 6 The variation of BVOC emissions from rice with PAR
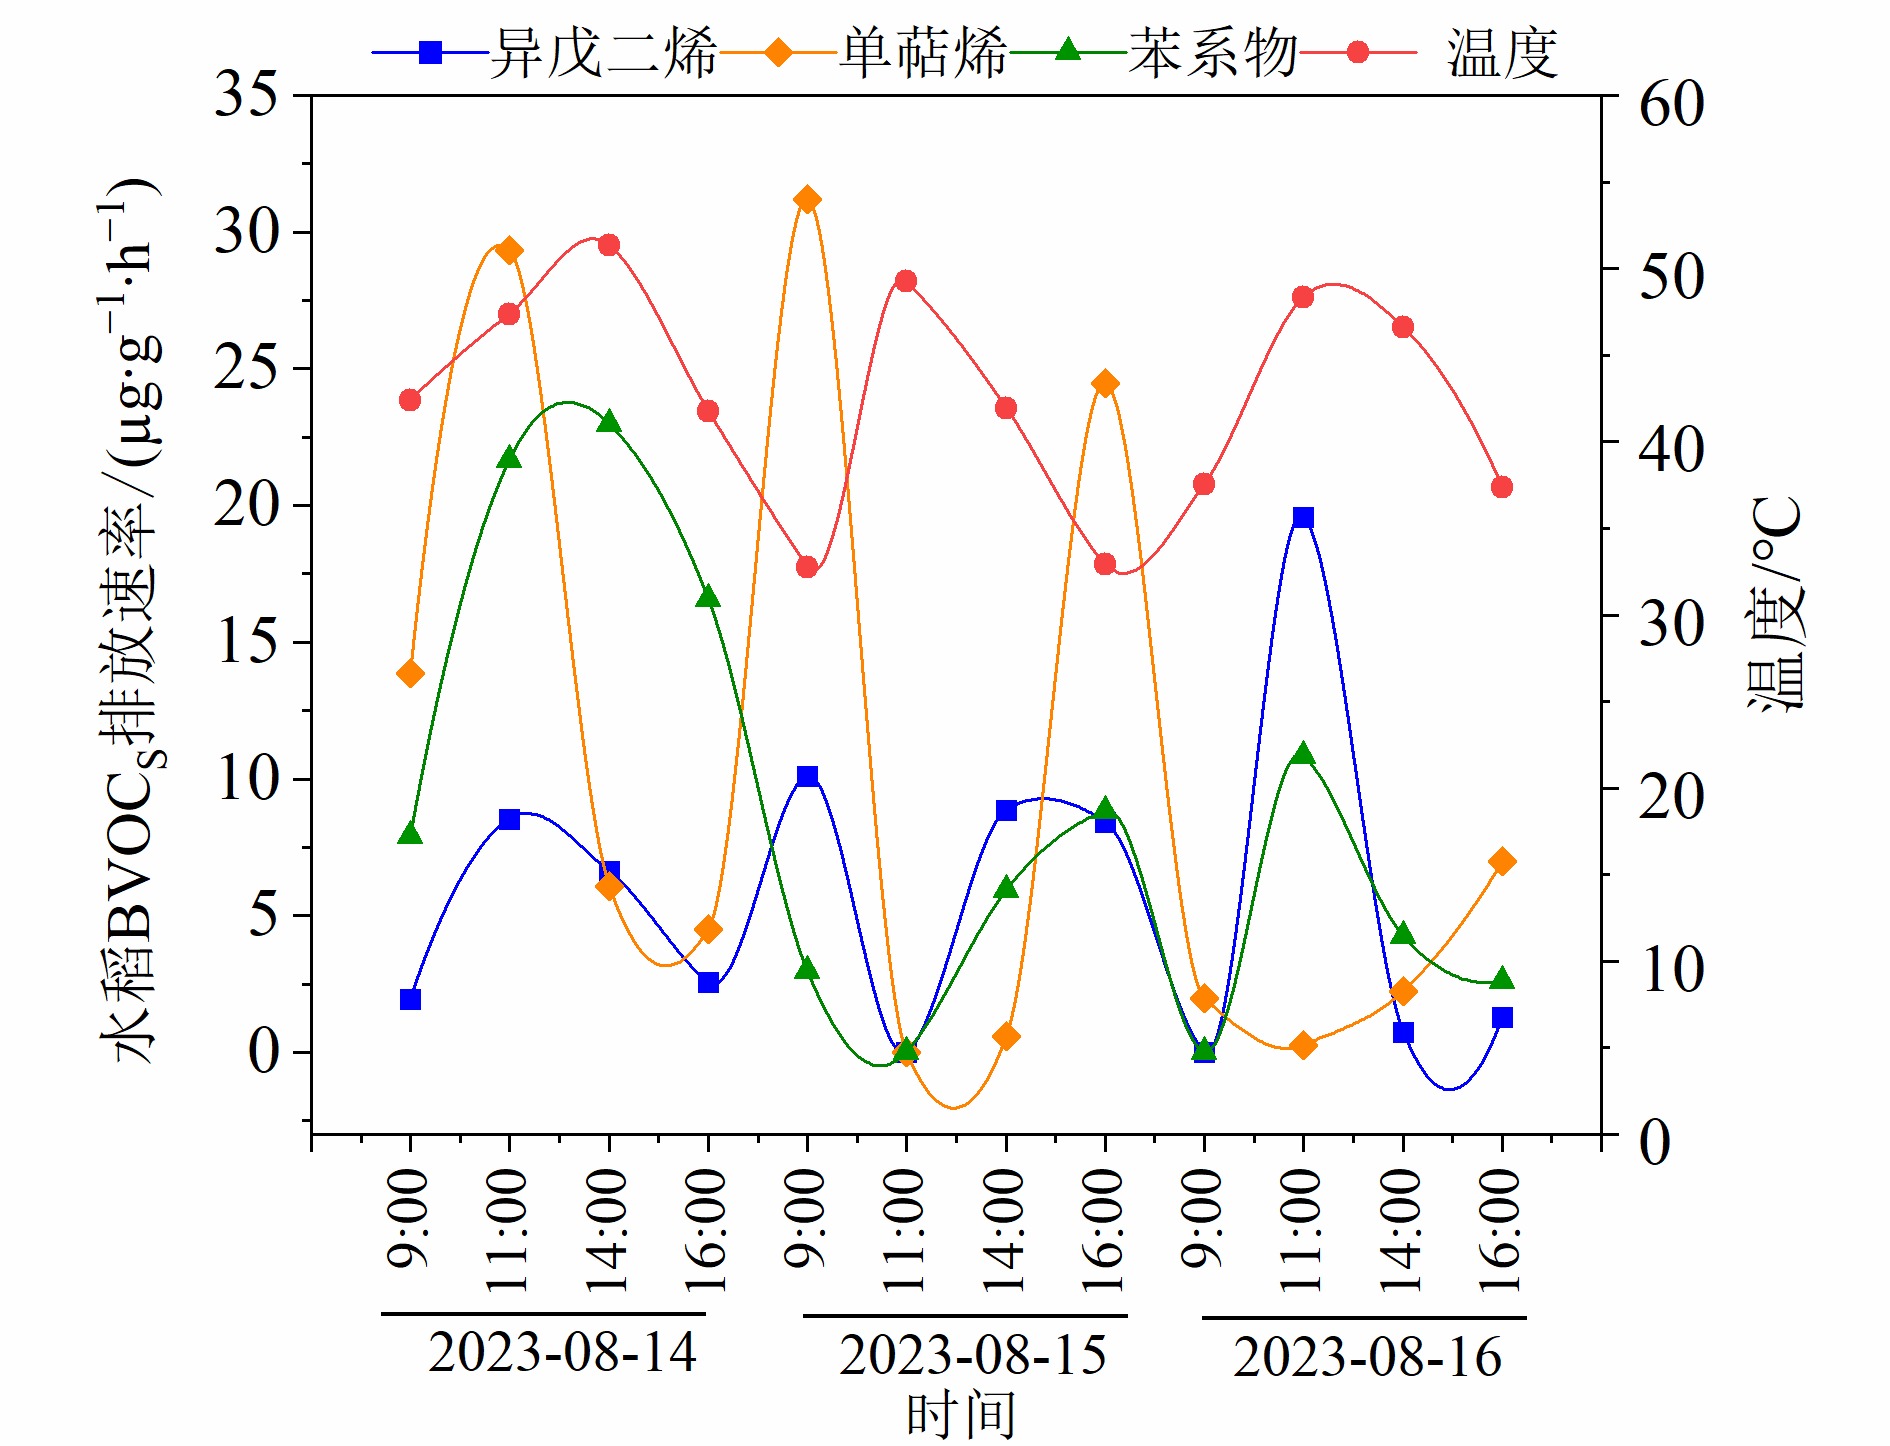
图7 水稻BVOCs排放速率随温度的变化趋势
Figure 7 The variation of BVOC emissions from rice with temperature
| 植物 种类 | 排放速率/(µg∙g−1∙h−1) | 采样 地点 | 采样 时间 | 采样 技术 | 文献 来源 | ||
|---|---|---|---|---|---|---|---|
| 异戊二烯 | 单萜烯 | 苯系物 | |||||
| 玉米 | 0.0 | 0.4 | ND | 北京 | 1992-2003 | 封闭-GC-FID | 王志辉等, |
| 0.58 | 0.03 | ND | 比利时 | 2012年5月-10月 | DEC-MS | Bachy et al., | |
| 0.001-0.002 | 0.003-0.002 | ND | 法国 | 2017年6月 | 动态-PDR-Qi-Tof-MS | Gomez et al., | |
| 7.10 | 0.25 | ND | 上海 | 2022年6月-8月 | 动态-TD-GC-MS | 肖志华, | |
| 156 | 9.49 | 125 | 内蒙古 | 2023年7月 | 动态-TD-GC-MS | 本研究 | |
| 水稻 | 0.7 | 15.8±9.2 | ND | 北京 | 1992-2003 | 封闭-GC-FID | 王志辉等, |
| ND | 0.4 | ND | 日本 | 2003年7月-8月 2004年7月-8月 | 动态-TD-GC-MS | (Bao et al., | |
| 0.78 | 0.93 | ND | 上海 | 2022年9月-12月 | 动态-TD-GC-MS | 肖志华, | |
| 3.66 | 4.05 | 3.41 | 内蒙古 | 2023年8月 | 动态-TD-GC-MS | 本研究 | |
| 马铃薯 | 16.9 | 39.6 | 14.1 | 内蒙古 | 2023年8月 | 动态-TD-GC-MS | 本研究 |
表2 内蒙古高原主要农作物BVOCs标准排放速率的比较
Table 2 Comparison of BVOC standard emissions from major crops in Inner Mongolia Plateau
| 植物 种类 | 排放速率/(µg∙g−1∙h−1) | 采样 地点 | 采样 时间 | 采样 技术 | 文献 来源 | ||
|---|---|---|---|---|---|---|---|
| 异戊二烯 | 单萜烯 | 苯系物 | |||||
| 玉米 | 0.0 | 0.4 | ND | 北京 | 1992-2003 | 封闭-GC-FID | 王志辉等, |
| 0.58 | 0.03 | ND | 比利时 | 2012年5月-10月 | DEC-MS | Bachy et al., | |
| 0.001-0.002 | 0.003-0.002 | ND | 法国 | 2017年6月 | 动态-PDR-Qi-Tof-MS | Gomez et al., | |
| 7.10 | 0.25 | ND | 上海 | 2022年6月-8月 | 动态-TD-GC-MS | 肖志华, | |
| 156 | 9.49 | 125 | 内蒙古 | 2023年7月 | 动态-TD-GC-MS | 本研究 | |
| 水稻 | 0.7 | 15.8±9.2 | ND | 北京 | 1992-2003 | 封闭-GC-FID | 王志辉等, |
| ND | 0.4 | ND | 日本 | 2003年7月-8月 2004年7月-8月 | 动态-TD-GC-MS | (Bao et al., | |
| 0.78 | 0.93 | ND | 上海 | 2022年9月-12月 | 动态-TD-GC-MS | 肖志华, | |
| 3.66 | 4.05 | 3.41 | 内蒙古 | 2023年8月 | 动态-TD-GC-MS | 本研究 | |
| 马铃薯 | 16.9 | 39.6 | 14.1 | 内蒙古 | 2023年8月 | 动态-TD-GC-MS | 本研究 |
| [1] | ABIS L, KALALIAN C, LUNARDELLI B, et al., 2021. Measurement report: biogenic volatile organic compound emission profiles of rapeseed leaf litter and its secondary organic aerosol formation potential[J]. Atmospheric Chemistry and Physics, 21(16): 12613-12629. |
| [2] | BAI J, BAKER B, LIANG B, et al., 2006. Isoprene and monoterpene emissions from an Inner Mongolia grassland[J]. Atmospheric Environment, 40(30): 5753-5758. |
| [3] |
BAO H, AKIRA K, AKIKAZU K, et al., 2008. Biogenic volatile organic compound emission potential of forests and paddy fields in the Kinki region of Japan[J]. Environmental Research, 106(2): 156-169.
PMID |
| [4] | BACHY A, AUBINET M, SCHOON N, et al., 2016. Are BVOC exchanges in agricultural ecosystems overestimated insights from fluxes measured in a maize field over a whole growingseason[J]. Atmospheric Chemistry and Physics Discussions, 16(8): 5343-5356. |
| [5] |
DA SILVA C M, CORRÊA S M, ARBILLA G, 2018. Isoprene emissions and ozone formation in urban conditions: A case study in the city of Rio de Janeiro[J]. Bulletin of Environmental Contamination and Toxicology, 100(1): 184-188.
DOI PMID |
| [6] | GUENTHER A B, ZIMMERMAN P R, HARlLEY P C, et al., 1993. Isoprene and monoterpene emission rate variability: Model evaluations and sensitivity analyses[J]. Journal of Geophysical Research: Atmospheres, 98(D7): 12609-12617. |
| [7] | GUENTHER A, HEWITT C N, ERICKSON D, et al., 1995. A global model of natural volatile organic compound emissions[J]. Journal of Geophysical Research: Atmospheres, 100(D5): 8873-8892. |
| [8] | GOMEZ L G, LOUBET B, LAFOUGE F, et al., 2019. Comparative study of biogenic volatile organic compounds fluxes by wheat, maize and rapeseed with dynamic chambers over a short period in northern France[J]. Atmospheric Environment, 214: 116855. |
| [9] |
GISELLE P S D, PINHEIRO D O D, SOARES V J B, et al., 2020. Biogenic volatile organic compounds emission of Brazilian Atlantic tree grown under elevated ozone in ambient controlled and field conditions[J]. Bulletin of Environmental Contamination and Toxicology, 105(6): 958-966.
DOI PMID |
| [10] | HUANG R X, ZHANG T N, GE X G, et al., 2023. Emission trade-off between isoprene and other BVOC components in pinus massoniana saplings may be regulated by content of chlorophylls, starch and NSCs under drought stress[J]. International Journal of Molecular Sciences, 24(10): 1-19. |
| [11] | KÖNIG G, BRUNDA M, PUXBAUM H, et al., 1995. Relative contribution of oxygenated hydrocarbons to the total biogenic VOC emissions of selected mid-European agricultural and natural plant species[J]. Atmospheric Environment, 29(8): 861-874. |
| [12] | MALIK T G, GAJBHIYE T, PANDEY S K, 2018. Plant specific emission pattern of biogenic volatile organic compounds (BVOCs) from common plant species of central India[J]. Environmental Monitoring and Assessment, 190(11): 1-11. |
| [13] | ZHANG S B, LYU Y Q, YANG X Y, et al., 2022. Modeling biogenic volatile organic compounds emissions and subsequent impacts on ozone air quality in the Sichuan basin, Southwestern China[J]. Frontiers in Ecology and Evolution, 10(1): 1-11. |
| [14] |
白建辉, 2021. 亚热带森林BVOCs排放和其影响因子之间的相互关系[J]. 生态环境学报, 30(5): 889-897.
DOI |
| BAI J H, 2021. The relationships between BVOC emission fluxes and their influencing factors in a subtropical Pinus forest[J]. Ecology and Environmental Sciences, 30(5): 889-897. | |
| [15] | 杜昌笛, 包海, 赵圆圆, 2019. 内蒙古沙漠化草原生物源挥发性有机物排放特征[J]. 中国环境科学, 39(5): 1854-1861. |
| DU C D, BAO H, ZHAO Y Y, 2019. The emission of biogenic volatile organic compounds from desert grassland in Inner Mongolia[J]. China Environmental Science, 39(5): 1854-1861. | |
| [16] | 高超, 张学磊, 修艾军, 等, 2019. 中国生物源挥发性有机物 (BVOCs) 时空排放特征研究[J]. 环境科学学报, 39(12): 4140-4151. |
| GAO C, ZHANG X L, XIU A J, et al., 2019. Spatiotemporal distribution of biogenic volatile organic compounds emissions in China[J]. Acta Scientiae Circumstantiae, 39(12): 4140-4151. | |
| [17] |
高星星, 包海, 丁艳旭, 2024. 夏季呼和浩特市生物源挥发性有机物排放速率空间分布[J] 生态环境学报, 33(12): 1902-1913.
DOI |
| GAO X X, BAO H, DING Y X, 2024. Spatial distribution of biogenic volatile organic compounds emission rate in Hohhot region during summer[J]. Ecology and Environmental Sciences, 33(12): 1902-1913. | |
| [18] | 花圣卓, 陈俊刚, 余新晓, 等, 2016. 温带典型森林树种的萜烯类化合物排放及其与环境要素的相关性[J]. 林业科学, 52(11): 19-28. |
| HUA S J, CHEN J G, YU X X, et al., 2016. Correlation between terpenes emission from typical forest tree species and environmental elements in temperate Zone[J]. Scientia Silvae Sinicae, 52(11): 19-28. | |
| [19] | 胡书婧, 张汝民, 2022. 挥发性有机化合物在植物适应胁迫及生理生态中的作用[J]. 浙江农林大学学报, 39(6): 1378-1387. |
| HU S J, ZHANG R M, 2022. Roles of volatile organic compounds in plant adaptation to stress andphysiological ecology[J]. Journal of Zhejiang A & F University, 39(6): 1378-1387. | |
| [20] | 李莹莹, 李想, 陈建民, 2011. 植物释放挥发性有机物 (BVOC) 向二次有机气溶胶 (SOA) 转化机制研究[J]. 环境科学, 32(12): 3588-3592. |
| LI Y Y, LI X, CHEN J M, 2011. Study on transformation mechanism of SOA from biogenic VOC under UV-B condition[J]. Environmental Sciences, 32(12): 3588-3592. | |
| [21] | 李玲玉, GUENTHEr A B, 顾达萨, 等, 2019. 典型树种挥发性有机物(VOCs) 排放成分谱及排放特征[J]. 中国环境科学, 39(12): 4966-4973. |
| LI L Y, GUENTHER A B, GU D S, et al., 2019. Biogenic emission profile of volatile organic compounds from poplar, sweetgum, and pine trees[J]. China Environmental Sciences, 39(12): 4966-4973. | |
| [22] | 李玲玉, ALEX B. GUENTHER, 顾达萨, 等, 2020. 短期干旱胁迫对马尾松排放挥发性有机物的影响[J]. 中国环境科学, 40(9): 3776-3780. |
| LI L Y, GUENTHER A B, GU D S, et al., 2020. Impact of short-term drought stress on volatile organic compounds emissions from Pinus massoniana[J]. China Environmental Sciences, 40(9): 3776-3780. | |
| [23] | 李达毅, 2021. 草原生态系统生物源挥发性有机物排放通量的环境影响因素研究[D]. 呼和浩特: 内蒙古师范大学. |
| LI D Y, 2021. Study on environmental influence factors of biogenic volatile organic compounds in grassland ecosystem[D]. Hohhot: Inner Mongolia Normal University. | |
| [24] |
李少宁, 陶雪莹, 李绣宏, 等, 2022. 植物释放有益挥发性有机物研究进展[J]. 生态环境学报, 31(1): 187-195.
DOI |
|
LI S N, TAO X Y, LI X H, et al., 2022. Research progress of beneficial biogenic volatile organic compounds released from plants[J]. Ecology and Environment Sciences, 31(1): 187-195.
DOI |
|
| [25] | 刘云凤, 龚道程, 林尤静, 等, 2022. 南岭箭竹生物源挥发性有机物排放特征[J]. 中国环境科学, 42(2): 568-574. |
| LIU Y F, GONG D C, LIN Y J, et al., 2022. Emissions of biogenic volatile organic compounds (BVOCs) from Fargesia nanlingensi in Nanling Mountains, southern China[J]. China Environmental Sciences, 42(2): 568-574. | |
| [26] | 刘智远, 包海, 杨娜, 等, 2022. 内蒙古河套灌区春小麦挥发性有机物排放特征[J]. 中国环境科学, 42(9): 4026-4032. |
| LIU Z Y, BAO H, YANG N, et al., 2022. Emissions of volatile organic compounds from spring wheat in Hetao irrigation district of Inner Mongolia[J]. China Environmental Sciences, 42(9): 4026-4032. | |
| [27] | 龙启超, 乔玉红, 姜涛, 等, 2023. 高温天气对生物源排放及其O3生成贡献的影响: 以四川盆地2022年7-8月为例[J]. 环境科学研究, 36(12): 2331-2343. |
| LONG Q C, QIAO Y H, JIANG T, et al., 2023. Effects of high temperature on biogenic emissions and O3 generation: A case study of sichuan basin from July to August[J]. Research of Environmental Sciences, 36(12): 2331-2343. | |
| [28] | 李晨, 张芝娟, 陈曦, 等, 2024. 基于WRF-CMAQ的晋城市PM2.5与O3复合污染协同控制[J]. 中国环境科学, 44(12): 6569-6577. |
| LI C, ZHANG Z J, CHEN X, et al., 2024. Coordinated control of PM2.5 and O3 compound pollution in Jincheng city based on the WRF-CMAQ model[J]. China Environmental Sciences, 44(12): 6569-6577. | |
| [29] |
欧阳嗣航, 刘叶凡, 韩阳媚, 等, 2023. 植物挥发物释放特征及其影响因素研究进展[J]. 林业与生态科学, 38(3): 375-384.
DOI |
|
OUYANG S H, LIU Y F, HAN Y M, et al., 2023. Research progress on the release characteristics of biogenic volatile organic compounds and its influencing factors[J]. Forestry and Ecological Sciences, 38(3): 375-384.
DOI |
|
| [30] | 王志辉, 张树宇, 陆思华, 等, 2003. 北京地区植物VOCs排放速率的测定[J]. 环境科学, 24(2): 7-12. |
| WANG Z H, ZHANG S Y, LU S H, et al., 2003. Screenings of plant species in Beijing for volatile organic compound emissions[J]. Environmental Sciences, 24(2): 7-12. | |
| [31] | 王新雨, 张宜升, 刘子杨, 等, 2020. 植被源异戊二烯排放影响的研究进展[J]. 青岛理工大学学报, 41(4): 55-63. |
| WANG X Y, ZHANG Y S, LIU Z Y, et al., 2020. A review of effects of global warming on biogenic isoprene emission[J]. Journal of Qingdao University of Technology, 41(4): 55-63. | |
| [32] |
王剑, 包海, 李达毅, 等, 2021. 干旱半干旱区夏季绿化树种挥发性有机物标准排放量的测定[J]. 生态环境学报, 30(6): 1168-1176.
DOI |
|
WANG J, BAO H, LI D Y, et al., 2021. Emissions of volatile organic compounds from landscape trees in arid and semi-arid region during summer[J]. Ecology and Environment Sciences, 30(6): 1168-1176.
DOI |
|
| [33] |
武开阔, 张哲, 武志杰, 等, 2022. 不同秸秆还田量和氮肥配施对玉米田土壤CO2排放的影响[J]. 应用生态学报, 33(3): 664-670.
DOI |
| WU K K, ZHANG Z, WU Z J, et al., 2022. Effects of different amounts of straw return and nitrogen fertilizer application on soil CO2 emission from maize fields[J]. Journal of Applied Ecology, 33(3): 664-670. | |
| [34] | 王楚迪, 节龙飞, 李苗苗, 等, 2022. 我国夏季不同类型植被BVOCs排放观测与模拟研究[J]. 环境科学研究, 35(6): 1341-1350. |
| WANG C D, JIE L F, LI M M, et al., 2022. Observation and simulation of BVOCs emission from different vegetation types in summer in China[J]. Research of Environmental Sciences, 35(6): 1341-1350. | |
| [35] |
温丽容, 江明, 黄渤, 等, 2023. 珠三角典型区域臭氧成因分析与 VOCs 来源解析——以中山为例[J]. 生态环境学报, 32(3): 500-513.
DOI |
| WEN L R, JIANG M, HUANG B, et al., 2023. Analysis of ozone pollution causes and source analysis of VOCs in typical areas of Pearl River Delta: A case study of Zhongshan city[J]. Ecology and Environmental Sciences, 32(3): 500-513. | |
| [36] | 谢军飞, 李延明, 2013. 植物源挥发性有机化合物排放清单的研究进展[J]. 环境科学, 34(12): 4779-4786. |
| XIE J F, LI Y M, 2013. Research advances on volatile organic compounds emission inventory of plants[J]. Environmental Science, 34(12): 4779-4786. | |
| [37] | 许燕, 李双江, 袁相洋, 等, 2020. 北方常见绿化树种BVOCs排放特征及其与光合作用参数的相关性[J]. 环境科学, 41(8): 3518-3526. |
| XU Y, LI S J, YUAN X Y, et al., 2020. Emission characteristics of biogenic volatile compounds (BVOCs) from common greening tree species in northern China and their correlations withphotosynthetic parameters[J]. Environmental Sciences, 41(8): 3518-3526. | |
| [38] | 肖志华, 2023. 上海市主要农业及天然源植被BVOCs排放特征研究[D]. 上海: 华东理工大学. |
| XIAO Z H, 2023. Study on emission characteristics of BVOCs from major agricultural and natural source vegetation in Shanghai[D]. Shanghai: East China University of Science and Technology. | |
| [39] | 虞小芳, 程鹏, 古颖纲, 2018. 广州市夏季VOCs对臭氧及SOA生成潜势的研究[J]. 中国环境科学, 38(3): 830-837. |
| YU X F, CHENG P, GU Y G, 2018. Formation potential of ozone and secondary organic aerosol from VOCs oxidation in summer in Guangzhou[J]. China Environmental Sciences, 38(3): 830-837. | |
| [40] | 袁相洋, 许燕, 杜英东, 2022. 南京和北京城市天然源挥发性有机物排放差异[J]. 中国环境科学, 42(4): 1489-1500. |
| YUAN X Y, XU Y, DU Y D, 2022. Differences of biogenic volatile organic compound emissions from urban forests in Nanjing and Beijing[J]. China Environmental Sciences, 42(4): 1489-1500. | |
| [41] | 赵圆圆, 包海, 李达毅, 等, 2020. 锡林郭勒草原不同植物生物源挥发性有机物排放通量[J]. 内蒙古师范大学学报(自然科学汉文版), 49(3): 236-244. |
| ZHAO Y Y, BAO H, LI D Y, et al., 2020. Biogenic volatile organic compounds emission fluxes from the different plantsin Xilingol Grassland[J]. Journal of Inner Mongolia Normal University (Natural Science Edition), 49(3): 236-244. | |
| [42] | 张明明, 邵旻, 陈培林, 等, 2023. 长三角地区VOCs排放特征及其对大气O3和SOA的潜在影响[J]. 中国环境科学, 43(6): 2694-2702. |
| ZHANG M M, SHAO M, CHEN P L, et al., 2023. Comparative study of anthropogenic and biogenic VOCs emission characteristics and their impact on O3 and SOA formation potential in the Yangtze River Delta region[J]. China Environmental Sciences, 43(6): 2694-2702. | |
| [43] | 赵路佳, 李春林, 胡远满, 等, 2023. 城市植物源挥发性有机化合物排放特征及其大气环境效应研究进展[J]. 生态学报, 43(24): 10023-10031. |
| ZHAO L J, LI C L, HU Y M, et al., 2023. Research progress on the emission characteristics of volatile organic compounds from urban plants and their atmospheric effects[J]. Acta Ecologica Sinica, 43(24): 10023-10031. |
| [1] | 高星星, 包海, 丁艳旭. 夏季呼和浩特市生物源挥发性有机物排放速率空间分布[J]. 生态环境学报, 2024, 33(12): 1902-1913. |
| [2] | 陈碧珊, 郑康慧, 王璟, 叶林海, 宋军霞. 雷州半岛土壤-农作物汞元素含量特征与健康风险分析[J]. 生态环境学报, 2022, 31(3): 572-582. |
| [3] | 陈赋秋雪, 唐思琪, 袁昊, 马子轩, 陈坦, 杨婷, 张冰, 刘颖. 聚苯乙烯微塑料对典型农作物种子发芽和幼苗生长的影响[J]. 生态环境学报, 2022, 31(12): 2382-2392. |
| 阅读次数 | ||||||
|
全文 |
|
|||||
|
摘要 |
|
|||||