生态环境学报 ›› 2025, Vol. 34 ›› Issue (4): 608-620.DOI: 10.16258/j.cnki.1674-5906.2025.04.010
崔雪丹1( ), 段桂兰1, 王向琴2, 李志丰2, 窦飞2, 杜衍红2, 袁雨珍2, 刘传平2, 李芳柏2,*()
收稿日期:2025-01-24
出版日期:2025-04-18
发布日期:2025-04-24
通讯作者:
*李芳柏。E-mail: cefbli@soil.gd.cn作者简介:崔雪丹(1998年生),女,博士研究生,研究方向为植物-微生物-重金属相互作用机制探究。E-mail:ax1655680772@163.com
基金资助:
CUI Xuedan1(), DUAN Guilan1, WANG Xiangqin2, LI Zhifeng2, DOU Fei2, DU Yanhong2, YUAN Yuzhen2, LIU Chuanping2, LI Fangbai2,*()
Received:2025-01-24
Online:2025-04-18
Published:2025-04-24
摘要: 农用地重金属污染修复的研究多关注农产品达标率和土壤重金属有效态下降的比例,而对于修复材料影响土壤健康则较少关注。在韶关、惠州两地中轻度镉砷复合污染稻田开展了为期3年6季的定位试验,在每年早稻、晚稻种植前,分别向试验小区施加还原铁粉、木本泥炭和铁改性木本泥炭,研究镉砷同步钝化效果,同时,对测定的所有土壤健康指标按照理化性质(pH、OM、CEC)、重金属含量(稻米Cd、稻米As、土壤有效态Cd、土壤有效态As)及稻米产量进行分组并构建评分函数,评价铁改性木本泥炭对土壤健康的效应。结果表明,与对照相比,施加铁改性木本泥炭可显著降低稻米镉、砷含量,下降率可分别达到47.8%和61.2%;可显著降低土壤有效态Cd、As含量,下降率可分别达到60.4%和69.8%;可显著提高稻米产量,增产率可达17%。同时,施加铁改性木本泥炭提升了土壤pH值、有机碳含量和阳离子交换量(CEC值),3年间,韶关、惠州试验地土壤pH分别平均提升0.35、0.37个单位,有机质分别平均提升0.50、2.02 g·kg−1,CEC值平均提高1.27、1.49 cmol·kg−1,显著地提升了土壤质量。土壤健康指数评价表明,施加铁改性木本泥炭极大地提高了总体健康指数,土壤健康状况达到高等水平以上。尽管惠州试验地的土壤健康指数高于韶关,但铁改性木本泥炭对韶关试验地土壤健康指数的提升更显著,这可能与韶关试验地土壤健康质量指数本底值较低有关。研究结果为铁改性木本泥炭在土壤修复中的长期应用提供了科学依据。
中图分类号:
崔雪丹, 段桂兰, 王向琴, 李志丰, 窦飞, 杜衍红, 袁雨珍, 刘传平, 李芳柏. 基于两地长期定位试验的铁改性木本泥炭修复中轻度镉砷污染稻田效果与土壤健康效应评价[J]. 生态环境学报, 2025, 34(4): 608-620.
CUI Xuedan, DUAN Guilan, WANG Xiangqin, LI Zhifeng, DOU Fei, DU Yanhong, YUAN Yuzhen, LIU Chuanping, LI Fangbai. Evaluation of the Effects and Soil Health Impacts of Iron-Modified Woody Peat in the Remediation of Moderately Cadmium and Arsenic Contaminated Paddy Fields Based on Multi-Site Long-Term Positioning Experiments[J]. Ecology and Environment, 2025, 34(4): 608-620.
| 研究区域 | 有机质质量 分数/ (g·kg−1) | 总氮质量分数/ (g·kg−1) | 有效磷质量 分数/ (mg·kg−1) | 有效钾质量 分数/ (mg·kg−1) | CEC/ (cmol·kg−1) | pH | 总Cd质量 分数/ (mg·kg−1) | 总As质量 分数/ (mg·kg−1) | 有效态Cd质量 分数/ (mg·kg−1) | 有效态As质量 分数/ (mg·kg−1) |
|---|---|---|---|---|---|---|---|---|---|---|
| 韶关 | 15.3 | 1.52 | 34.5 | 79.0 | 10.5 | 6.93 | 3.07 | 90.1 | 1.26 | 13.3 |
| 惠州 | 20.2 | 1.33 | 77.4 | 59.8 | 9.89 | 5.2 | 0.35 | 49.3 | 0.15 | 8.05 |
表1 供试土壤的理化性质
Table 1 Physicochemical properties of the tested soil
| 研究区域 | 有机质质量 分数/ (g·kg−1) | 总氮质量分数/ (g·kg−1) | 有效磷质量 分数/ (mg·kg−1) | 有效钾质量 分数/ (mg·kg−1) | CEC/ (cmol·kg−1) | pH | 总Cd质量 分数/ (mg·kg−1) | 总As质量 分数/ (mg·kg−1) | 有效态Cd质量 分数/ (mg·kg−1) | 有效态As质量 分数/ (mg·kg−1) |
|---|---|---|---|---|---|---|---|---|---|---|
| 韶关 | 15.3 | 1.52 | 34.5 | 79.0 | 10.5 | 6.93 | 3.07 | 90.1 | 1.26 | 13.3 |
| 惠州 | 20.2 | 1.33 | 77.4 | 59.8 | 9.89 | 5.2 | 0.35 | 49.3 | 0.15 | 8.05 |
| 处理 | 韶关地块 | 惠州地块 | ||||
|---|---|---|---|---|---|---|
| Cd | As | Cd | As | |||
| CK | 平行1 | 2.98±0.32 | 88.5±1.78 | 0.35±0.02 | 49.3±3.21 | |
| 平行2 | 3.07±0.26 | 90.1±2.69 | 0.38±0.03 | 48.9±2.56 | ||
| 平行3 | 2.96±0.12 | 89.3±0.45 | 0.37±0.05 | 49.6±3.39 | ||
| C | 平行1 | 2.93±0.28 | 87.2±2.32 | 0.36±0.01 | 50.1±2.47 | |
| 平行2 | 2.87±0.19 | 88.9±1.48 | 0.35±0.02 | 49.7±3.52 | ||
| 平行3 | 2.99±0.27 | 88.5±1.32 | 0.34±0.02 | 48.6±2.94 | ||
| Fe | 平行1 | 2.79±0.33 | 89.1±2.26 | 0.37±0.04 | 48.6±4.05 | |
| 平行2 | 2.82±0.10 | 87.7±1.54 | 0.33±0.03 | 47.8±3.33 | ||
| 平行3 | 2.94±0.22 | 89.3±3.51 | 0.35±0.02 | 49.2±2.67 | ||
| Fe-C | 平行1 | 2.78±0.35 | 88.2±2.94 | 0.35±0.02 | 51.7±2.48 | |
| 平行2 | 2.93±0.13 | 88.4±1.67 | 0.36±0.01 | 50.7±3.77 | ||
| 平行3 | 3.11±0.08 | 89.3±2.08 | 0.36±0.02 | 48.6±4.14 | ||
表2 韶关、惠州试验地各小区土壤Cd、As本底值
Table 2 Background values of cadmium and arsenic in soil of each experimental plot in Shaoguan and Huizhou mg·kg?1
| 处理 | 韶关地块 | 惠州地块 | ||||
|---|---|---|---|---|---|---|
| Cd | As | Cd | As | |||
| CK | 平行1 | 2.98±0.32 | 88.5±1.78 | 0.35±0.02 | 49.3±3.21 | |
| 平行2 | 3.07±0.26 | 90.1±2.69 | 0.38±0.03 | 48.9±2.56 | ||
| 平行3 | 2.96±0.12 | 89.3±0.45 | 0.37±0.05 | 49.6±3.39 | ||
| C | 平行1 | 2.93±0.28 | 87.2±2.32 | 0.36±0.01 | 50.1±2.47 | |
| 平行2 | 2.87±0.19 | 88.9±1.48 | 0.35±0.02 | 49.7±3.52 | ||
| 平行3 | 2.99±0.27 | 88.5±1.32 | 0.34±0.02 | 48.6±2.94 | ||
| Fe | 平行1 | 2.79±0.33 | 89.1±2.26 | 0.37±0.04 | 48.6±4.05 | |
| 平行2 | 2.82±0.10 | 87.7±1.54 | 0.33±0.03 | 47.8±3.33 | ||
| 平行3 | 2.94±0.22 | 89.3±3.51 | 0.35±0.02 | 49.2±2.67 | ||
| Fe-C | 平行1 | 2.78±0.35 | 88.2±2.94 | 0.35±0.02 | 51.7±2.48 | |
| 平行2 | 2.93±0.13 | 88.4±1.67 | 0.36±0.01 | 50.7±3.77 | ||
| 平行3 | 3.11±0.08 | 89.3±2.08 | 0.36±0.02 | 48.6±4.14 | ||
| 理化指标 | 区域 | 不同处理 | 2016年早造 | 2016年晚造 | 2017年早造 | 2017年晚造 | 2018年早造 | 2018年晚造 | 均值1 | 均值2 | 变异系数 |
|---|---|---|---|---|---|---|---|---|---|---|---|
| pH | 韶关 | CK | 7.34±0.04c | 7.23±0.03c | 7.26±0.04a | 7.36±0.04c | 7.33±0.04b | 7.36±0.06c | 7.31 | 7.33 | 4.69 |
| C | 6.94±0.03d | 6.98±0.04d | 6.81±0.04d | 6.72±0.05d | 6.77±0.12c | 6.59±0.07d | 6.80 | ||||
| Fe | 7.53±0.04b | 7.51±0.04b | 7.40±0.06b | 7.51±0.04b | 7.62±0.04a | 7.56±0.05b | 7.52 | ||||
| Fe-C | 7.67±0.02a | 7.64±0.03a | 7.66±0.10a | 7.64±0.02a | 7.67±0.06a | 7.70±0.03a | 7.66 | ||||
| 惠州 | CK | 5.28±0.05c | 5.26±0.03c | 5.27±0.05c | 5.29±0.03a | 5.32±0.04c | 5.29±0.05c | 5.29 | 5.32 | 6.20 | |
| C | 4.95±0.01d | 4.94±0.02d | 4.93±0.04d | 4.82±0.06c | 4.76±0.10d | 4.58±0.08d | 4.83 | ||||
| Fe | 5.51±0.07b | 5.48±0.05b | 5.44±0.06b | 5.55±0.04b | 5.49±0.08b | 5.60±0.07b | 5.51 | ||||
| Fe-C | 5.72±0.05a | 5.61±0.07a | 5.60±0.06a | 5.65±0.02a | 5.66±0.06a | 5.73±0.05a | 5.66 | ||||
| OM质量分数/ (g·kg−1) | 韶关 | CK | 16.2±0.8b | 16.0±0.7b | 15.7±0.2b | 15.4±2.0b | 15.2±0.0b | 14.4±0.5b | 15.5 | 15.65 | 4.39 |
| C | 16.7±0.7a | 16.4±0.1a | 16.1±0.5ab | 15.6±1.3a | 15.3±0.1a | 14.7±0.8a | 15.8 | ||||
| Fe | 16.2±0.6b | 16.0±0.3b | 15.7±0.3b | 15.3±1.1b | 14.7±0.4b | 14.4±1.0b | 15.4 | ||||
| Fe-C | 16.7±0.3a | 16.5±0.3a | 16.2±0.1a | 15.9±1.9a | 15.5±0.3a | 15.0±0.3a | 16.0 | ||||
| 惠州 | CK | 19.6±0.7b | 20.3±0.9b | 20.3±0.3b | 20.2±1.2b | 19.9±1.4b | 19.5±0.7b | 20.0 | 20.90 | 6.02 | |
| C | 20.3±1.0a | 21.2±0.6a | 21.2±0.2a | 22.7±1.1a | 20.4±0.2ab | 23.0±2.7ab | 21.5 | ||||
| Fe | 19.7±1.3b | 20.6±2.4b | 20.3±1.1b | 20.8±0.9b | 20.2±1.3ab | 19.7±0.4b | 20.2 | ||||
| Fe-C | 20.4±0.5a | 22.2±1.2a | 21.3±1.0a | 23.7±3.1a | 20.5±0.2a | 23.8±1.8a | 22.0 | ||||
| CEC/ (cmol·kg−1) | 韶关 | CK | 10.7±0.3b | 10.4±0.5b | 10.4±0.2b | 10.5±0.0b | 10.5±0.3b | 10.5±0.3b | 10.5 | 11.1 | 10.4 |
| C | 10.8±0.3a | 11.2±0.6a | 11.3±0.4a | 12.9±0.9a | 12.7±0.3a | 12.7±1.0a | 11.9 | ||||
| Fe | 10.7±0.3b | 10.9±0.2ab | 7.43±5.26b | 10.7±0.5b | 10.8±0.2b | 10.3±0.4b | 10.1 | ||||
| Fe-C | 10.8±0.3a | 11.2±0.7a | 11.6±0.6a | 12.1±0.5a | 12.8±0.3a | 12.2±0.9a | 11.8 | ||||
| 惠州 | CK | 10.0±0.7b | 10.6±1.0b | 10.3±1.4b | 10.6±0.7b | 9.83±0.67b | 9.81±0.53b | 10.2 | 10.87 | 7.90 | |
| C | 10.4±1.1a | 10.8±1.4a | 11.1±1.8ab | 11.9±1.8a | 11.7±1.5a | 12.2±0.6a | 11.34 | ||||
| Fe | 9.78±0.90b | 10.6±1.3b | 10.4±0.6b | 10.6±1.2b | 9.98±0.65b | 10.3±0.5b | 10.28 | ||||
| Fe-C | 10.8±0.8a | 10.7±0.9a | 12.2±1.3a | 11.6±1.1a | 12.4±3.0a | 12.3±1.7a | 11.67 |
表3 不同栽培年度韶关和惠州试验地稻田土壤理化指标的描述性统计
Table 3 Descriptive statistics of physicochemical properties of paddy soil from Shaoguan and Huizhou experimental sites in different cultivation seasons
| 理化指标 | 区域 | 不同处理 | 2016年早造 | 2016年晚造 | 2017年早造 | 2017年晚造 | 2018年早造 | 2018年晚造 | 均值1 | 均值2 | 变异系数 |
|---|---|---|---|---|---|---|---|---|---|---|---|
| pH | 韶关 | CK | 7.34±0.04c | 7.23±0.03c | 7.26±0.04a | 7.36±0.04c | 7.33±0.04b | 7.36±0.06c | 7.31 | 7.33 | 4.69 |
| C | 6.94±0.03d | 6.98±0.04d | 6.81±0.04d | 6.72±0.05d | 6.77±0.12c | 6.59±0.07d | 6.80 | ||||
| Fe | 7.53±0.04b | 7.51±0.04b | 7.40±0.06b | 7.51±0.04b | 7.62±0.04a | 7.56±0.05b | 7.52 | ||||
| Fe-C | 7.67±0.02a | 7.64±0.03a | 7.66±0.10a | 7.64±0.02a | 7.67±0.06a | 7.70±0.03a | 7.66 | ||||
| 惠州 | CK | 5.28±0.05c | 5.26±0.03c | 5.27±0.05c | 5.29±0.03a | 5.32±0.04c | 5.29±0.05c | 5.29 | 5.32 | 6.20 | |
| C | 4.95±0.01d | 4.94±0.02d | 4.93±0.04d | 4.82±0.06c | 4.76±0.10d | 4.58±0.08d | 4.83 | ||||
| Fe | 5.51±0.07b | 5.48±0.05b | 5.44±0.06b | 5.55±0.04b | 5.49±0.08b | 5.60±0.07b | 5.51 | ||||
| Fe-C | 5.72±0.05a | 5.61±0.07a | 5.60±0.06a | 5.65±0.02a | 5.66±0.06a | 5.73±0.05a | 5.66 | ||||
| OM质量分数/ (g·kg−1) | 韶关 | CK | 16.2±0.8b | 16.0±0.7b | 15.7±0.2b | 15.4±2.0b | 15.2±0.0b | 14.4±0.5b | 15.5 | 15.65 | 4.39 |
| C | 16.7±0.7a | 16.4±0.1a | 16.1±0.5ab | 15.6±1.3a | 15.3±0.1a | 14.7±0.8a | 15.8 | ||||
| Fe | 16.2±0.6b | 16.0±0.3b | 15.7±0.3b | 15.3±1.1b | 14.7±0.4b | 14.4±1.0b | 15.4 | ||||
| Fe-C | 16.7±0.3a | 16.5±0.3a | 16.2±0.1a | 15.9±1.9a | 15.5±0.3a | 15.0±0.3a | 16.0 | ||||
| 惠州 | CK | 19.6±0.7b | 20.3±0.9b | 20.3±0.3b | 20.2±1.2b | 19.9±1.4b | 19.5±0.7b | 20.0 | 20.90 | 6.02 | |
| C | 20.3±1.0a | 21.2±0.6a | 21.2±0.2a | 22.7±1.1a | 20.4±0.2ab | 23.0±2.7ab | 21.5 | ||||
| Fe | 19.7±1.3b | 20.6±2.4b | 20.3±1.1b | 20.8±0.9b | 20.2±1.3ab | 19.7±0.4b | 20.2 | ||||
| Fe-C | 20.4±0.5a | 22.2±1.2a | 21.3±1.0a | 23.7±3.1a | 20.5±0.2a | 23.8±1.8a | 22.0 | ||||
| CEC/ (cmol·kg−1) | 韶关 | CK | 10.7±0.3b | 10.4±0.5b | 10.4±0.2b | 10.5±0.0b | 10.5±0.3b | 10.5±0.3b | 10.5 | 11.1 | 10.4 |
| C | 10.8±0.3a | 11.2±0.6a | 11.3±0.4a | 12.9±0.9a | 12.7±0.3a | 12.7±1.0a | 11.9 | ||||
| Fe | 10.7±0.3b | 10.9±0.2ab | 7.43±5.26b | 10.7±0.5b | 10.8±0.2b | 10.3±0.4b | 10.1 | ||||
| Fe-C | 10.8±0.3a | 11.2±0.7a | 11.6±0.6a | 12.1±0.5a | 12.8±0.3a | 12.2±0.9a | 11.8 | ||||
| 惠州 | CK | 10.0±0.7b | 10.6±1.0b | 10.3±1.4b | 10.6±0.7b | 9.83±0.67b | 9.81±0.53b | 10.2 | 10.87 | 7.90 | |
| C | 10.4±1.1a | 10.8±1.4a | 11.1±1.8ab | 11.9±1.8a | 11.7±1.5a | 12.2±0.6a | 11.34 | ||||
| Fe | 9.78±0.90b | 10.6±1.3b | 10.4±0.6b | 10.6±1.2b | 9.98±0.65b | 10.3±0.5b | 10.28 | ||||
| Fe-C | 10.8±0.8a | 10.7±0.9a | 12.2±1.3a | 11.6±1.1a | 12.4±3.0a | 12.3±1.7a | 11.67 |
| 重金属含量 | 区域 | 不同处理 | 2016年早造 | 2016年晚造 | 2017年早造 | 2017年晚造 | 2018年早造 | 2018年晚造 | 均值1 | 均值2 | 变异系数 |
|---|---|---|---|---|---|---|---|---|---|---|---|
| 土壤有效态Cd质量分数/ (mg·kg−1) | 韶关 | CK | 1.06±0.15a | 1.48±0.16a | 1.29±0.09a | 1.64±0.08a | 1.00±0.04a | 1.16±0.07a | 1.27 | 1.04 | 30.2 |
| C | 0.94±0.10a | 1.35±0.14a | 0.96±0.09b | 1.23±0.08c | 0.99±0.13a | 0.83±0.04b | 1.05 | ||||
| Fe | 1.02±0.07a | 1.43±0.20a | 1.01±0.06b | 1.38±0.06b | 0.96±0.10a | 1.11±0.05a | 1.15 | ||||
| Fe-C | 0.42±0.07b | 0.94±0.11b | 0.53±0.01c | 1.07±0.04c | 0.40±0.02b | 0.74±0.04b | 0.68 | ||||
| 惠州 | CK | 0.15±0.00a | 0.17±0.01a | 0.16±0.01a | 0.17±0.00a | 0.17±0.01a | 0.18±0.01a | 0.17 | 0.14 | 19.3 | |
| C | 0.13±0.00b | 0.14±0.00b | 0.11±0.01c | 0.14±0.02b | 0.17±0.01a | 0.15±0.01b | 0.14 | ||||
| Fe | 0.12±0.01b | 0.13±0.01bc | 0.13±0.00b | 0.13±0.01b | 0.13±0.00b | 0.14±0.01bc | 0.13 | ||||
| Fe-C | 0.08±0.00c | 0.12±0.00b | 0.09±0.00d | 0.12±0.00b | 0.10±0.01c | 0.13±0.01c | 0.11 | ||||
| 土壤有效态As质量分数/ (mg·kg−1) | 韶关 | CK | 12.9±0.7a | 11.2±1.0a | 14.3±0.4a | 13.0±0.4a | 12.5±0.7a | 12.2±0.9a | 12.7 | 10.1 | 31.6 |
| C | 13.0±0.8a | 12.0±1.0a | 12.8±1.1b | 12.0±0.3b | 12.9±0.7a | 12.9±0.1a | 12.6 | ||||
| Fe | 9.93±0.65b | 8.65±0.28b | 9.81±0.62c | 9.20±0.45c | 9.44±0.45b | 8.72±0.58b | 9.29 | ||||
| Fe-C | 7.17±0.18c | 3.39±0.34c | 8.12±0.26d | 4.04±0.04d | 7.23±0.17c | 3.75±0.38c | 5.62 | ||||
| 惠州 | CK | 8.33±0.20b | 7.59±0.49b | 7.31±0.07b | 6.40±0.15b | 8.71±0.93a | 8.12±0.16b | 7.74 | 6.63 | 32.8 | |
| C | 10.1±0.70a | 9.45±0.84a | 8.22±0.48a | 9.05±0.32a | 9.39±0.52a | 9.23±0.16a | 9.24 | ||||
| Fe | 5.94±0.09c | 5.13±0.88c | 6.26±0.37c | 5.11±0.43c | 5.98±0.53b | 5.23±0.41c | 5.61 | ||||
| Fe-C | 4.79±0.15d | 3.32±0.04d | 4.02±0.11d | 2.87±0.07d | 4.87±0.13c | 3.64±0.25d | 3.92 |
表4 不同栽培年限韶关和惠州试验地稻田土壤有效态镉、砷含量的描述性统计
Table 4 Descriptive statistics of cadmium and arsenic contents in paddy soil from Shaoguan and Huizhou experimental sites with different cultivation durations
| 重金属含量 | 区域 | 不同处理 | 2016年早造 | 2016年晚造 | 2017年早造 | 2017年晚造 | 2018年早造 | 2018年晚造 | 均值1 | 均值2 | 变异系数 |
|---|---|---|---|---|---|---|---|---|---|---|---|
| 土壤有效态Cd质量分数/ (mg·kg−1) | 韶关 | CK | 1.06±0.15a | 1.48±0.16a | 1.29±0.09a | 1.64±0.08a | 1.00±0.04a | 1.16±0.07a | 1.27 | 1.04 | 30.2 |
| C | 0.94±0.10a | 1.35±0.14a | 0.96±0.09b | 1.23±0.08c | 0.99±0.13a | 0.83±0.04b | 1.05 | ||||
| Fe | 1.02±0.07a | 1.43±0.20a | 1.01±0.06b | 1.38±0.06b | 0.96±0.10a | 1.11±0.05a | 1.15 | ||||
| Fe-C | 0.42±0.07b | 0.94±0.11b | 0.53±0.01c | 1.07±0.04c | 0.40±0.02b | 0.74±0.04b | 0.68 | ||||
| 惠州 | CK | 0.15±0.00a | 0.17±0.01a | 0.16±0.01a | 0.17±0.00a | 0.17±0.01a | 0.18±0.01a | 0.17 | 0.14 | 19.3 | |
| C | 0.13±0.00b | 0.14±0.00b | 0.11±0.01c | 0.14±0.02b | 0.17±0.01a | 0.15±0.01b | 0.14 | ||||
| Fe | 0.12±0.01b | 0.13±0.01bc | 0.13±0.00b | 0.13±0.01b | 0.13±0.00b | 0.14±0.01bc | 0.13 | ||||
| Fe-C | 0.08±0.00c | 0.12±0.00b | 0.09±0.00d | 0.12±0.00b | 0.10±0.01c | 0.13±0.01c | 0.11 | ||||
| 土壤有效态As质量分数/ (mg·kg−1) | 韶关 | CK | 12.9±0.7a | 11.2±1.0a | 14.3±0.4a | 13.0±0.4a | 12.5±0.7a | 12.2±0.9a | 12.7 | 10.1 | 31.6 |
| C | 13.0±0.8a | 12.0±1.0a | 12.8±1.1b | 12.0±0.3b | 12.9±0.7a | 12.9±0.1a | 12.6 | ||||
| Fe | 9.93±0.65b | 8.65±0.28b | 9.81±0.62c | 9.20±0.45c | 9.44±0.45b | 8.72±0.58b | 9.29 | ||||
| Fe-C | 7.17±0.18c | 3.39±0.34c | 8.12±0.26d | 4.04±0.04d | 7.23±0.17c | 3.75±0.38c | 5.62 | ||||
| 惠州 | CK | 8.33±0.20b | 7.59±0.49b | 7.31±0.07b | 6.40±0.15b | 8.71±0.93a | 8.12±0.16b | 7.74 | 6.63 | 32.8 | |
| C | 10.1±0.70a | 9.45±0.84a | 8.22±0.48a | 9.05±0.32a | 9.39±0.52a | 9.23±0.16a | 9.24 | ||||
| Fe | 5.94±0.09c | 5.13±0.88c | 6.26±0.37c | 5.11±0.43c | 5.98±0.53b | 5.23±0.41c | 5.61 | ||||
| Fe-C | 4.79±0.15d | 3.32±0.04d | 4.02±0.11d | 2.87±0.07d | 4.87±0.13c | 3.64±0.25d | 3.92 |
| 区域 | 年份 | 类型 | 年内差异 | 年内差异 | |||||
|---|---|---|---|---|---|---|---|---|---|
| Cd降幅/ % | LSD0.05 | LSD0.01 | As降幅/ % | LSD0.05 | LSD0.01 | ||||
| 韶关 | 2016年 | 早稻 | 60.6±3.55 | b | B | 44.1±1.94 | b | B | |
| 晚稻 | 36.4±1.06 | a | A | 69.8±0.59 | a | A | |||
| 2017年 | 早稻 | 58.4±3.63 | b | B | 43.1±0.36 | b | B | ||
| 晚稻 | 34.7±1.46 | a | A | 68.9±0.68 | a | A | |||
| 2018年 | 早稻 | 60.3±1.08 | b | B | 42.0±1.88 | b | B | ||
| 晚稻 | 35.7±0.83 | a | A | 69.0±5.16 | a | A | |||
| 惠州 | 2016年 | 早稻 | 43.6±2.67 | b | B | 42.5±3.11 | b | B | |
| 晚稻 | 28.5±1.99 | a | A | 56.1±2.91 | a | A | |||
| 2017年 | 早稻 | 40.5±1.72 | b | B | 45.1±0.93 | b | B | ||
| 晚稻 | 28.7±0.65 | a | A | 55.1±0.39 | a | A | |||
| 2018年 | 早稻 | 40.7±1.34 | b | B | 43.7±5.34 | b | B | ||
| 晚稻 | 29.8±1.21 | a | A | 55.2±2.23 | a | A | |||
表5 相比对照,施加铁改性木本泥炭处理中有效态Cd、As的降幅
Table 5 The reduction of available Cd and As in the treatment of iron modified woody peat
| 区域 | 年份 | 类型 | 年内差异 | 年内差异 | |||||
|---|---|---|---|---|---|---|---|---|---|
| Cd降幅/ % | LSD0.05 | LSD0.01 | As降幅/ % | LSD0.05 | LSD0.01 | ||||
| 韶关 | 2016年 | 早稻 | 60.6±3.55 | b | B | 44.1±1.94 | b | B | |
| 晚稻 | 36.4±1.06 | a | A | 69.8±0.59 | a | A | |||
| 2017年 | 早稻 | 58.4±3.63 | b | B | 43.1±0.36 | b | B | ||
| 晚稻 | 34.7±1.46 | a | A | 68.9±0.68 | a | A | |||
| 2018年 | 早稻 | 60.3±1.08 | b | B | 42.0±1.88 | b | B | ||
| 晚稻 | 35.7±0.83 | a | A | 69.0±5.16 | a | A | |||
| 惠州 | 2016年 | 早稻 | 43.6±2.67 | b | B | 42.5±3.11 | b | B | |
| 晚稻 | 28.5±1.99 | a | A | 56.1±2.91 | a | A | |||
| 2017年 | 早稻 | 40.5±1.72 | b | B | 45.1±0.93 | b | B | ||
| 晚稻 | 28.7±0.65 | a | A | 55.1±0.39 | a | A | |||
| 2018年 | 早稻 | 40.7±1.34 | b | B | 43.7±5.34 | b | B | ||
| 晚稻 | 29.8±1.21 | a | A | 55.2±2.23 | a | A | |||
| 稻田产量 | 区域 | 不同处理 | 2016年早造 | 2016年晚造 | 2017年早造 | 2017年晚造 | 2018年早造 | 2018年晚造 | 均值1 | 均值2 | 变异系数 |
|---|---|---|---|---|---|---|---|---|---|---|---|
| 稻米产量/ (kg·30−1·m−2) | 韶关 | CK | 18.63±0.25c | 15.67±0.81c | 20.37±1.89b | 18.13±1.04c | 20.93±1.37b | 18.83±0.58c | 18.76 | 20.06 | 10.92 |
| C | 20.20±0.46b | 17.87±0.74ab | 22.17±1.15ab | 19.40±1.37b | 23.67±0.76a | 21.43±0.75b | 20.79 | ||||
| Fe | 18.37±0.45c | 16.57±1.10bc | 20.03±1.57b | 18.77±1.42bc | 21.17±1.26b | 18.87±0.90c | 18.96 | ||||
| Fe-C | 21.47±0.38a | 18.20±0.87a | 23.60±2.33a | 21.10±1.21a | 24.13±1.70a | 21.93±0.76a | 21.74 | ||||
| 惠州 | CK | 16.36±0.94b | 15.65±0.43c | 17.44±0.40c | 16.19±0.71c | 20.03±0.40b | 18.13±0.54b | 17.30 | 18.46 | 10.99 | |
| C | 18.75±0.30a | 18.15±0.17a | 19.30±0.54ab | 18.29±0.48b | 22.06±1.46a | 20.92±1.09a | 19.58 | ||||
| Fe | 15.77±1.17b | 16.71±0.35b | 17.61±1.63bc | 15.71±0.41c | 18.29±2.19b | 16.72±1.12c | 16.80 | ||||
| Fe-C | 18.77±1.16a | 18.49±0.65a | 20.10±0.24a | 19.18±0.80a | 22.89±0.38a | 21.47±0.55a | 20.15 |
表6 不同栽培年限韶关和惠州试验地稻米产量的描述性统计
Table 6 Descriptive statistics of rice yield from Shaoguan and Huizhou experimental sites with different cultivation durations
| 稻田产量 | 区域 | 不同处理 | 2016年早造 | 2016年晚造 | 2017年早造 | 2017年晚造 | 2018年早造 | 2018年晚造 | 均值1 | 均值2 | 变异系数 |
|---|---|---|---|---|---|---|---|---|---|---|---|
| 稻米产量/ (kg·30−1·m−2) | 韶关 | CK | 18.63±0.25c | 15.67±0.81c | 20.37±1.89b | 18.13±1.04c | 20.93±1.37b | 18.83±0.58c | 18.76 | 20.06 | 10.92 |
| C | 20.20±0.46b | 17.87±0.74ab | 22.17±1.15ab | 19.40±1.37b | 23.67±0.76a | 21.43±0.75b | 20.79 | ||||
| Fe | 18.37±0.45c | 16.57±1.10bc | 20.03±1.57b | 18.77±1.42bc | 21.17±1.26b | 18.87±0.90c | 18.96 | ||||
| Fe-C | 21.47±0.38a | 18.20±0.87a | 23.60±2.33a | 21.10±1.21a | 24.13±1.70a | 21.93±0.76a | 21.74 | ||||
| 惠州 | CK | 16.36±0.94b | 15.65±0.43c | 17.44±0.40c | 16.19±0.71c | 20.03±0.40b | 18.13±0.54b | 17.30 | 18.46 | 10.99 | |
| C | 18.75±0.30a | 18.15±0.17a | 19.30±0.54ab | 18.29±0.48b | 22.06±1.46a | 20.92±1.09a | 19.58 | ||||
| Fe | 15.77±1.17b | 16.71±0.35b | 17.61±1.63bc | 15.71±0.41c | 18.29±2.19b | 16.72±1.12c | 16.80 | ||||
| Fe-C | 18.77±1.16a | 18.49±0.65a | 20.10±0.24a | 19.18±0.80a | 22.89±0.38a | 21.47±0.55a | 20.15 |
| 重金属含量 | 区域 | 不同处理 | 2016年早造 | 2016年晚造 | 2017年早造 | 2017年晚造 | 2018年早造 | 2018年晚造 | 均值1 | 均值2 | 变异系数 |
|---|---|---|---|---|---|---|---|---|---|---|---|
| 稻米Cd质量分数/(mg·kg−1) | 韶关 | CK | 0.70±0.07a | 0.75±0.07a | 0.74±0.06a | 0.70±0.02a | 0.69±0.08a | 0.69±0.05a | 0.71 | 0.55 | 25.14 |
| C | 0.53±0.04b | 0.51±0.03b | 0.46±0.03c | 0.44±0.04c | 0.46±0.05b | 0.47±0.04bc | 0.48 | ||||
| Fe | 0.65±0.02a | 0.67±0.05a | 0.63±0.05b | 0.61±0.06b | 0.63±0.05a | 0.55±0.01b | 0.62 | ||||
| Fe-C | 0.29±0.03c | 0.48±0.04b | 0.33±0.02d | 0.44±0.02c | 0.31±0.02c | 0.45±0.03c | 0.38 | ||||
| 惠州 | CK | 0.43±0.03a | 0.46±0.03a | 0.46±0.03a | 0.50±0.02a | 0.43±0.01a | 0.48±0.01a | 0.46 | 0.37 | 23.42 | |
| C | 0.39±0.03a | 0.39±0.03b | 0.38±0.01b | 0.39±0.00b | 0.38±0.00b | 0.39±0.02b | 0.39 | ||||
| Fe | 0.38±0.05a | 0.41±0.05ab | 0.37±0.01b | 0.39±0.01b | 0.39±0.00b | 0.36±0.02c | 0.38 | ||||
| Fe-C | 0.19±0.00b | 0.26±0.00c | 0.21±0.00c | 0.30±0.00c | 0.19±0.01c | 0.29±0.01d | 0.24 | ||||
| 稻米As质量分数/(mg·kg−1) | 韶关 | CK | 1.00±0.11a | 1.14±0.15a | 1.13±0.12b | 1.25±0.15a | 1.17±0.14b | 1.27±0.18a | 1.16 | 0.94 | 38.26 |
| C | 1.05±0.10a | 1.14±0.17a | 1.49±0.07a | 1.44±0.13a | 1.35±0.06a | 1.42±0.04a | 1.32 | ||||
| Fe | 0.79±0.03b | 0.77±0.05b | 0.81±0.08c | 0.83±0.03b | 0.90±0.04c | 0.81±0.08b | 0.82 | ||||
| Fe-C | 0.52±0.03c | 0.32±0.03c | 0.54±0.04d | 0.36±0.01c | 0.60±0.03d | 0.36±0.03c | 0.45 | ||||
| 惠州 | CK | 0.33±0.01b | 0.31±0.01a | 0.38±0.02a | 0.33±0.00a | 0.42±0.01a | 0.38±0.01a | 0.36 | 0.30 | 28.58 | |
| C | 0.37±0.01a | 0.35±0.04a | 0.38±0.01a | 0.35±0.02a | 0.43±0.01a | 0.39±0.01a | 0.38 | ||||
| Fe | 0.26±0.02c | 0.22±0.00b | 0.28±0.01b | 0.26±0.00b | 0.34±0.03b | 0.32±0.01b | 0.28 | ||||
| Fe-C | 0.19±0.01d | 0.14±0.00c | 0.22±0.01c | 0.15±0.00c | 0.24±0.01c | 0.17±0.01c | 0.19 |
表7 不同栽培年限韶关和惠州试验地稻米镉、砷含量的描述性统计
Table 7 Descriptive statistics of cadmium and arsenic contents in rice grain from Shaoguan and Huizhou experimental sites with different cultivation durations
| 重金属含量 | 区域 | 不同处理 | 2016年早造 | 2016年晚造 | 2017年早造 | 2017年晚造 | 2018年早造 | 2018年晚造 | 均值1 | 均值2 | 变异系数 |
|---|---|---|---|---|---|---|---|---|---|---|---|
| 稻米Cd质量分数/(mg·kg−1) | 韶关 | CK | 0.70±0.07a | 0.75±0.07a | 0.74±0.06a | 0.70±0.02a | 0.69±0.08a | 0.69±0.05a | 0.71 | 0.55 | 25.14 |
| C | 0.53±0.04b | 0.51±0.03b | 0.46±0.03c | 0.44±0.04c | 0.46±0.05b | 0.47±0.04bc | 0.48 | ||||
| Fe | 0.65±0.02a | 0.67±0.05a | 0.63±0.05b | 0.61±0.06b | 0.63±0.05a | 0.55±0.01b | 0.62 | ||||
| Fe-C | 0.29±0.03c | 0.48±0.04b | 0.33±0.02d | 0.44±0.02c | 0.31±0.02c | 0.45±0.03c | 0.38 | ||||
| 惠州 | CK | 0.43±0.03a | 0.46±0.03a | 0.46±0.03a | 0.50±0.02a | 0.43±0.01a | 0.48±0.01a | 0.46 | 0.37 | 23.42 | |
| C | 0.39±0.03a | 0.39±0.03b | 0.38±0.01b | 0.39±0.00b | 0.38±0.00b | 0.39±0.02b | 0.39 | ||||
| Fe | 0.38±0.05a | 0.41±0.05ab | 0.37±0.01b | 0.39±0.01b | 0.39±0.00b | 0.36±0.02c | 0.38 | ||||
| Fe-C | 0.19±0.00b | 0.26±0.00c | 0.21±0.00c | 0.30±0.00c | 0.19±0.01c | 0.29±0.01d | 0.24 | ||||
| 稻米As质量分数/(mg·kg−1) | 韶关 | CK | 1.00±0.11a | 1.14±0.15a | 1.13±0.12b | 1.25±0.15a | 1.17±0.14b | 1.27±0.18a | 1.16 | 0.94 | 38.26 |
| C | 1.05±0.10a | 1.14±0.17a | 1.49±0.07a | 1.44±0.13a | 1.35±0.06a | 1.42±0.04a | 1.32 | ||||
| Fe | 0.79±0.03b | 0.77±0.05b | 0.81±0.08c | 0.83±0.03b | 0.90±0.04c | 0.81±0.08b | 0.82 | ||||
| Fe-C | 0.52±0.03c | 0.32±0.03c | 0.54±0.04d | 0.36±0.01c | 0.60±0.03d | 0.36±0.03c | 0.45 | ||||
| 惠州 | CK | 0.33±0.01b | 0.31±0.01a | 0.38±0.02a | 0.33±0.00a | 0.42±0.01a | 0.38±0.01a | 0.36 | 0.30 | 28.58 | |
| C | 0.37±0.01a | 0.35±0.04a | 0.38±0.01a | 0.35±0.02a | 0.43±0.01a | 0.39±0.01a | 0.38 | ||||
| Fe | 0.26±0.02c | 0.22±0.00b | 0.28±0.01b | 0.26±0.00b | 0.34±0.03b | 0.32±0.01b | 0.28 | ||||
| Fe-C | 0.19±0.01d | 0.14±0.00c | 0.22±0.01c | 0.15±0.00c | 0.24±0.01c | 0.17±0.01c | 0.19 |
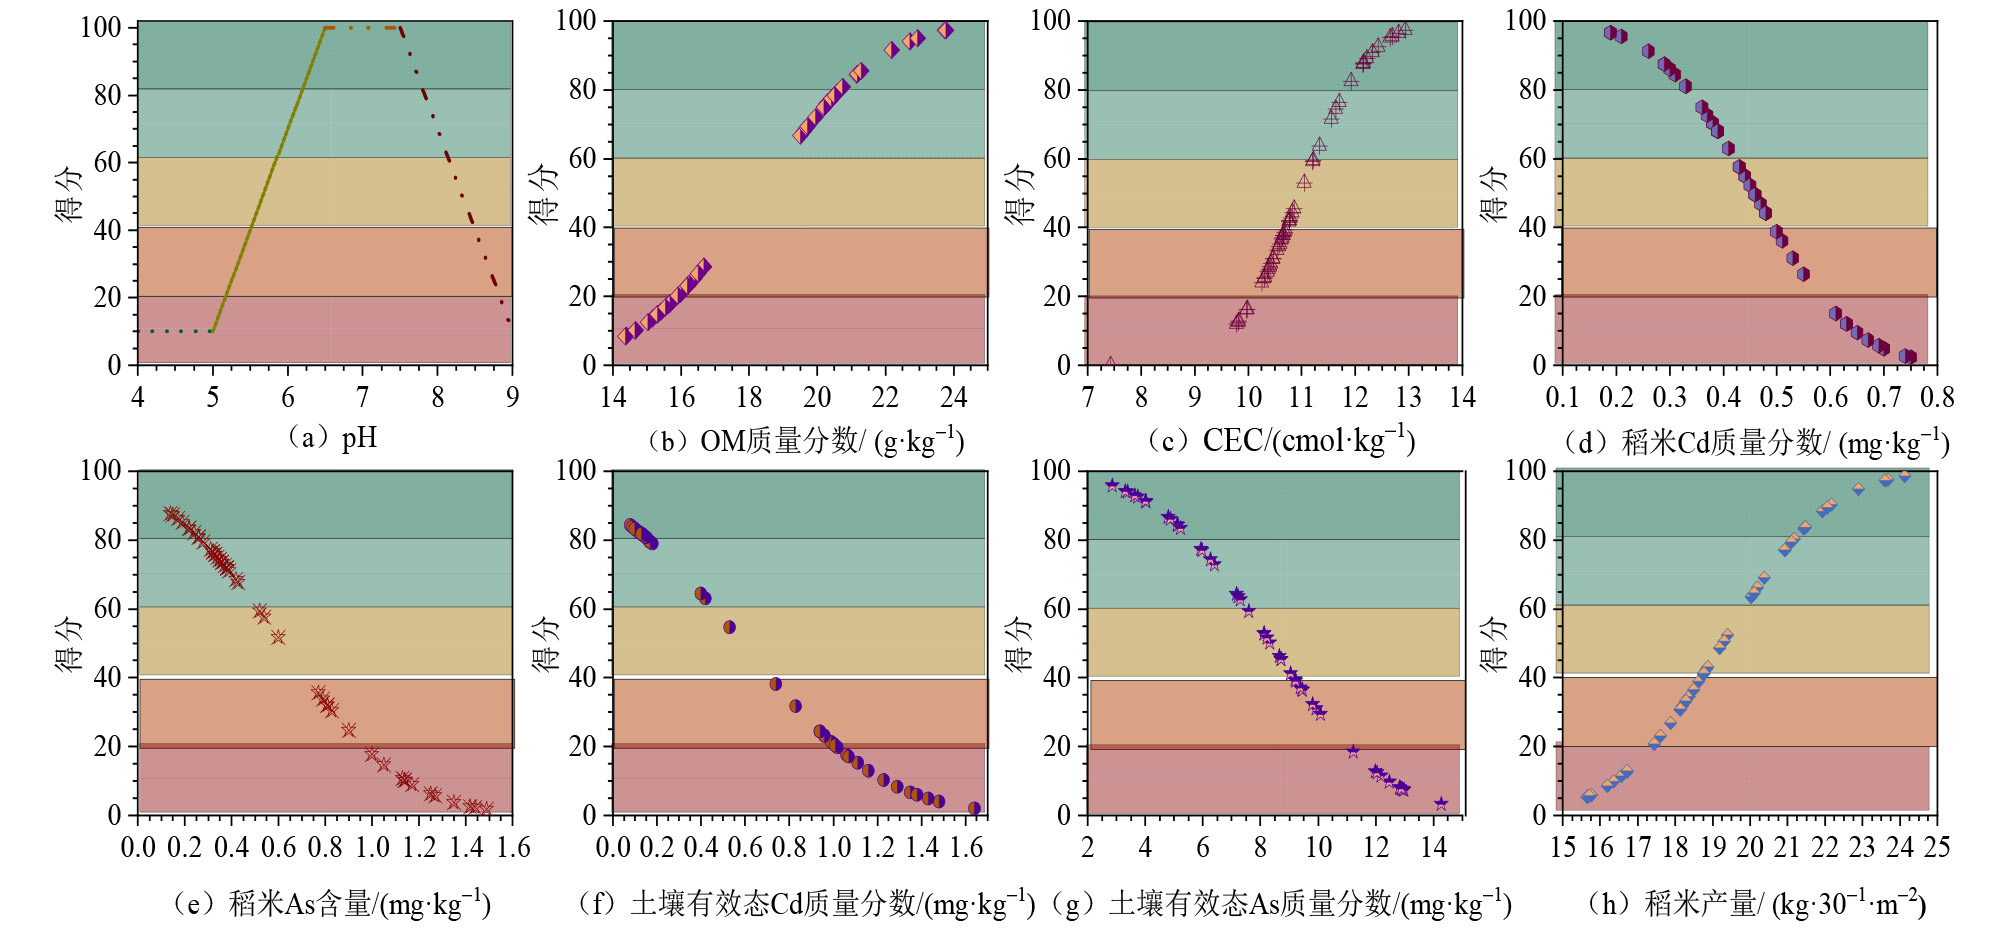
图1 土壤健康指标评分函数
Figure 1 Scoring function for soil health indicators
| 土壤健康指标 | 计分方式 | 评分函数 | |
|---|---|---|---|
| 理化性质 | pH | “中间最优型” | S=100×S′ |
| OM | “越大越好” | S=100×C | |
| CEC | “越大越好” | S=100×C | |
| 重金属含量 | 稻米Cd | “越小越好” | S=100×(1−C) |
| 稻米As | “越小越好” | S=100×(1−C) | |
| 土壤有效态Cd | “越小越好” | S=100×(1−C) | |
| 土壤有效态As | “越小越好” | S=100×(1−C) | |
| 稻田产量 | 稻米产量 | “越大越好” | S=100×C |
表8 土壤健康指标评分函数
Table 8 Scoring Function for Soil Health Indicators
| 土壤健康指标 | 计分方式 | 评分函数 | |
|---|---|---|---|
| 理化性质 | pH | “中间最优型” | S=100×S′ |
| OM | “越大越好” | S=100×C | |
| CEC | “越大越好” | S=100×C | |
| 重金属含量 | 稻米Cd | “越小越好” | S=100×(1−C) |
| 稻米As | “越小越好” | S=100×(1−C) | |
| 土壤有效态Cd | “越小越好” | S=100×(1−C) | |
| 土壤有效态As | “越小越好” | S=100×(1−C) | |
| 稻田产量 | 稻米产量 | “越大越好” | S=100×C |
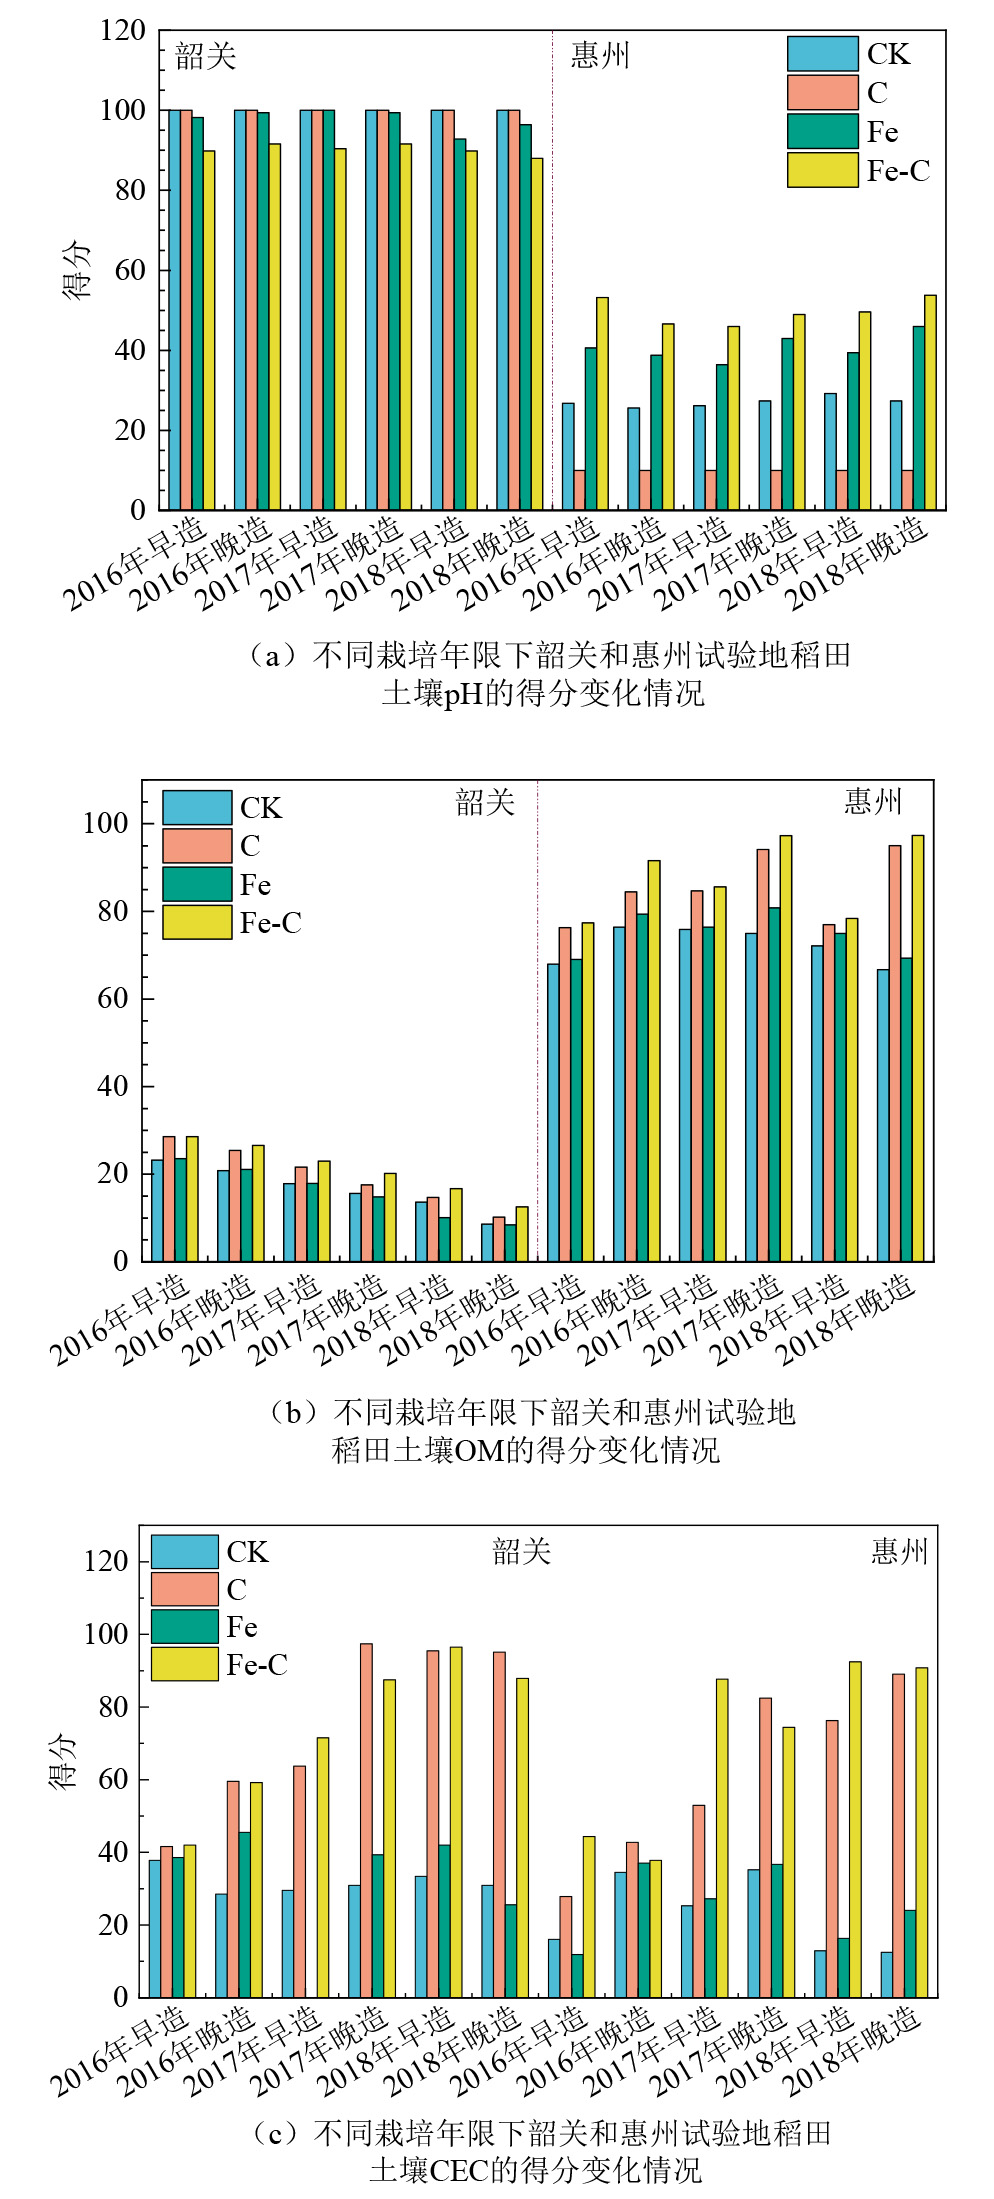
图2 土壤理化性质得分
Figure 2 Scores of soil physicochemical properties
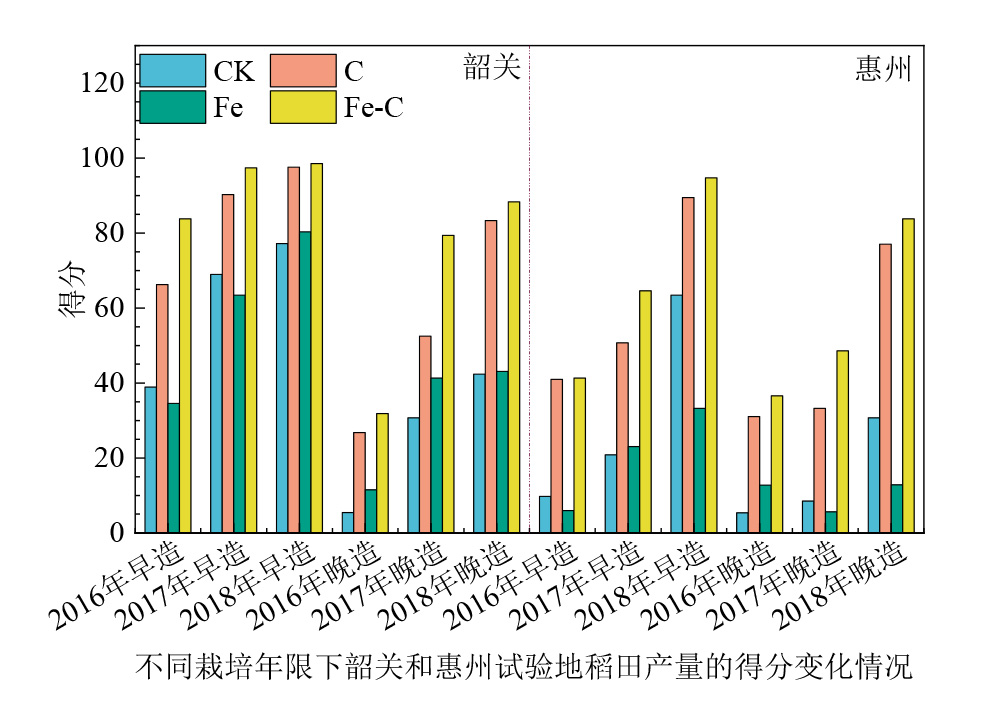
图3 稻米产量得分
Figure 3 Scores of rice yield

图4 有效态Cd、As含量得分
Figure 4 Scores of the contents of bioavailable Cd and As

图5 不同栽培年限下韶关和惠州试验地土壤健康综合得分
Figure 5 Comprehensive soil health scores of Shaoguan and Huizhou experimental sites under different cultivation durations
| [1] | CAO Y, LI X, QIAN X Y, et al., 2023. Soil health assessment in the Yangtze River Delta of China: Method development and application in orchards[J]. Agriculture, Ecosystems & Environment, 341: 108190. |
| [2] | CHANG C H, WEI C C, LIN L H, et al., 2016. Humic acids enhance the microbially mediated release of sedimentary ferrous iron[J]. Environmental Science and Pollution Research, 23(5): 4176-4184. |
| [3] | DUAN C Q, REN J, TAO L, et al., 2023. Study of the remediation effect and mechanism of biochar-loaded nZVI on heavy metal contaminated soil[J]. Sustainability, 15(24): 16753. |
| [4] | FAN J, CHEN X, XU Z B, et al., 2020. One-pot synthesis of nZVI-embedded biochar for remediation of two mining arsenic-contaminated soils-Arsenic immobilization associated with iron transformation[J]. Journal of Hazardous Materials, 398: 122901. |
| [5] | FERREIRA C S S, SEIFOLLAHI-AGHMIUNI S, DESTOUNI G, et al., 2022. Soil degradation in the European Mediterranean region: Processes, status and consequences[J]. Science of The Total Environment, 805: 150106. |
| [6] | FINE A K, VAN ES H M, SCHINDELBECK R R, 2017. Statistics, scoring functions, and regional analysis of a comprehensive soil health database[J]. Soil Science Society of America Journal, 81(3): 589-601. |
| [7] | KARLEN D L, VEUM K S, SUDDUTH K A, et al., 2019. Soil health assessment-Past accomplishments, current activities, and future opportunities[J]. Soil & Tillage Research, 195: 104365. |
| [8] | LIU J W, JIANG J G, MENG Y, et al., 2020. Preparation, environmental application and prospect of biochar-supported metal nanoparticles: A review[J]. Journal of Hazardous Materials, 388: 122026. |
| [9] | QIAO J T, LIU T X, WANG X Q, et al., 2018. Simultaneous alleviation of cadmium and arsenic accumulation in rice by applying zero-valent iron and biochar to contaminated paddy soils[J]. Chemosphere, 195: 260-271. |
| [10] | SUN Z, QIAN X Y, SHAABAN M, et al., 2019. Effects of iron(III) reduction on organic carbon decomposition in two paddy soils under flooding conditions[J]. Environmental Science and Pollution Research, 26(12): 12481-12490. |
| [11] | THOMASARRIGO L K, VONTOBEL S, NOTINI L, et al., 2023. Coprecipitation with ferrihydrite inhibits mineralization of glucuronic acid in an anoxic soil[J]. Environmental Science & Technology, 57(25): 9204-9213. |
| [12] | TSVETNOV E V, MAKAROV O A, STROKOV A S, et al., 2021. The role of soils in land degradation assessment: A review[J]. Eurasian Soil Science, 54(3): 441-447. |
| [13] | WANG L, CHEN H R, WU J Z, et al., 2021. Effects of magnetic biochar-microbe composite on Cd remediation and microbial responses in paddy soil[J]. Journal of Hazardous Materials, 414: 125494. |
| [14] |
WANG S S, ZHAO M Y, ZHOU M, et al., 2019. Biochar-supported nZVI (nZVI/BC) for contaminant removal from soil and water: A critical review[J]. Journal of Hazardous Materials, 373: 820-834.
DOI PMID |
| [15] | WANG X Q, LIU T X, LI F B, et al., 2018. Effects of simultaneous application of ferrous iron and nitrate on arsenic accumulation in rice grown in contaminated paddy soil[J]. ACS Earth and Space Chemistry, 2(2): 103-111. |
| [16] | WANG Y L, LIU Y Z, SU G P, et al., 2021. Transformation and implication of nanoparticulate zero valent iron in soils[J]. Journal of Hazardous Materials, 412: 125207. |
| [17] | WU D, WU L, LIU K L, et al., 2024. Contrasting effects of iron oxides on soil organic carbon accumulation in paddy and upland fields under long-term fertilization[J]. Journal of Environmental Management, 369: 122286. |
| [18] | XU J X, LI X M, SUN G X, et al., 2019. Fate of labile organic carbon in paddy soil is regulated by microbial ferric iron reduction[J]. Environmental Science & Technology, 53(15): 8533-8542. |
| [19] |
XUE W J, WEN S Q, CHEN X Y, et al., 2024. How does the biochar-supported sulfidized nanoscale zero-valent iron affect the soil environment and microorganisms while remediating cadmium contaminated paddy soil?[J]. Environmental Geochemistry and Health, 46(7): 222.
DOI PMID |
| [20] | ZECCHIN S, WANG J, MARTIN M, et al., 2023. Microbial communities in paddy soils: Differences in abundance and functionality between rhizosphere and pore water, the influence of different soil organic carbon, sulfate fertilization and cultivation time, and contribution to arsenic mobility and speciation[J]. FEMS Microbiology Ecology, 99(11): 1-15. |
| [21] | ZHANG H H, CHEN J J, ZHU L, et al., 2011. Spatial patterns and variation of soil cadmium in Guangdong Province, China[J]. Journal of Geochemical Exploration, 109(1-3): 86-91. |
| [22] | ZHANG J Z, LI Y Z, JIA J Y, et al., 2023. Applicability of soil health assessment for wheat-maize cropping systems in smallholders’ farmlands[J]. Agriculture, Ecosystems & Environment, 353: 108558. |
| [23] | ZHANG Y, ZHAO C C, CHEN G L, et al., 2020. Response of soil microbial communities to additions of straw biochar, iron oxide, and iron oxide-modified straw biochar in an arsenic-contaminated soil[J]. Environmental Science and Pollution Research, 27(19): 23761-23768. |
| [24] | ZHOU G X, CHEN L, ZHANG C Z, et al., 2023. Bacteria-virus interactions are more crucial in soil organic carbon storage than iron protection in biochar-amended paddy soils[J]. Environmental Science & Technology, 57(48): 19713-19722. |
| [25] | 陈娟, 袁贝, 任杰, 等, 2022. 农用地土壤Cd有效态含量的安全阈值研究[J]. 环境科学研究, 35(12): 2792-2800. |
| CHEN J, YUAN B, REN J, et al., 2022. Study on safety threshold of available cd in agriculture land soil[J]. Research of Environmental Sciences, 35(12): 2792-2800. | |
| [26] | 李烜桢, 骆永明, 侯德义, 2022. 土壤健康评估指标框架及程序研究进展[J]. 土壤学报, 59(3): 617-624. |
| LI X Z, LUO Y M, HOU D Y, 2022. The indicators, framework and procedures for soil health: A critical review[J]. Acta Pedologica Sinica, 59(3): 617-624. | |
| [27] | 宋启道, 方佳, 王富华, 等, 2008. 广东省主要蔬菜产地土壤中重金属含量调查与评价[J]. 环境污染与防治 (5): 91-93. |
| SONG Q D, FANG J, WANG F H, et al., 2008. Investigation and evaluation of heavy metal content in soils of main vegetable producing areas in Guangdong Province[J]. Environmental Pollution & Control (5): 91-93. | |
| [28] |
王向琴, 刘传平, 杜衍红, 等, 2018. 零价铁与腐殖质复合调理剂对稻田镉砷污染钝化的效果研究[J]. 生态环境学报, 27(12): 2329-2336.
DOI |
| WANG X Q, LIU C P, DU Y H, et al., 2018. Effects of stabilizing remediation of Cd and As in paddy rice by applying combined zero-valent iron and humus[J]. Ecology and Environmental Sciences, 27(12): 2329-2336. | |
| [29] | 吴克宁, 杨淇钧, 赵瑞, 2021. 耕地土壤健康及其评价探讨[J]. 土壤学报, 58(3): 537-544. |
| WU K N, YANG Q J, ZHAO R, 2021. A discussion on soil health assessment of arable land in China[J]. Acta Pedologica Sinica, 58(3): 537-544. | |
| [30] | 杨国义, 张天彬, 万洪富, 等, 2007. 广东省典型区域农业土壤中重金属污染空间差异及原因分析[J]. 土壤, 39(3): 387-392. |
| YANG G Y, ZHANG T B, WAN H F, et al., 2007. Spatial differences and causes of heavy metal pollution in agricultural soils in typical regions of Guangdong Province[J]. Soils, 39(3): 387-392. | |
| [31] | 中华人民共和国生态环境部, 国家市场监督管理总局, 2018. 土壤环境质量农用地土壤污染风险管控标准 (试行): GB 15618—2018[S]. 北京: 中国环境出版集团: 4. |
| Ministry of Ecology and Environment of the People’s Republic of China, State Administration for Market Regulation, 2018. Soil environmental quality Risk control standard for soil contamination of agricultural land (for trial implementation): GB 15618—2018[S]. Beijing: China Environment Publishing Group: 4. | |
| [32] | 中华人民共和国国家卫生健康委员会, 国家市场监督管理总局, 2022. 食品安全国家标准食品中污染物限量: GB 2762—2022[S]. 北京: 中国质量标准出版传媒有限公司: 18. |
| National Health Commission of the People’s Republic of China, State Administration for Market Regulation, 2022. National Food Safety Standard Maximum levels of contaminants in foods: GB 2762—2022[S]. Beijing: China Quality Standards Publishing & Media Co., Ltd.: 18. |
| [1] | 何杰, 李宗明, 杨正宇, 沈健林, 刘国平, 吴金水. 牛粪化肥配施对双季稻田CH4和N2O排放的影响[J]. 生态环境学报, 2024, 33(4): 573-584. |
| [2] | 颜思瑶, 杨光, 白艳, 高一帆, 梁露予, 龚凤, 黄国勇, 潘丹丹, 李晓敏. 淹水条件下水稻对土壤砷转化的影响[J]. 生态环境学报, 2024, 33(11): 1756-1767. |
| [3] | 梁鑫, 韩亚峰, 郑柯, 王旭刚, 陈志怀, 杜鹃. 磁铁矿对稻田土壤碳矿化的影响[J]. 生态环境学报, 2023, 32(9): 1615-1622. |
| [4] | 朱忆雯, 尹丹, 胡敏, 杜衍红, 洪泽彬, 程宽, 于焕云. 稻田土壤氮循环与砷形态转化耦合的研究进展[J]. 生态环境学报, 2023, 32(7): 1344-1354. |
| [5] | 唐海明, 石丽红, 文丽, 程凯凯, 李超, 龙泽东, 肖志武, 李微艳, 郭勇. 长期施肥对双季稻田根际土壤氮素的影响[J]. 生态环境学报, 2023, 32(3): 492-499. |
| [6] | 贺晓佳, 冯书华, 蒋明, 李明锐, 湛方栋, 李元, 何永美. UV-B辐射对水稻根际土壤活性有机碳转化和产甲烷潜力的影响[J]. 生态环境学报, 2022, 31(3): 556-564. |
| [7] | 党慧慧, 刘超, 伍翥嵘, 王圆媛, 胡正华, 李琪, 陈书涛. 不同播期粳稻稻田甲烷排放及综合效益研究[J]. 生态环境学报, 2021, 30(7): 1436-1446. |
| [8] | 陈思, 王灿, 李想, 李明锐, 湛方栋, 李元, 祖艳群, 何永美. 不同UV-B辐射增幅对稻田土壤酶活性、活性有机碳含量及温室气体排放的影响[J]. 生态环境学报, 2021, 30(6): 1260-1268. |
| 阅读次数 | ||||||
|
全文 |
|
|||||
|
摘要 |
|
|||||