生态环境学报 ›› 2022, Vol. 31 ›› Issue (11): 2101-2110.DOI: 10.16258/j.cnki.1674-5906.2022.11.001
• 研究论文 •
下一篇
曹云1( ), 孙应龙1, 姜月清1, 万君2
收稿日期:2022-07-04
出版日期:2022-11-18
发布日期:2022-12-22
作者简介:曹云(1977年生),男,高级工程师,博士,主要从事生态服务功能、生态气候变化等研究。E-mail: caoyuncy@sohu.com
基金资助:
CAO Yun1(), SUN Yinglong1, JIANG Yueqing1, WAN Jun2
Received:2022-07-04
Online:2022-11-18
Published:2022-12-22
摘要:
净生态系统初级生产力(Net Ecosystem Productivity,NEP)及影响因素的定量评估研究,有助于深入理解区域碳循环及其驱动机制。作为气候变化敏感区域,黄河流域净生态系统生产力的时空变化特征及其气候驱动因子的研究,对阐明中国北方陆地碳汇格局特征具有重要意义。因此,该研究基于NEP的估算模型,采用趋势分析、相关分析、聚类分析等分析方法,对2000-2020年黄河流域NEP时空演变特征及其驱动机制进行分析。结果表明,(1)黄河流域年均NEP为92.7 g·m-2,总体上表现为碳汇。在空间分布上,NEP呈现从西向东逐步递增的分布特征,并存在明显的空间聚集效应,高值和低值聚集区域分别占流域面积的32.6%、41.7%。(2)2000年以来黄河流域NEP总体呈增加趋势,平均每年增加4.7 g·m-2,其中有62.4%的地区NEP增加趋势达到显著水平,植被固碳能力提升明显。在不同分区中,黄河中游地区NEP增加速率最大,平均每年增加7.8 g·m-2;在不同植被类型中,常绿林NEP提升最为显著,具有显著增加趋势的面积占比最高,达到82.8%。(3)从未来变化特征看,黄河流域NEP的Hurst指数平均为0.74,未来变化趋势具有强可持续性特征。其中NEP呈显著增加趋势,且未来保持强持续性的区域面积占比达到56.2%,说明未来黄河流域大部地区固碳能力仍将保持提升趋势。(4)从气候相关分析看,流域NEP多与降水呈正相关性,与日照时数呈负相关性,而气温影响不显著。在关键气候因子的影响范围方面,降水影响面积最大,占比达到70%;日照时数次之(19.3%);气温影响范围最小(10.7%)。因此,降水是影响黄河流域NEP空间分布的最主要气候因子。
中图分类号:
曹云, 孙应龙, 姜月清, 万君. 黄河流域净生态系统生产力的时空分异特征及其驱动因子分析[J]. 生态环境学报, 2022, 31(11): 2101-2110.
CAO Yun, SUN Yinglong, JIANG Yueqing, WAN Jun. Analysis on Temporal-spatial Variations and Driving Factors of Net Ecosystem Productivity in the Yellow River Basin[J]. Ecology and Environment, 2022, 31(11): 2101-2110.
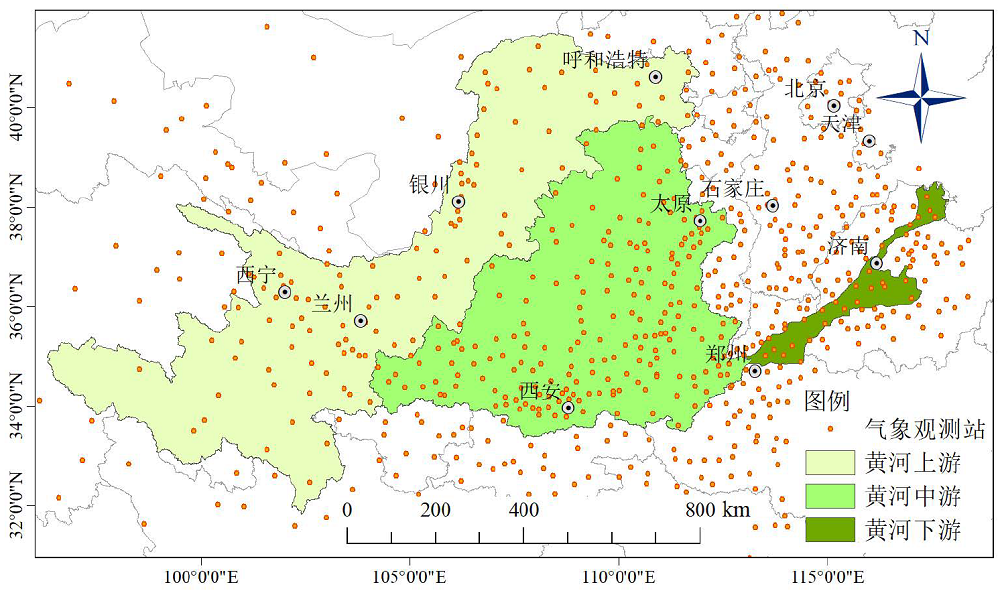
图1 黄河流域气象监测站点分布示意图
Figure 1 Spatial distribution of meteorological observation stations in the Yellow River Basin

图2 2000-2020年黄河流域NEP均值空间分布
Figure 2 Spatial distribution of annual average value of NEP in the Yellow River Basin from 2000 to 2020

图3 黄河流域NEP空间聚类分布特征 NS:不显著;HH:高高聚类;HL:高低聚类;LH:低高聚类;LL:低低聚类
Figure 3 Spatial agglomeration characteristics of NEP Anselin Local Moran’s I in the Yellow River Basin NS: Not significant; HH: High and high clustering; HL: High and low clustering; LH: Low and high clustering; LL: Low and low clustering
| 年份 Year | 高高聚集 HH/% | 高低聚集 HL/% | 低高聚集 LH/% | 低低聚集 LL/% | 不显著 NS/% |
|---|---|---|---|---|---|
| 2000 | 26.6 | 0.5 | 0.8 | 41.6 | 30.5 |
| 2005 | 29.5 | 0.4 | 0.6 | 42.5 | 27.1 |
| 2010 | 32.7 | 0.4 | 0.7 | 41.6 | 24.6 |
| 2015 | 29.6 | 0.2 | 0.4 | 45.1 | 24.7 |
| 2020 | 32.3 | 0.3 | 0.4 | 43.4 | 23.6 |
| 2000-2020 | 32.6 | 0.3 | 0.5 | 41.7 | 24.9 |
表1 黄河流域不同空间集聚特征的面积百分比
Table 1 Statistics of area percentage with different spatial agglomeration characteristics in the Yellow River Basin
| 年份 Year | 高高聚集 HH/% | 高低聚集 HL/% | 低高聚集 LH/% | 低低聚集 LL/% | 不显著 NS/% |
|---|---|---|---|---|---|
| 2000 | 26.6 | 0.5 | 0.8 | 41.6 | 30.5 |
| 2005 | 29.5 | 0.4 | 0.6 | 42.5 | 27.1 |
| 2010 | 32.7 | 0.4 | 0.7 | 41.6 | 24.6 |
| 2015 | 29.6 | 0.2 | 0.4 | 45.1 | 24.7 |
| 2020 | 32.3 | 0.3 | 0.4 | 43.4 | 23.6 |
| 2000-2020 | 32.6 | 0.3 | 0.5 | 41.7 | 24.9 |
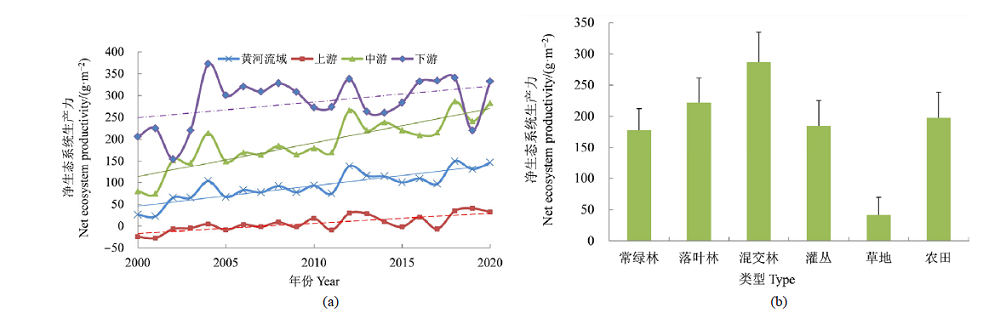
图4 2000-2020年黄河流域NEP逐年变化特征(a)及其植被NEP年均值(b)
Figure 4 Inter-annual variations of NEP (a) and annual average NEP of different vegetation (b) in the Yellow River Basin from 2000 to 2020
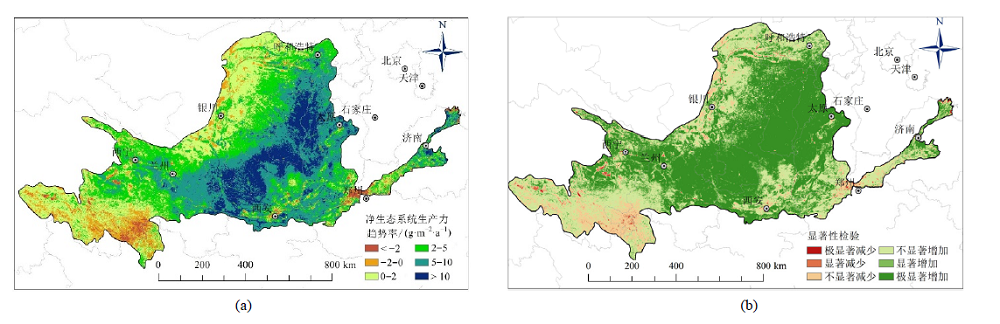
图5 黄河流域NEP变化趋势(a)及其显著性检验(b)
Figure 5 Trend of NEP changes (a) and its significance level (b) in the Yellow River Basin
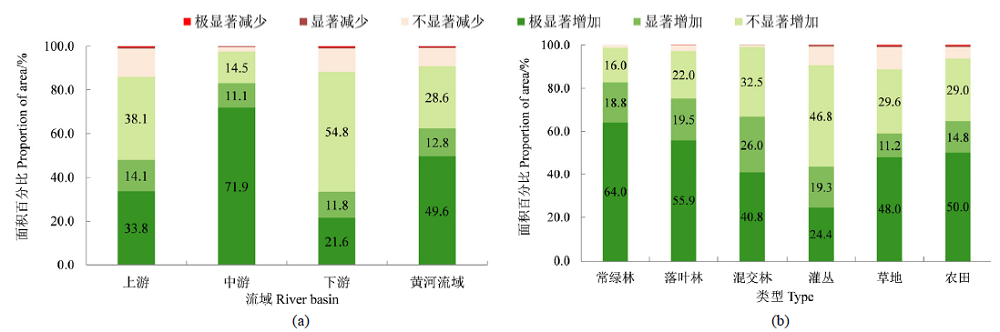
图6 黄河流域不同分区(a)和不同植被类型(b)的NEP变化趋势的面积统计
Figure 6 The proportion of area of NEP trade for different basins (a) and different types (b) in the Yellow River Basin
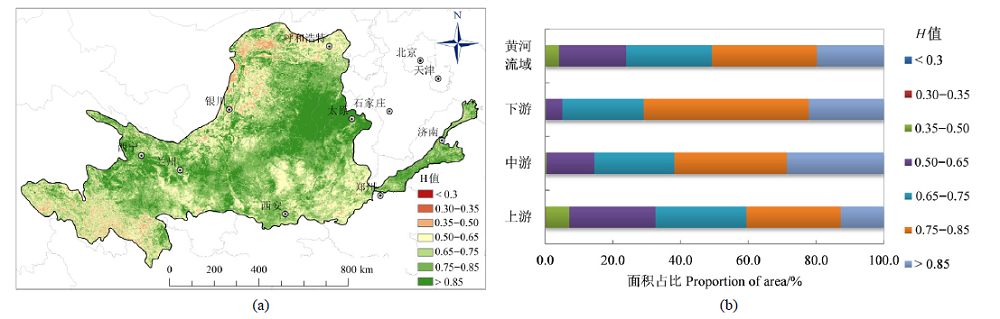
图7 黄河流域NEP的Hurst值空间分布(a)及其面积占比统计结果(b)
Figure 7 Spatial distribution of Hurst index of NEP (a) and proportion of area (b) in the Yellow River Basin

图8 2000-2020年黄河流域NEP与降水(a)、气温(b)和日照时数(c)的相关性分析
Figure 8 Correlation between NEP and precipitation (a), temperature (b) and sunshine hours (c) in the Yellow River Basin from 2000 to 2020

图9 黄河流域NEP关键气候影响因子的空间分布
Figure 9 Spatial distribution of key climatic factors affecting NEP in the Yellow River Basin
| [1] |
BOND-LAMBERTY B, WANG C K, GOWER S T, 2004. A global relationship between the heterotrophic and autotrophic components of soil respiration[J]. Global Change Biology, 10(10): 1756-1766.
DOI URL |
| [2] |
CHEN S T, HUANG Y, ZOU J W, et al., 2010. Modeling interannual variability of global soil respiration from climate and soil properties[J]. Agricultural and Forest Meteorology, 150(4): 590-605.
DOI URL |
| [3] |
CHEN Y P, FU B J, ZHAO Y, et al., 2020. Sustainable development in the Yellow River Basin: Issues and strategies[J]. Journal of Cleaner Production, 263: 121223.
DOI URL |
| [4] |
FANG J Y, GUO Z D, PIAO S L, et al., 2007. Terrestrial vegetation carbon sinks in China, 1981-2000[J]. Science in China (Series D: Earth Sciences), 50(9): 1341-1350.
DOI URL |
| [5] |
GOWARD S N, DYE D G, 1987. Evaluating North-American net primary productivity with satellite observations[J]. Advanced Space Research, 7(11): 165-174.
DOI URL |
| [6] |
LIU C X, ZHANG X D, WANG T, et al., 2022. Detection of vegetation coverage changes in the Yellow River Basin from 2003 to 2020[J]. Ecological Indicators, 138: 108818.
DOI URL |
| [7] |
REN Z G, TIAN Z H, WEI H T, et al., 2022. Spatiotemporal evolution and driving mechanisms of vegetation in the Yellow River Basin, China during 2000-2020[J]. Ecological Indicators, 138: 108832.
DOI URL |
| [8] |
WANG S Y, LIU J S, MA T B, 2010. Dynamics and changes in spatial patterns of land use in Yellow River Basin, China[J]. Land Use Policy, 27(2): 313-323.
DOI URL |
| [9] | WANG W, LIAO Y C, WEN X X, et al., 2013. Dynamics of CO2 fluxes and environmental responses in the rain-fed winter wheat ecosystem of the Loess Plateau, China[J]. Science of the Total Environment, 461-462: 10-18. |
| [10] |
YAN H, WANG S Q, BILLESBACH D, et al., 2015. Improved global simulations of gross primary product based on a new definition of water stress factor and a separate treatment of C3 and C4 plants[J]. Ecological Modelling, 297: 42-59.
DOI URL |
| [11] |
YAN H, WANG S Q, WANG J B, et al., 2019. Multi-model analysis of climate impacts on plant photosynthesis in China during 2000-2015[J]. International Journal of Climatology, 39(15): 5539-5555.
DOI URL |
| [12] |
YIN R S, YIN G, 2010. China’s ecological restoration: Initiation, implementation, and challenges[J]. Environmental Management, 45(3): 429-441.
DOI URL |
| [13] |
ZHANG Z Y, LIU K, WANG S D, et al., 2022. Spatiotemporal evolution of ecological vulnerability in the yellow river basin under ecological restoration initiatives[J]. Ecological Indicators, 135: 108586.
DOI URL |
| [14] |
ZHAO J F, LIU D S, ZHU Y J, et al., 2022. A review of forest carbon cycle models on spatiotemporal scales[J]. Journal of Cleaner Production, 339: 130692.
DOI URL |
| [15] |
ZHAO M S, RUNNING S W, 2010. Drought-induced reduction in global terrestrial net primary production from 2000 through 2009[J]. Science, 329: 940-943.
DOI PMID |
| [16] | 曹云, 孙应龙, 陈紫璇, 等, 2022. 2000-2020年黄河流域植被生态质量变化及其对极端气候的响应[J]. 生态学报, 42(11): 4524-4535. |
| CAO Y, SUN Y L, CHEN Z X, et al., 2022. Dynamic changes of vegetation ecological quality in the Yellow River Basin and its response to extreme climate during 2000-2020[J]. Acta Ecologica Sinica, 42(11): 4524-4535. | |
| [17] |
陈丽, 郝晋珉, 王峰, 等, 2016. 基于碳循环的黄淮海平原耕地固碳功能研究[J]. 资源科学, 38(6): 1039-1053.
DOI |
|
CHEN L, HAO J M, WANG F, et al., 2016. Carbon sequestration function of cultivated land use system based on the carbon cycle for the Huang-Huai-Hai Plain[J]. Resources Science, 38(6): 1039-1053.
DOI |
|
| [18] | 邓玉娇, 王捷纯, 徐杰, 等, 2021. 广东省NDVI时空变化特征及其对气候因子的响应[J]. 生态环境学报, 30(1): 37-43. |
| DENG Y J, WANG J C, XU J, et al., 2021. Spatiotemporal variation of NDVI and its response to climatic factors in Guangdong Province[J]. Ecology and Environmental Sciences, 30(1): 37-43. | |
| [19] | 方精云, 刘国华, 徐嵩龄, 1996. 我国森林植被的生物量和净生产量[J]. 生态学报, 16(5): 497-508. |
| FANG J Y, LIU G H, XU S L, 1996. Biomass and net production of forest vegetation in China[J]. Acta Ecologica Sinica, 16(5): 497-508. | |
| [20] | 高思琦, 董国涛, 蒋晓辉, 等, 2022. 黄河源植被覆盖度变化及空间分布自然驱动力分析[J]. 生态环境学报, 31(3): 429-439. |
| GAO S Q, DONG G T, JIANG X H, et al., 2022. Analysis of vegetation coverage changes and natural driving forces of spatial distribution in the source region of the Yellow River[J]. Ecology and Environmental Sciences, 31(3): 429-439. | |
| [21] |
何源, 李星锐, 杨晓帆, 等, 2021. 内蒙古锡林郭勒盟典型草原固碳量及固碳潜力估算[J]. 草地学报, 29(10): 2274-2285.
DOI |
| HE Y, LI X R, YANG X F, et al., 2021. The estimation of actual and potential carbon sequestration in Typical Steppe in Xilingol County, Inner Mongolia[J]. Acta Agrestia Sinica, 29(10): 2274-2285. | |
| [22] | 胡波, 孙睿, 陈永俊, 等, 2011. 遥感数据结合Biome-BG模型估算黄淮海地区生态系统生产力[J]. 自然资源学报, 26(12): 2062-2070. |
| HU B, SUN R, CHEN Y J, et al., 2011. Estimation of the net ecosystem productivity in Huang-Huai Hai Region combining with Biome-BG model and remote sensing data[J]. Journal of Natural Resources, 26(12): 2062-2070. | |
| [23] | 李洁, 张远东, 顾峰雪, 等, 2014. 中国东北地区近50年净生态系统生产力的时空动态[J]. 生态学报, 34(6): 1490-1502. |
| LI J, ZHANG Y D, GU F X, et al., 2014. Temporospatial variations in net ecosystem productivity in Northeast China since 1960[J]. Acta Ecologica Sinica, 34(6): 1490-1502. | |
| [24] | 李学斌, 樊瑞霞, 刘学东, 2014. 中国草地生态系统碳储量及碳过程研究进展[J]. 生态环境学报, 23(11): 1845-1851. |
| LI X B, FAN R X, LIU X D, 2014. Advance in studies on carbon storage and carbon process in grassland ecosystem of China[J]. Ecology and Environmental Sciences, 23(11): 1845-1851. | |
| [25] | 梁发超, 刘诗苑, 起晓星, 等, 2019. 近30年闽南沿海乡村聚落用地空间演化过程研究[J]. 农业工程学报, 35(22): 18-26. |
| LIANG F C, LIU S Y, QI X X et al., 2019. Spatial evolution process of rural settlement land in coastal areas of Southern Fujian in recent 30 years[J]. Transactions of the Chinese Society of Agricultural Engineering, 35(22): 18-26. | |
| [26] | 刘凤, 曾永年, 2021. 2000-2015年青海高原植被碳源/汇时空格局及变化[J]. 生态学报, 41(14): 5792-5803. |
| LIU F, ZENG Y N, 2021. Analysis of the spatio-temporal variation of vegetation carbon source/sink in Qinghai Plateau from 2000-2015[J]. Acta Ecologica Sinica, 41(14): 5792-5803. | |
| [27] | 刘绿柳, 魏麟骁, 徐影, 等, 2021. 气候变化对黄河流域生态径流影响预估[J]. 水科学进展, 32(6): 824-833. |
| LIU L L, WEI L X, XU Y, et al., 2021. Projection of climate change impacts on ecological flow in the Yellow River basin[J]. Advances in Water Science, 32(6): 824-833. | |
| [28] | 刘应帅, 余瑞, 郑彬彬, 等, 2022. 海南岛森林植被NEP季节性时空变化规律及气候驱动因素分析[J]. 热带生物学报, 13(2): 166-176. |
| LIU Y S, YU R, ZHENG B B, 2022. Analysis of seasonal spatial and temporal variation patterns of forest vegetation NEP and climate drivers in Hainan Island[J]. Journal of Tropical Biology, 13(2): 166-176. | |
| [29] | 马建勇, 谷晓平, 黄玫, 等, 2013. 近50年贵州净生态系统生产力时空分布特征[J]. 生态环境学报, 22(9): 1462-1470. |
| MA J Y, GU X P, HUANG M, et al., 2013. Temporal-spatial distribution of net ecosystem productivity in Guizhou during the recent 50 years[J]. Ecology and Environmental Sciences, 22(9): 1462-1470. | |
| [30] | 牛海生, 李大平, 张娜, 等, 2014. 不同灌溉方式冬小麦农田生态系统碳平衡研究[J]. 生态环境学报, 23(5): 749-755. |
| NIU H S, LI D P, ZHANG N, et al., 2014. Effect of irrigation modes on carbon budget in winter wheat field[J]. Ecology and Environmental Sciences, 23(5): 749-755. | |
| [31] | 庞瑞, 顾峰雪, 张远东, 等, 2012. 西南高山地区净生态系统生产力时空动态[J]. 生态学报, 32(24): 7844-7856. |
|
PANG R, GU F X, ZHANG Y D, 2012. Temporal-spatial variations of net ecosystem productivity in alpine area of southwestern China[J]. Acta Ecologica Sinica, 32(24): 7844-7856.
DOI URL |
|
| [32] | 孙滨峰, 赵红, 逯非, 等, 2018. 东北森林带森林生态系统固碳服务空间特征及其影响因素[J]. 生态学报, 38(14): 4975-4983. |
| SUN B F, ZHAO H, LU F, et al., 2018. Spatial and temporal patterns of carbon sequestration in the Northeastern Forest Regions and its impact factors analysis[J]. Acta Ecologica Sinica, 38(14): 4975-4983. | |
| [33] | 孙睿, 刘昌明, 朱启疆, 2001. 黄河流域植被覆盖度动态变化与降水的关系[J]. 地理学报, 56(6): 667-672. |
|
SUN R, LIU C M, ZHU Q J, 2001. Relationship between the fractional vegetation cover change and rainfall in the Yellow River Basin[J]. Acta Geographica Sinica, 56(6): 667-672.
DOI |
|
| [34] | 陶波, 曹明奎, 李克让, 等, 2006. 1981-2000年中国陆地净生态系统生产力空间格局及其变化[J]. 中国科学D辑, 36(12): 1131-1139. |
| TAO B, CAO M K, LI K R, et al., 2006. The spatial pattern and change of terrestrial net ecosystem productivity in China from 1981 to 2000[J]. Science in China (Series D: Earth Sciences), 36(12): 1131-1139. | |
| [35] | 田义超, 杨棠, 徐欣, 2021. 北部湾典型入海流域植被净初级生产力时空分布特征及其影响因素[J]. 生态环境学报, 30(5): 938-948. |
| TIAN Y C, YANG T, XU X, 2021. Temporal and spatial distribution characteristics and influencing factors of net primary productivity of vegetation in typical basin entering the sea in Beibu Gulf[J]. Ecology and Environmental Sciences, 30(5): 938-948. | |
| [36] | 田智慧, 张丹丹, 赫晓慧, 等, 2019. 2000-2015年黄河流域植被净初级生产力时空变化特征及其驱动因子[J]. 水土保持研究, 26(2): 255-262. |
| TIAN Z H, ZHANG D D, HE X H, 2019. Spatiotemporal variations in vegetation net primary productivity and their driving factors in Yellow River Basin from 2000 to 2015[J]. Research of Soil and Water Conservation, 26(2): 255-262. | |
| [37] | 王娟, 何慧娟, 董金芳, 等, 2021. 黄河流域植被净初级生产力时空特征及自然驱动因子[J]. 中国沙漠, 41(6): 213-222. |
| WANG J, HE H J, DONG J F, et al., 2021. Spatio-temporal distribution of vegetation net primary productivity in the Yellow River Basin in 2000-2019 and its natural driving factors[J]. Journal of Desert Research, 41(6): 213-222. | |
| [38] |
王俊奇, 王广军, 梁四海, 等, 2021. 1996-2015年黄河源区植被覆盖度提取和时空变化分析[J]. 冰川冻土, 43(2): 662-674.
DOI |
| WANG J Q, WANG G J, LIANG S H, et al., 2021. Extraction and spatiotemporal analysis of vegetation coverage from 1996 to 2015 in the source region of the Yellow River[J]. Journal of Glaciology and Geocryology, 43(2): 662-674. | |
| [39] | 王效科, 冯宗炜, 欧阳志云, 2001. 中国森林生态系统的植物碳储量和碳密度研究[J]. 应用生态学报, 12(1): 13-16. |
| WANG X K, FENG Z W, OUYANG Z Y, 2001. Vegetation carbon storage and density of forest ecosystems in China[J]. Chinese Journal of Applied Ecology, 12(1): 13-16. | |
| [40] | 王艳芬, 陈怡平, 王厚杰, 等, 2021. 黄河流域生态系统变化及其生态水文效应[J]. 中国科学基金, 35(4):520-528. |
| WANG Y F, CHEN Y P, WANG H J, et al., 2021. Ecosystem change and its ecohydrological effect in the Yellow River Basin[J]. Bulletin of Natural Science Foundation of China, 35(4): 520-528. | |
| [41] | 翁翎燕, 朱振宇, 韩许高, 等, 2018. 江苏省农田植被净碳汇时空格局分析[J]. 农业工程学报, 34(6): 233-241. |
| WENG L Y, ZHU Z Y, HAN X G, et al., 2018. Spatial-temporal pattern of net carbon sink of farmland vegetation in Jiangsu Province[J]. Transactions of the Chinese Society of Agricultural Engineering, 34(6): 233-241. | |
| [42] | 肖笃宁, 解伏菊, 魏建兵, 等, 2004. 区域生态建设与景观生态学的使命[J]. 应用生态学报, 15(10): 1731-1736. |
| XIAO D N, XIE F J, WEI J B, et al., 2004. Regional ecological construction and mission of landscape ecology[J]. Chinese Journal of Applied Ecology, 15(10): 1731-1736. | |
| [43] | 谢薇, 陈书涛, 胡正华, 2011. 中国陆地生态系统土壤异养呼吸变异的影响因素[J]. 环境科学, 35(1): 334-340. |
| XIE W, CHEN S T, HU Z H, 2011. Factors influencing the variability in soil heterotrophic respiration from terrestrial ecosystem in China[J]. Environmental Science, 35(1): 334-340. | |
| [44] | 熊华, 于飞, 谷晓平, 等, 2021. 梵净山不同森林植被生物量、净生产量、碳储量及空间分布特征[J]. 生态环境学报, 30(2): 264-273. |
| XIONG H, YU F, GU X P, et al., 2021. Biomass, net production, carbon storage and spatial distrubution features of different forest vegetation in Fanjing Mountains[J]. Ecology and Environmental Sciences, 30(2): 264-273. | |
| [45] | 徐浩杰, 杨太保, 2014. 柴达木盆地植被生长时空变化特征及其对气候要素的响应[J]. 自然资源学报, 29(3): 398-409. |
| XU H J, YANG T B, 2014. Spatial-temporal variations of vegetation activities and its responses to climatic factors in the Qaidam Basin[J]. Journal of Natural Resources, 29(3): 398-409. | |
| [46] | 杨延征, 马元丹, 江洪, 等, 2016. 基于IBIS模型的1960-2006年中国陆地生态系统碳收支格局研究[J]. 生态学报, 36(13): 3911-3922. |
| YANG Y Z, MA Y D, JIANG H, et al., 2016. Evaluating the carbon budget pattern of Chinese terrestrial ecosystem from 1960 to 2006 using Integrated Biosphere Simulator[J]. Acta Ecologica Sinica, 36(13): 3911-3922. | |
| [47] | 袁丽华, 蒋卫国, 申文明, 等, 2013. 2000-2010年黄河流域植被覆盖的时空变化[J]. 生态学报, 33(24): 7798-7806. |
| YUAN L H, JIANG W G, SHEN W M, et al., 2013. The spatio-temporal variations of vegetation cover in the Yellow River Basin from 2000 to 2010[J]. Acta Ecologica Sinica, 33(24): 7798-7806. | |
| [48] | 袁沫汐, 邹玲, 林爱文, 等, 2016. 湖北省地区植被覆盖变化及其对气候因子的响应[J]. 生态学报, 36(17): 5315-5323. |
| YUAN M X, ZOU L, LIN A W, et al., 2016. Analyzing dynamic vegetation change and response to climatic factors in Hubei Province, China[J]. Acta Ecologica Sinica, 36(17): 5315-5323. | |
| [49] | 张新中, 李育, 张成琦, 等, 2020. 2000-2014年石羊河流域净生态系统生产力变化分析[J]. 兰州大学学报: 自然科学版, 56(4): 486-492. |
| ZHANG X Z, LI Y, ZHANG C Q, et al., 2020. Analysis of the net ecosystem production changes in the Shiyang River basin from 2000 to 2014[J]. Journal of Lanzhou University (Natural Sciences), 56(4): 486-492. |
| [1] | 陈科屹, 林田苗, 王建军, 何友均, 张立文. 天保工程20年对黑龙江大兴安岭国有林区森林碳库的影响[J]. 生态环境学报, 2023, 32(6): 1016-1025. |
| [2] | 董洁芳, 邓椿, 张仲伍. 渭河流域PM2.5时空演化及人口暴露风险[J]. 生态环境学报, 2023, 32(6): 1078-1088. |
| [3] | 郝蕾, 翟涌光, 戚文超, 兰穹穹. 2001-2020年内蒙古植被碳源/碳汇时空动态及对气候因子的响应[J]. 生态环境学报, 2023, 32(5): 825-834. |
| [4] | 翁升恒, 张玉琴, 姜冬昕, 潘卫华, 李丽纯, 张方敏. 福建省森林植被NEP时空变化及影响因子分析[J]. 生态环境学报, 2023, 32(5): 845-856. |
| [5] | 李建辉, 党争, 陈琳. 黄河几字弯都市圈PM2.5时空特征及影响因素分析[J]. 生态环境学报, 2023, 32(4): 697-705. |
| [6] | 秦艳培, 徐少君, 田耀武. 黄河流域河南段植被和土壤及其碳密度空间分异研究[J]. 生态环境学报, 2022, 31(9): 1745-1753. |
| [7] | 肖国举, 李秀静, 郭占强, 胡延斌, 王静. 贺兰山东麓土壤有机碳对玉米生长发育及水分利用的影响[J]. 生态环境学报, 2022, 31(9): 1754-1764. |
| [8] | 吴昊平, 秦红杰, 贺斌, 尤毅, 陈金峰, 邹春萍, 杨思雨, 郝贝贝. 基于碳中和的农业面源污染治理模式发展态势刍议[J]. 生态环境学报, 2022, 31(9): 1919-1926. |
| [9] | 苏泳松, 宋松, 陈叶, 叶子强, 钟润菲, 王昭尧. 珠江三角洲人类活动净氮输入时空特征及其影响因素[J]. 生态环境学报, 2022, 31(8): 1599-1609. |
| [10] | 姜超强, 李晨, 朱启法, 徐海清, 刘炎红, 沈嘉, 阎轶峰, 余飞, 祖朝龙. 皖南不同种植模式碳汇效应及经济效益评价[J]. 生态环境学报, 2022, 31(7): 1285-1292. |
| [11] | 付乐, 迟妍妍, 于洋, 张丽苹, 刘斯洋, 王夏晖, 许开鹏, 王晶晶, 张信. 2000—2020年黄河流域土地利用变化特征及影响因素分析[J]. 生态环境学报, 2022, 31(10): 1927-1938. |
| [12] | 张静, 杜加强, 盛芝露, 张杨成思, 吴金华, 刘博. 1982—2015年黄河流域植被NDVI时空变化及影响因素分析[J]. 生态环境学报, 2021, 30(5): 929-937. |
| 阅读次数 | ||||||
|
全文 |
|
|||||
|
摘要 |
|
|||||