生态环境学报 ›› 2021, Vol. 30 ›› Issue (9): 1777-1786.DOI: 10.16258/j.cnki.1674-5906.2021.09.001
• 研究论文 •
下一篇
张桂莲( )
)
收稿日期:2020-10-28
出版日期:2021-09-18
发布日期:2021-12-08
作者简介:张桂莲(1976年生),女,高级工程师,博士,研究方向为城市绿化碳汇计量与生态系统模型研究。E-mail: zgl@shsyky.com
基金资助:
ZHANG Guilian()
Received:2020-10-28
Online:2021-09-18
Published:2021-12-08
摘要:
城市森林在固碳释氧、应对气候变化方面发挥着重要作用,对其碳储量的估算为中国城市做好碳达峰、碳中和工作提供重要数据基础。以上海城市森林为研究对象,采用样地调查数据与Landsat OLI遥感影像,分别计算样地碳储量和遥感参数变量(波段数据、植被指数数据和纹理数据),构建基于多元逐步回归模型和普通克里格残差矫正相结合的估算模型,分析区域尺度城市森林碳储量和碳密度的空间分布特征。结果表明,(1)81个样地的碳储量范围为0.09—7.10 t,均值为2.14 t,数据有右偏分布和瘦尾特征,变异系数为0.75,样地类型多样;上海城市森林总碳储量为2.87 Mt,碳密度主要集中在13—40 t∙hm-2之间,均值为25.09 t∙hm-2,整体呈现中部较低,东西部较高的态势,与土地利用强度及城市森林分布有关。(2)主城区碳储量为0.37 Mt,碳密度为1—69 t∙hm-2,均值为21.77 t∙hm-2;非主城区碳储量为2.50 Mt,占上海城市森林碳储量的87.11%,碳密度范围为0—89 t∙hm-2,均值为25.66 t∙hm-2。(3)在选择波段反射率和遥感植被指数的同时,提取影像纹理特征并纳入模型,提高了影像的分类精度;采用多元逐步回归模型结合残差矫正的方法估算城市森林碳储量,使估算结果的均方根误差降低了10.29%,平均绝对误差降低了5.5%,提高了估算精度。
中图分类号:
张桂莲. 基于遥感估算的上海城市森林碳储量空间分布特征[J]. 生态环境学报, 2021, 30(9): 1777-1786.
ZHANG Guilian. Spatial Distribution Characteristics of Carbon Storage of Urban Forests in Shanghai Based on Remote Sensing Estimation[J]. Ecology and Environment, 2021, 30(9): 1777-1786.

图1 研究区及采样点分布 中国地图来源于国家自然资源部,审图号GS(2016)1600号
Fig. 1 Distribution of study area and sampling plots
| 区域 Area | 林分类型 Forest type | 样地数 Number of plots | 样本量 Number of samples | 最大胸径 Maximum D/cm | 最小胸径 Minimum D/cm | 平均胸径 Mean D/cm | 最大树高 Maximum tree heigtht/m | 最小树高 Minimum tree height/m | 平均树高 Mean tree height/m |
|---|---|---|---|---|---|---|---|---|---|
| 主城区 Main urban area | 栾树 Koelreuteria paniculata | 2 | 12 | 18.6—24.5 | 8.2—9.5 | 13.6—16.3 | 10.2—11.0 | 4.0—6.0 | 5.4—8.5 |
| 旱柳 Salix matsudana | 1 | 7 | 33.5 | 7.5 | 13.2 | 6.5 | 3.7 | 5.1 | |
| 雪松 Cedrus deodara | 1 | 31 | 30.1 | 7.5 | 17.0 | 9.5 | 4.3 | 8.3 | |
| 水杉 Metasequoia glyptostroboides | 1 | 20 | 27.6 | 12.9 | 19.8 | 16.5 | 6.0 | 14.6 | |
| 混交林 Mixed forest | 2 | 54 | 38—40 | 5.2—6.0 | 14.9—16.7 | 8.8—16.0 | 1.1—3.0 | 6.4—8.1 | |
| 总计 Total | 7 | 141 | 18.6—40.0 | 5.2—12.9 | 13.2—19.8 | 6.5—16.5 | 1.1—6.0 | 5.1—8.5 | |
| 非主城区 Non-main urban area | 龙柏 Sabina chinensis | 1 | 15 | 19.1 | 9.8 | 12.7 | 6.5 | 4.0 | 5.5 |
| 池杉 Taxodium ascendens | 1 | 17 | 24.5 | 13.0 | 19.1 | 13.0 | 9.8 | 11.9 | |
| 杜英 Elaeocarpus decipiens | 2 | 59 | 18.0—24.2 | 6.2—11.4 | 11.1—18.8 | 7.8—8.7 | 1.8—2.8 | 6.2—6.3 | |
| 枫香 Liquidambar formosana | 1 | 59 | 17.2 | 6.0 | 11.3 | 12.0 | 1.2 | 8.9 | |
| 枫杨 Pterocarya stenoptera | 1 | 50 | 32.4 | 10.5 | 20.3 | 20.5 | 4.2 | 14.9 | |
| 构树 Broussonetia papyrifera | 1 | 10 | 20.5 | 9.6 | 14.4 | 7.0 | 4.5 | 5.9 | |
| 广玉兰 Magnolia grandiflora | 1 | 84 | 20.5 | 7.2 | 13.8 | 9.5 | 3.6 | 7.0 | |
| 桂花 Osmanthus fragrans | 1 | 29 | 11.5 | 5.2 | 7.2 | 3.5 | 2.7 | 3.0 | |
| 榉树 Zelkova serrata | 1 | 42 | 16.0 | 5.0 | 11.3 | 8.8 | 4.3 | 7.1 | |
| 旱柳 Salix matsudana | 1 | 85 | 18.2 | 5.0 | 9.9 | 10.5 | 1.7 | 8.0 | |
| 栾树 Koelreuteria paniculata | 1 | 38 | 27.8 | 5.0 | 16.3 | 18.0 | 5.0 | 11.2 | |
| 落羽杉 Taxodium distichum | 2 | 103 | 31.7—36.5 | 7.6—8.3 | 17.1—21 | 12.0—25.0 | 2.5—3.0 | 9.3—12.1 | |
| 马褂木 Liriodendron chinense | 1 | 105 | 25.4 | 5.2 | 14.2 | 14.0 | 5.0 | 10.8 | |
| 女贞 Ligustrum lucidum | 6 | 335 | 14.0—24.9 | 4.3—11.5 | 6.9—14.6 | 5.4—11.0 | 2.5—6.0 | 4.2—7.0 | |
| 水杉 Metasequoia glyptostroboides | 8 | 349 | 11.3—39.2 | 1.9—16.7 | 8.4—26.7 | 6.6—29.5 | 2.3—8.3 | 5.6—19.4 | |
| 喜树 Camptotheca acuminata | 2 | 71 | 21.2—24.3 | 6.3—8.2 | 14.0—17.5 | 12.5—16.5 | 2.8—7.0 | 11.0—11.9 | |
| 香樟 Cinnamomum camphora | 16 | 1053 | 18.4—42.6 | 5.0—18.8 | 11.0—26.0 | 6.3—18.0 | 1.3—8.5 | 3.8—10.7 | |
| 毛白杨 Populus tomentosa | 2 | 43 | 32.8—43.0 | 15.2—15.9 | 24.3—28.9 | 13.6—28.0 | 3.5—9.9 | 11.8—21.5 | |
| 银杏 Ginkgo biloba | 4 | 200 | 8.0—14.5 | 5.0—8.0 | 7.2—9.7 | 6.0—9.0 | 0.5—4.5 | 5.4—6.1 | |
| 广玉兰 Magnolia grandiflora | 1 | 69 | 53.0 | 6.3 | 12.1 | 14.6 | 4.0 | 9.6 | |
| 紫叶李 Prunus cerasifera | 1 | 35 | 16.1 | 5.0 | 10.0 | 8.0 | 2.9 | 5.4 | |
| 棕榈 Trachycarpus fortunei | 1 | 14 | 24.8 | 13.2 | 18.6 | 6.6 | 3.0 | 4.4 | |
| 混交林 Mixed forest | 18 | 533 | 16.4—55 | 5.1—6.5 | 10.1—19.5 | 6.5—18 | 1.1—5.5 | 3.7—9.7 | |
| 总计 Total | 74 | 3398 | 8.0—55.0 | 5.0—18.8 | 6.9—28.9 | 3.0—29.5 | 0.2—9.9 | 2.6—21.5 | |
| 上海市 Shanghai | 总计 Total | 81 | 3539 | 8.0—55 | 5.0—18.8 | 6.9—28.9 | 3.0—29.5 | 0.2—9.9 | 2.6—21.5 |
表1 研究区样地信息
Table 1 Information of sampling plots of different forest types in study areas
| 区域 Area | 林分类型 Forest type | 样地数 Number of plots | 样本量 Number of samples | 最大胸径 Maximum D/cm | 最小胸径 Minimum D/cm | 平均胸径 Mean D/cm | 最大树高 Maximum tree heigtht/m | 最小树高 Minimum tree height/m | 平均树高 Mean tree height/m |
|---|---|---|---|---|---|---|---|---|---|
| 主城区 Main urban area | 栾树 Koelreuteria paniculata | 2 | 12 | 18.6—24.5 | 8.2—9.5 | 13.6—16.3 | 10.2—11.0 | 4.0—6.0 | 5.4—8.5 |
| 旱柳 Salix matsudana | 1 | 7 | 33.5 | 7.5 | 13.2 | 6.5 | 3.7 | 5.1 | |
| 雪松 Cedrus deodara | 1 | 31 | 30.1 | 7.5 | 17.0 | 9.5 | 4.3 | 8.3 | |
| 水杉 Metasequoia glyptostroboides | 1 | 20 | 27.6 | 12.9 | 19.8 | 16.5 | 6.0 | 14.6 | |
| 混交林 Mixed forest | 2 | 54 | 38—40 | 5.2—6.0 | 14.9—16.7 | 8.8—16.0 | 1.1—3.0 | 6.4—8.1 | |
| 总计 Total | 7 | 141 | 18.6—40.0 | 5.2—12.9 | 13.2—19.8 | 6.5—16.5 | 1.1—6.0 | 5.1—8.5 | |
| 非主城区 Non-main urban area | 龙柏 Sabina chinensis | 1 | 15 | 19.1 | 9.8 | 12.7 | 6.5 | 4.0 | 5.5 |
| 池杉 Taxodium ascendens | 1 | 17 | 24.5 | 13.0 | 19.1 | 13.0 | 9.8 | 11.9 | |
| 杜英 Elaeocarpus decipiens | 2 | 59 | 18.0—24.2 | 6.2—11.4 | 11.1—18.8 | 7.8—8.7 | 1.8—2.8 | 6.2—6.3 | |
| 枫香 Liquidambar formosana | 1 | 59 | 17.2 | 6.0 | 11.3 | 12.0 | 1.2 | 8.9 | |
| 枫杨 Pterocarya stenoptera | 1 | 50 | 32.4 | 10.5 | 20.3 | 20.5 | 4.2 | 14.9 | |
| 构树 Broussonetia papyrifera | 1 | 10 | 20.5 | 9.6 | 14.4 | 7.0 | 4.5 | 5.9 | |
| 广玉兰 Magnolia grandiflora | 1 | 84 | 20.5 | 7.2 | 13.8 | 9.5 | 3.6 | 7.0 | |
| 桂花 Osmanthus fragrans | 1 | 29 | 11.5 | 5.2 | 7.2 | 3.5 | 2.7 | 3.0 | |
| 榉树 Zelkova serrata | 1 | 42 | 16.0 | 5.0 | 11.3 | 8.8 | 4.3 | 7.1 | |
| 旱柳 Salix matsudana | 1 | 85 | 18.2 | 5.0 | 9.9 | 10.5 | 1.7 | 8.0 | |
| 栾树 Koelreuteria paniculata | 1 | 38 | 27.8 | 5.0 | 16.3 | 18.0 | 5.0 | 11.2 | |
| 落羽杉 Taxodium distichum | 2 | 103 | 31.7—36.5 | 7.6—8.3 | 17.1—21 | 12.0—25.0 | 2.5—3.0 | 9.3—12.1 | |
| 马褂木 Liriodendron chinense | 1 | 105 | 25.4 | 5.2 | 14.2 | 14.0 | 5.0 | 10.8 | |
| 女贞 Ligustrum lucidum | 6 | 335 | 14.0—24.9 | 4.3—11.5 | 6.9—14.6 | 5.4—11.0 | 2.5—6.0 | 4.2—7.0 | |
| 水杉 Metasequoia glyptostroboides | 8 | 349 | 11.3—39.2 | 1.9—16.7 | 8.4—26.7 | 6.6—29.5 | 2.3—8.3 | 5.6—19.4 | |
| 喜树 Camptotheca acuminata | 2 | 71 | 21.2—24.3 | 6.3—8.2 | 14.0—17.5 | 12.5—16.5 | 2.8—7.0 | 11.0—11.9 | |
| 香樟 Cinnamomum camphora | 16 | 1053 | 18.4—42.6 | 5.0—18.8 | 11.0—26.0 | 6.3—18.0 | 1.3—8.5 | 3.8—10.7 | |
| 毛白杨 Populus tomentosa | 2 | 43 | 32.8—43.0 | 15.2—15.9 | 24.3—28.9 | 13.6—28.0 | 3.5—9.9 | 11.8—21.5 | |
| 银杏 Ginkgo biloba | 4 | 200 | 8.0—14.5 | 5.0—8.0 | 7.2—9.7 | 6.0—9.0 | 0.5—4.5 | 5.4—6.1 | |
| 广玉兰 Magnolia grandiflora | 1 | 69 | 53.0 | 6.3 | 12.1 | 14.6 | 4.0 | 9.6 | |
| 紫叶李 Prunus cerasifera | 1 | 35 | 16.1 | 5.0 | 10.0 | 8.0 | 2.9 | 5.4 | |
| 棕榈 Trachycarpus fortunei | 1 | 14 | 24.8 | 13.2 | 18.6 | 6.6 | 3.0 | 4.4 | |
| 混交林 Mixed forest | 18 | 533 | 16.4—55 | 5.1—6.5 | 10.1—19.5 | 6.5—18 | 1.1—5.5 | 3.7—9.7 | |
| 总计 Total | 74 | 3398 | 8.0—55.0 | 5.0—18.8 | 6.9—28.9 | 3.0—29.5 | 0.2—9.9 | 2.6—21.5 | |
| 上海市 Shanghai | 总计 Total | 81 | 3539 | 8.0—55 | 5.0—18.8 | 6.9—28.9 | 3.0—29.5 | 0.2—9.9 | 2.6—21.5 |
| 类型 Types | 遥感数据 Remote sensing data | 计算公式 Formula |
|---|---|---|
| 植被指数 Vegetation index | 归一化植被指数 Normalized difference vegetation index (NDVI) | |
| 比值植被指数 Simple ratio index (SRI) | Y=ρ1/ρ2 | |
| 增强植被指数 Enhanced vegetation index (EVI) | | |
| 大气阻抗植被指数 Atmospherically resistant vegetation index (ARVI) | | |
| 结构不敏感色数指数 Structure-senstitive pigment index (SIPI) | | |
| 纹理特征 Textural features | 平均值 Mean (ME) | |
| 方差 Variance (VA) | | |
| 信息熵 Entropy (EN) | | |
| 偏斜 Skewness (SK) | | |
| 数据范围 Datarange | — |
表2 植被指数及纹理参数计算方法
Table 2 Vegetation index and texture parameter calculation methods
| 类型 Types | 遥感数据 Remote sensing data | 计算公式 Formula |
|---|---|---|
| 植被指数 Vegetation index | 归一化植被指数 Normalized difference vegetation index (NDVI) | |
| 比值植被指数 Simple ratio index (SRI) | Y=ρ1/ρ2 | |
| 增强植被指数 Enhanced vegetation index (EVI) | | |
| 大气阻抗植被指数 Atmospherically resistant vegetation index (ARVI) | | |
| 结构不敏感色数指数 Structure-senstitive pigment index (SIPI) | | |
| 纹理特征 Textural features | 平均值 Mean (ME) | |
| 方差 Variance (VA) | | |
| 信息熵 Entropy (EN) | | |
| 偏斜 Skewness (SK) | | |
| 数据范围 Datarange | — |
| 种类 Species | 生物量方程 Biomass equation | 碳质量分数 Mass fraction of carbon |
|---|---|---|
| 香樟 Cinnamomum camphora | Mt =0.3455D2.0333 | 0.4433 |
| 水杉 Metasequoia glyptostroboides | Mt =0.06291D2.4841 | 0.4340 |
| 女贞 Ligustrum lucidum | Mt =0.139994D1.90957 | 0.4289 |
| 银杏 Ginkgo biloba | Mt =0.133137D2.3357 | 0.4437 |
| 杜英 Elaeocarpus sylvestri | Mt =0.18833D2.14125 | 0.4402 |
| 马褂木 Liriodendron chinense | Mt =0.06393D2.61147 | 0.4443 |
| 毛白杨 Populus tomentosa | Mt =0.01901D3.10510 | 0.4347 |
| 广玉兰 Magnolia grandiflora | Mt =0.330788D1.90957 | 0.4335 |
| 栾树 Koelreuteria bipinnata | Mt =0.10994D2.48438 | 0.4283 |
| 无患子 Sapindus saponaria | Ma=0.14119D2.35753 | 0.4359 |
| 雪松 Cedrus deodara | Mt =0.1606D2.2134 | 0.4542 |
| 毛白杨 Populus simonii | Mt =0.01901D3.10510 | 0.4347 |
| 其它软阔类 Other soft broad-leaved species | Mt =0.0275D2.8203 | 0.4850* |
| 其它硬阔类 Other hard broad-leaved species | Mt =0.2395D2.1044 | 0.4970* |
| 其他针叶类 Other conifers species | Mt =0.1606D2.2134 | 0.4542 |
表3 主要乔木树种的异速生长方程及碳质量分数
Table 3 The allometric growth equation of the main tree species
| 种类 Species | 生物量方程 Biomass equation | 碳质量分数 Mass fraction of carbon |
|---|---|---|
| 香樟 Cinnamomum camphora | Mt =0.3455D2.0333 | 0.4433 |
| 水杉 Metasequoia glyptostroboides | Mt =0.06291D2.4841 | 0.4340 |
| 女贞 Ligustrum lucidum | Mt =0.139994D1.90957 | 0.4289 |
| 银杏 Ginkgo biloba | Mt =0.133137D2.3357 | 0.4437 |
| 杜英 Elaeocarpus sylvestri | Mt =0.18833D2.14125 | 0.4402 |
| 马褂木 Liriodendron chinense | Mt =0.06393D2.61147 | 0.4443 |
| 毛白杨 Populus tomentosa | Mt =0.01901D3.10510 | 0.4347 |
| 广玉兰 Magnolia grandiflora | Mt =0.330788D1.90957 | 0.4335 |
| 栾树 Koelreuteria bipinnata | Mt =0.10994D2.48438 | 0.4283 |
| 无患子 Sapindus saponaria | Ma=0.14119D2.35753 | 0.4359 |
| 雪松 Cedrus deodara | Mt =0.1606D2.2134 | 0.4542 |
| 毛白杨 Populus simonii | Mt =0.01901D3.10510 | 0.4347 |
| 其它软阔类 Other soft broad-leaved species | Mt =0.0275D2.8203 | 0.4850* |
| 其它硬阔类 Other hard broad-leaved species | Mt =0.2395D2.1044 | 0.4970* |
| 其他针叶类 Other conifers species | Mt =0.1606D2.2134 | 0.4542 |
| 模型 Regression model | 方程 Equation | R2 | Adjusted R2 | F | Sig. |
|---|---|---|---|---|---|
| 多元逐步回归模型 Stepwise regression model | Y=2219.23-605.05x1+0.22x2+151.83x3+0.06x4 | 0.464 | 0.40 | 6.92 | 0.000 |
| 线性模型 Linear model | Y=55.40+6152.52x1 | 0.263 | 0.24 | 12.507 | 0.001 |
| 二次曲线模型 Second-order polynomial model | Y= -1007.41+14412.20x1-13681.10 | 0.286 | 0.24 | 6.809 | 0.006 |
| 三次曲线模型 Cubic curve model | Y=2717.23+136728.20x1+179080.60 | 0.365 | 0.31 | 6.332 | 0.003 |
| 复合模型 Composite model | Y=369.15×74.78x1 | 0.297 | 0.28 | 14.817 | 0.002 |
| 幂 (次方) 模型 Power index model | Y=5902.48 | 0.337 | 0.32 | 17.763 | 0.000 |
| S模型 S-Model | Y=e8.03-0.19/x1 | 0.315 | 0.30 | 16.092 | 0.000 |
| 成长模型 Growth model | Y=e5.91+4.32x1 | 0.297 | 0.28 | 14.817 | 0.000 |
| 指数模型 Exponential model | Y=369.15e4.32x1 | 0.297 | 0.30 | 14.817 | 0.000 |
| 对数模型 Logit model | Y=3980.33+1521.37lnx1 | 0.264 | 0.24 | 12.537 | 0.001 |
表4 城市森林碳储量回归模型与参数
Table 4 Regression model and parameters of urban forests carbon storage
| 模型 Regression model | 方程 Equation | R2 | Adjusted R2 | F | Sig. |
|---|---|---|---|---|---|
| 多元逐步回归模型 Stepwise regression model | Y=2219.23-605.05x1+0.22x2+151.83x3+0.06x4 | 0.464 | 0.40 | 6.92 | 0.000 |
| 线性模型 Linear model | Y=55.40+6152.52x1 | 0.263 | 0.24 | 12.507 | 0.001 |
| 二次曲线模型 Second-order polynomial model | Y= -1007.41+14412.20x1-13681.10 | 0.286 | 0.24 | 6.809 | 0.006 |
| 三次曲线模型 Cubic curve model | Y=2717.23+136728.20x1+179080.60 | 0.365 | 0.31 | 6.332 | 0.003 |
| 复合模型 Composite model | Y=369.15×74.78x1 | 0.297 | 0.28 | 14.817 | 0.002 |
| 幂 (次方) 模型 Power index model | Y=5902.48 | 0.337 | 0.32 | 17.763 | 0.000 |
| S模型 S-Model | Y=e8.03-0.19/x1 | 0.315 | 0.30 | 16.092 | 0.000 |
| 成长模型 Growth model | Y=e5.91+4.32x1 | 0.297 | 0.28 | 14.817 | 0.000 |
| 指数模型 Exponential model | Y=369.15e4.32x1 | 0.297 | 0.30 | 14.817 | 0.000 |
| 对数模型 Logit model | Y=3980.33+1521.37lnx1 | 0.264 | 0.24 | 12.537 | 0.001 |
| 项目 Content | 统计值 Statistic | 变异系数 Variable coefficient | 偏度 Skewness | 峰度 Kurtosis | |||||
|---|---|---|---|---|---|---|---|---|---|
| 样本量 Simples | 最小值 Minimum value | 最大值 Maximum value | 均值 Mean value | 中位数 Median value | 标准偏差 Standard deviation | ||||
| 样地碳储量 Carbon storage in samples | 研究区 Study area | 81 | 0.09 | 7.10 | 2.14 | 1.70 | 1.60 | 0.75 | 1.16 |
| 非主城区 Non-main city area | 75 | 0.09 | 7.10 | 2.20 | 1.75 | 1.64 | 0.75 | 1.07 | |
| 主城区 Main urban area | 6 | 0.53 | 1.90 | 1.38 | 1.47 | 0.52 | 0.75 | -0.86 | |
表5 调查样地的碳储量情况
Table 5 The carbon storage of the sampling plots
| 项目 Content | 统计值 Statistic | 变异系数 Variable coefficient | 偏度 Skewness | 峰度 Kurtosis | |||||
|---|---|---|---|---|---|---|---|---|---|
| 样本量 Simples | 最小值 Minimum value | 最大值 Maximum value | 均值 Mean value | 中位数 Median value | 标准偏差 Standard deviation | ||||
| 样地碳储量 Carbon storage in samples | 研究区 Study area | 81 | 0.09 | 7.10 | 2.14 | 1.70 | 1.60 | 0.75 | 1.16 |
| 非主城区 Non-main city area | 75 | 0.09 | 7.10 | 2.20 | 1.75 | 1.64 | 0.75 | 1.07 | |
| 主城区 Main urban area | 6 | 0.53 | 1.90 | 1.38 | 1.47 | 0.52 | 0.75 | -0.86 | |
| 多元逐步回归模型 Multiple stepwise regression model | 回归残差模型 Multiple stepwise linear regression+ordinary Kriging model | |
|---|---|---|
| 均方根误差 RMSE | 21.37% | 19.17% |
| 平均绝对误差 MAE | 15.87% | 15.00% |
表6 上海市城市森林碳储量估算模型精度验证结果
Table 6 Accuracy verification results of Shanghai urban forests carbon storage estimation model
| 多元逐步回归模型 Multiple stepwise regression model | 回归残差模型 Multiple stepwise linear regression+ordinary Kriging model | |
|---|---|---|
| 均方根误差 RMSE | 21.37% | 19.17% |
| 平均绝对误差 MAE | 15.87% | 15.00% |
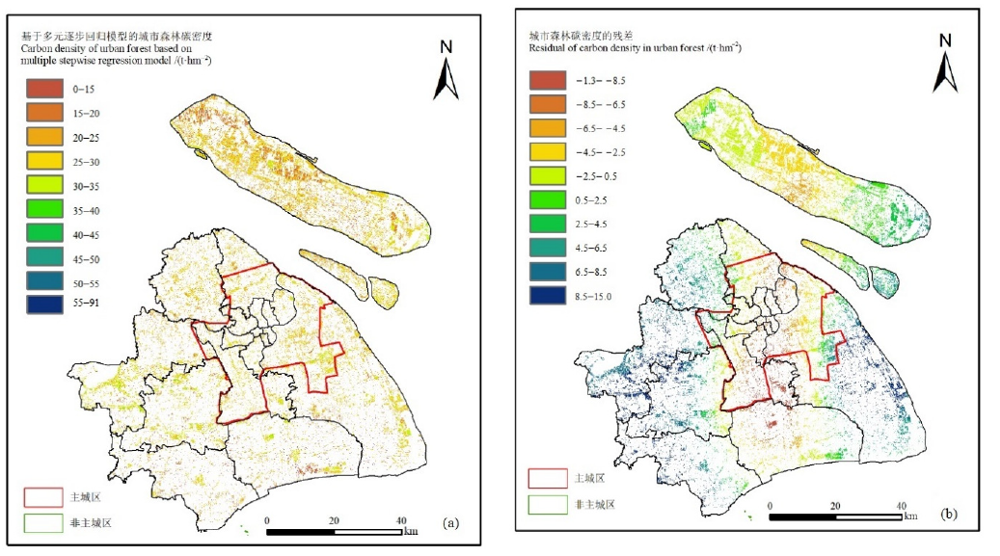
图2 多元逐步回归模型模拟结果(a)和残差空间分布图(b)
Fig. 2 Simulation results of multiple stepwise regression model (a) and spatial distribution of residuals (b)
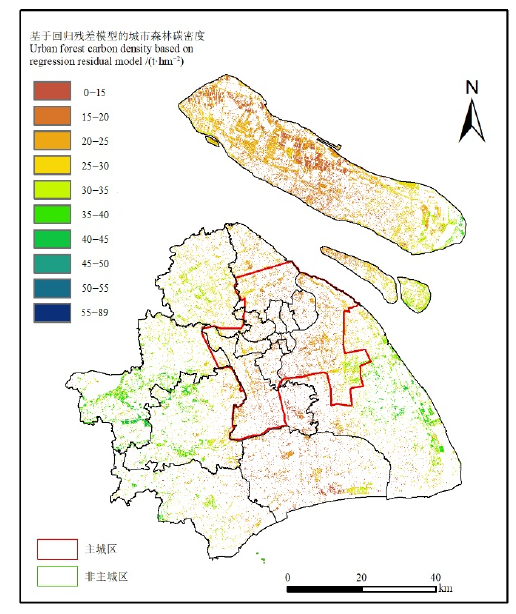
图3 上海城市森林碳密度空间分布
Fig. 3 Spatial distribution of carbon density in urban forests in Shanghai
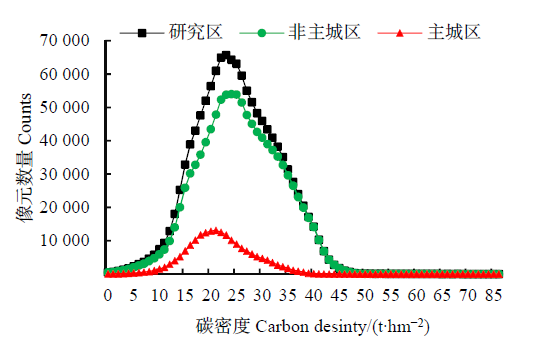
图4 上海市城市森林碳密度像元值
Fig. 4 Pixel value of urban forests carbon density in Shanghai
| [1] |
COBURN A, ROBERTS B, 2004. A multiscale texture analysis procedure for improved forest stand classification[J]. International Journal of Remote Sensing, 25(20): 4287-4308.
DOI URL |
| [2] |
DAVIES Z G, EDMONDSON J L, HEINEMEYER A, et al., 2011. Mapping an urban ecosystem service: Quantifying above-ground carbon storage at a city-wide scale[J]. Journal of Applied Ecology, 48(5): 1125-1134.
DOI URL |
| [3] |
LAL R, 2005. Forest soils and carbon sequestration[J]. Forest Ecology and Management, 220(1-3): 242-258.
DOI URL |
| [4] | LIU C F, LI X M, 2012. Carbon storage and sequestration by urban forests in Shenyang, China[J]. Urban Forestry & Urban Greening, 11(2): 121-128. |
| [5] |
LIU X P, CHO S H, ARMSWORTH P R, et al., 2021. Where and when carbon storage can be bought cost effectively from private forest owners[J]. Environmental Management, 67: 1-19.
DOI URL |
| [6] |
NOWAK D J, GREENFIELD E J, HOEHN R E, et al., 2013. Carbon storage and sequestration by trees in urban and community areas of the United States[J]. Environmental Pollution, 178: 229-236.
DOI URL |
| [7] |
PEREIRA P, OLIVA M, BALTRENAITE E, 2010. Modelling extreme precipitation in hazardous mountainous areas. Contribution to landscape planning and environmental management[J]. Journal of Environmental Engineering and Landscape Management, 18(4): 329-342.
DOI URL |
| [8] |
POORAZIMY M, SHATAEE S, MCROBERTS R E, et al., 2020. Integrating airborne laser scanning data, space-borne radar data and digital aerial imagery to estimate aboveground carbon stock in Hyrcanian forests, Iran[J]. Remote Sensing of Environment, DOI: 10.1016/j.rse.2020.111669.
DOI |
| [9] | SCHLESINGER W H, 1991. Biogeochemistry: An Analysis of Global Change[M]. California: Academic Press Inc. |
| [10] |
SHEN G R, WANG Z J, LIU C J, et al., 2020. Mapping aboveground biomass and carbon in Shanghai's urban forest using Landsat ETM+ and inventory data[J]. Urban Forestry & Urban Greening, DOI: 10.1016/j.ufug.2020.126655.
DOI |
| [11] |
SVIREJEVA-HOPKINS A, SCHELLNHUBER H J, 2006. Modelling carbon dynamics from urban land conversion: Fundamental model of city in relation to a local carbon cycle[J]. Carbon Balance and Management, 1(1): 1-9.
DOI URL |
| [12] | 曹庆先, 徐大平, 鞠洪波, 2011. 基于TM影像纹理与光谱特征和KNN方法估算5种红树林群落生物量[J]. 林业科学研究, 24(2): 144-150. |
| CAO Q X, XU D P, JU H B, 2011. Biomass estimation of five kinds of mangrove community with the KNN method based on the spectral information and textural features of TM images[J]. Forest Research, 24(2): 144-150. | |
| [13] | 陈科屹, 刘润华, 张博, 等, 2021. 武汉市环城林带森林碳储量及其动态变化[J]. 水土保持研究, 28(2): 54-59, 66. |
| CHEN K Y, LIU R H, ZHANG B, et al., 2021. Forest carbon storage and its dynamic change in the city-encircling forest belt of Wuhan city[J]. Research of Soil and Water Conservation, 28(2): 54-59, 66. | |
| [14] | 徐飞, 刘为华, 任文玲, 等, 2010. 上海城市森林群落结构对固碳能力的影响[J]. 生态学杂志, 29(3): 439-447. |
| XU F, LIU W H, REN W L, et al., 2010. Effects of community structure on carbon fixation of urban forests in Shanghai, China[J]. Chinese Journal of Ecology, 29(3): 439-447. | |
| [15] | 徐飞, 2010. 上海城市森林群落结构特征与固碳能力研究[D]. 上海: 华东师范大学. |
| XU F, 2010. Study on community structure and carbon fixation of urban forest in Shanghai, China[D]. Shanghai: East China Normal University. | |
| [16] | 黄宇, 冯宗炜, 汪思龙, 等, 2005. 杉木、火力楠纯林及其混交林生态系统C、N贮量[J]. 生态学报, 25(12): 3146-3154. |
| HUANG Y, FENG Z W, WANG S L, et al., 2005. C and N stocks under three plantation forest ecosystems of Chinese-fir, Michelia macclurei and their mixture[J]. Acta Ecologica Sinica, 25(12): 3146-3154. | |
| [17] | 郭雪艳, 2017. 上海城市森林多尺度生态质量评价研究[D]. 上海: 华东师范大学. |
| GUO X Y, 2017. Multi-scale assessments on ecological quality of urban forest in Shanghai[D]. Shanghai: East China Normal University. | |
| [18] | 候勃, 岳文泽, 王腾飞, 2020. 中国大都市区碳排放时空异质性探测与影响因素--以上海市为例[J]. 经济地理, 40(9): 82-90. |
|
HOU B, YUE W Z, WANG T F, 2020. Spatiotemporal heterogeneity pattern and influencing factors of carbon emission in metropolitan areas of China: A Case of Shanghai[J]. Economic Geography, 40(9): 82-90.
DOI URL |
|
| [19] | 胡鞍钢, 2021. 中国实现2030年前碳达峰目标及主要途径[J]. 北京工业大学学报(社会科学版), 21(3): 1-15. |
| HU A G, 2021. China's Goal of Achieving Carbon Peak by 2030 and Its Main Approaches[J]. Journal of Beijing University of Technology (Social Sciences Edition), 21(3): 1-15. | |
| [20] | 孔蕊, 张增信, 张凤英, 等, 2020. 长江流域森林碳储量的时空变化及其驱动因素分析[J]. 水土保持研究, 27(4): 60-66. |
| KONG R, ZHANG Z X, ZHANG F Y, et al., 2020. Spatial and temporal dynamics of forest carbon storage and its driving factors in the Yangtze River basin[J]. Research of Soil and Water Conservation, 27(4): 60-66. | |
| [21] | 马涛, 2011. 上海林地和绿地碳汇发展困境与对策[J]. 中国城市林业, 9(2): 23-25. |
| MA T, 2011. Development dilemma and countermeasures of carbon sequestration in forest land and green land in Shanghai[J]. Journal of Chinese Urban Forestry, 9(2): 23-25. | |
| [22] | 马想, 张浪, 黄绍敏, 等, 2020. 上海城市绿地土壤肥力变化分析[J]. 中国园林, 36(5): 104-109. |
| MA X, ZHANG L, HUANG S M, et al., 2020. Analysis on the change of soil fertility in Shanghai urban green space[J]. Chinese Landscape Architecture, 36(5): 104-109. | |
| [23] | 毛齐正, 黄甘霖, 邬建国, 2015. 城市生态系统服务研究综述[J]. 应用生态学报, 26(4): 1023-1033. |
| MAO Q Z, HUANG G L, WU J G, 2015. Urban ecosystem services: A review[J]. Chinese Journal of Applied Ecology, 26(4): 1023-1033. | |
| [24] | 上海市人民政府, 2018. 上海市城市总体规划(2017-2035年)[R/OL]. (2018-01) [2021-06-05]. https://www.shanghai.gov.cn/nw42806/index.html. |
| Shanghai Municipal People's Government, 2018. Shanghai urban master plan (2017-2035)[R/OL]. (2018-01) [2021-06-05]. https://www.shanghai.gov.cn/nw42806/index.html. | |
| [25] | 汤浩藩, 许彦红, 艾建林, 2019. 云南省森林植被碳储量和碳密度及其空间分布格局[J]. 林业资源管理 (5): 37-43. |
| TANG H F, XU Y H, AI J L, 2019. Carbon storage and carbon density of forest vegetation and their spatial distribution pattern in Yunnan Province[J]. Forest Resources Management (5): 37-43. | |
| [26] | 汤煜, 石铁矛, 卜英杰, 等, 2020. 城市绿地碳储量估算及空间分布特征[J]. 生态学杂志, 39(4): 1387-1398. |
| TANG Y, SHI T M, BU Y J, et al., 2020. Estimation and spatial distribution of carbon storage in urban greenspace[J]. Chinese Journal of Ecology, 39(4): 1387-1398. | |
| [27] | 王瑞静, 赵敏, 高峻, 2011. 城市森林主要植被类型碳储量研究--以崇明岛为例[J]. 地理科学, 31(4): 490-494. |
| WANG R J, ZHAO M, GAO J, 2011. Carbon storage of main vegetation types of urban forest, Chongming island of China[J]. Scientia Geographica Sinica, 31(4): 490-494. | |
| [28] | 王琰, 2019. 吕梁山森林生态系统碳密度及空间分布格局[D]. 太原: 山西大学. |
| WANG Y, 2019. Carbon density and spatial distribution pattern of forest ecosystem in the Lüliang Mountains, China[D]. Taiyuan: Shanxi University. | |
| [29] | 王紫君, 申广荣, 朱赟, 等, 2016a. 基于遥感和空间分析的上海城市森林生物量分布特征[J]. 植物生态学报, 40(4): 385-394. |
|
WANG Z J, SHEN G R, ZHU Y, et al., 2016a. Research on characteristics of biomass distribution in urban forests of Shanghai metropolis based on remote sensing and spatial analysis[J]. Chinese Journal of Plant Ecology, 40(4): 385-394.
DOI URL |
|
| [30] | 王紫君, 申广荣, 朱赟, 等, 2016b. 上海城市森林叶生物量遥感监测[J]. 生态学杂志, 35(5): 1308-1315. |
| WANG Z J, SHEN G R, ZHU Y, et al., 2016b. Remote-sensing monitoring of urban forest leaf biomass in Shanghai[J]. Chinese Journal of Ecology, 35(5): 1308-1315. | |
| [31] | 徐丽华, 张结存, 黄博, 等, 2014. 基于QuickBird影像的城市森林碳储量遥感估测[J]. 应用生态学报, 25(10): 2787-2793. |
| XU L H, ZHANG J C, HUANG B, et al., 2014. Remote sensing estimation of urban forest carbon stocks based on QuickBird images[J]. Chinese Journal of Applied Ecology, 25(10): 2787-2793. | |
| [32] | 易扬, 张桂莲, 张浪, 等, 2020. 基于高分二号遥感影像的城市植被三维绿量研究[J]. 园林 (11): 2-7. |
| YI Y, ZHANG G L, ZHANG L, et al., 2020. Research of 3D Green Quantity of Urban Vegetation Based on GF-2 Remote Sensing Image[J]. Landscape Architecture (11): 2-7. | |
| [33] | 易扬, 胡昕利, 史明昌, 等, 2021. 基于MODIS NDVI的长江中游区域植被动态及与气候因子的关系[J]. 生态学报, 41(19): 7796-7807. |
| YI Y, HU X L, SHI M C, et al., 2021. Vegetation dynamics and its relationship with climate factors in the middle reaches of the Yangtze River based on MODIS NDVI[J]. Acta Ecologica Sinica, 41(19): 7796-7807. | |
| [34] | 张浪, 2020. 城市困难立地概念及其分类辨析[J]. 上海建设科技 (3): 107-109. |
| ZHANG L, 2020. Concept and Classification of Urban Difficult Sites[J]. Shanghai Construction Science & Technology (3): 107-109. | |
| [35] | 张希金, 冷寒冰, 赵广琦, 等, 2018. 上海4种常见绿化树种地上生物量模型构建[J]. 南京林业大学学报 (自然科学版), 42(2): 141-146. |
| ZHANG X J, LENG H B, ZHAO G Q, et al., 2018. Allometric models for estimating aboveground biomass for four common greening tree species in Shanghai City, China[J]. Journal of Nanjing Forestry University (Natural Sciences Edition), 42(2): 141-146. | |
| [36] | 张永生, 巢清尘, 陈迎, 等, 2021. 中国碳中和: 引领全球气候治理和绿色转型[J/OL]. 国际经济评论 (3): 9-26, 4. |
| ZHANG Y S, CHAO Q C, CHEN Y, et al., 2021. China's carbon neutralization: leading global climate governance and green transformation[J/OL]. International Economic Review (3): 9-26, 4. | |
| [37] | 中国环境网, 2021. 构建公园城市提供精致生态空间, 上海森林覆盖率达18.49% [EB/OL]. (2021-01) [2021-06-05]. https://www.cenews.com.cn/newpos/sh/yj/202101/t20210120_968485.html. |
| China Environment Network, 2021. Build a park city and provide exquisite ecological space. The forest coverage rate of Shanghai reaches 18.49% [EB/OL]. (2021-01) [2021-06-05]. https://www.cenews.com.cn/newpos/sh/yj/202101/t20210120_968485.html. | |
| [38] | 中华人民共和国中央人民政府, 2020. 继往开来, 开启全球应对气候变化新征程--在气候雄心峰会上的讲话[EB/OL]. (2020-12-12) [2021-06-05]. http://www.gov.cn/gongbao/content/2020/content_5570055.html. |
| The Central People's Government of the people's Republic of China, 2020. Carrying forward the past and forging ahead into the future and opening a new journey in global response to climate change-Speech at the climate ambition summit[EB/OL] (2020-12-12) [2021-06-05]. http://www.gov.cn/gongbao/content/2020/content_5570055.html. | |
| [39] | 中华人民共和国住房和城乡建设部, 2019. 2019年城市建设统计年鉴[M/OL]. (2020-12-31) [2021-06-05]. http://www.mohurd.gov.cn/xytj/index.html. |
| Ministry of Housing and Urban-Rural Development of the People's Republic of China, 2019. Statistical yearbook of urban construction in 2019[M/OL]. http://www.mohurd.gov.cn/xytj/index.html. | |
| [40] | 仲启铖, 傅煜, 张桂莲, 2019. 上海市乔木林生物量估算及动态分析[J]. 浙江农林大学学报, 36(3): 524-532. |
| ZHONG Q C, FU Y, ZHANG G L, 2019. Biomass estimation and dynamic analysis of arbor forest in Shanghai[J]. Journal of Zhejiang A & F University, 36(3): 524-532. | |
| [41] | 周健, 肖荣波, 庄长伟, 等, 2013. 城市森林碳汇及其抵消能源碳排放效果--以广州为例[J]. 生态学报, 33(18): 5865-5873. |
|
ZHOU J, XIAO R B, ZHUANG C W, et al., 2013. The carbon sink of urban forests and efficacy on offsetting energy carbon emissions from city in Guangzhou[J]. Acta Ecologica Sinica, 33(18): 5865-5873.
DOI URL |
| [1] | 王成武, 罗俊杰, 唐鸿湖. 基于InVEST模型的太行山沿线地区生态系统碳储量时空分异驱动力分析[J]. 生态环境学报, 2023, 32(2): 215-225. |
| [2] | 陈治中, 昝梅, 杨雪峰, 董煜. 新疆森林植被碳储量预测研究[J]. 生态环境学报, 2023, 32(2): 226-234. |
| [3] | 贾志峰, 刘鹏程, 刘宇, 吴博博, 陈丹姿, 张向飞. 气候变化和人类活动对松辽流域植被覆盖的影响[J]. 生态环境学报, 2023, 32(1): 1-10. |
| [4] | 陈科屹, 王建军, 何友均, 张立文. 黑龙江大兴安岭重点国有林区森林碳储量及固碳潜力评估[J]. 生态环境学报, 2022, 31(9): 1725-1734. |
| [5] | 吴胜义, 王飞, 徐干君, 马浩, 党禹杰, 吴菲. 川西北高山峡谷区森林碳储量及空间分布研究--以四川洛须自然保护区为例[J]. 生态环境学报, 2022, 31(9): 1735-1744. |
| [6] | 王超越, 郭先华, 郭莉, 白丽芳, 夏利林, 王春博, 李廷真. 基于FLUS-InVEST的西北地区土地利用变化及其对碳储量的影响——以呼包鄂榆城市群为例[J]. 生态环境学报, 2022, 31(8): 1667-1679. |
| [7] | 杜雪, 王海燕, 邹佳何, 孟海, 赵晗, 崔雪, 董齐琪. 长白山北坡云冷杉阔叶混交林土壤有机碳分布特征及其影响因素[J]. 生态环境学报, 2022, 31(4): 663-669. |
| [8] | 何亚婷, 谢和生, 何友均. 不同经营模式对蒙古栎天然次生林碳储量的影响[J]. 生态环境学报, 2022, 31(2): 215-223. |
| [9] | 肖军, 雷蕾, 曾立雄, 李肇晨, 马成功, 肖文发. 不同经营模式对华北油松人工林碳储量的影响[J]. 生态环境学报, 2022, 31(11): 2134-2142. |
| [10] | 余玉洋, 宋丰艺, 张世杰. 2000—2020年河南省NDVI时空变化及其驱动因素定量分析[J]. 生态环境学报, 2022, 31(10): 1939-1950. |
| [11] | 陈步峰, 王莘仪, 肖以华, 吴巧花. 广州城市森林及不同地表垫面对暴雨径流与PAHs、TOC的影响[J]. 生态环境学报, 2021, 30(9): 1865-1878. |
| [12] | 李少宁, 赵旭, 王君怡, 鲁绍伟, 赵娜, 徐晓天. 北京西山国家森林公园空气负离子与NOx浓度动态特征分析[J]. 生态环境学报, 2021, 30(8): 1654-1661. |
| [13] | 他维媛, 康桢, 孟昭君, 金盛华, 杨幸, 郭龙飞, 赵东旭, 张馨. 秦岭典型停产关闭锌冶炼企业场地土壤重金属污染特征研究[J]. 生态环境学报, 2021, 30(7): 1513-1521. |
| [14] | 侯素霞, 张鉴达, 李静. 上海市大气污染物时空分布及其相关性因子分析[J]. 生态环境学报, 2021, 30(6): 1220-1228. |
| [15] | 张静, 杜加强, 盛芝露, 张杨成思, 吴金华, 刘博. 1982—2015年黄河流域植被NDVI时空变化及影响因素分析[J]. 生态环境学报, 2021, 30(5): 929-937. |
| 阅读次数 | ||||||
|
全文 |
|
|||||
|
摘要 |
|
|||||