
Ecology and Environmental Sciences ›› 2026, Vol. 35 ›› Issue (10): 1509-1521.DOI: 10.16258/j.cnki.1674-5906.2026.10.002
• Research Article [Ecology] • Previous Articles Next Articles
Jiang Yu( ), Yin Jianhui*()
Received:2026-04-13
Revised:2026-08-13
Accepted:2026-09-04
Online:2026-10-18
Published:2026-10-21
姜钰(), 尹建辉*()
通讯作者:
E-mail: 作者简介:姜钰(1978年生),女,教授,博士,博士研究生导师,主要从事森林生态产业研究。E-mail: jiangy_lj@nefu.edu.cn
基金资助:CLC Number:
Jiang Yu, Yin Jianhui. Factors and Mechanisms Influencing the High-Quality Development of Forest Ecosystems in the Context of Smart Forestry[J]. Ecology and Environmental Sciences, 2026, 35(10): 1509-1521.
姜钰, 尹建辉. 智慧林业背景下森林生态系统高质量发展影响因素及机制[J]. 生态环境学报, 2026, 35(10): 1509-1521.
Add to citation manager EndNote|Ris|BibTeX
URL: https://www.jeesci.com/EN/10.16258/j.cnki.1674-5906.2026.10.002
| 一级指标 | 指标符号 | 二级指标 | 指标符号 | 指标测量 | 指标权重 |
|---|---|---|---|---|---|
| 经济子系统 | ECS | 林业产值 | FOV | 林业年人均产值(元/人) | 0.0388 |
| 森林旅游 | FT | 森林旅游年人均花费(元/人) | 0.0431 | ||
| 林业产业结构升级 | FISR | 林业产业结构高级化 | 0.0473 | ||
| 社会子系统 | SS | 人力资本质量 | HCQ | 农村劳动力人均受教育年限(a) | 0.0487 |
| 人力资本结构 | HCS | 大专及以上农村劳动力占比(%) | 0.0450 | ||
| 林业工资水平 | FWL | 林业系统在岗年人均工资水平(元) | 0.0445 | ||
| 技术子系统 | TS | 林业科研投入 | FRI | 林业R&D研发经费内部支出(万元) | 0.0378 |
| 林业科研成果 | FRA | 林业专利公开量(个) | 0.0403 | ||
| 生态技术扩散 | ETD | 林业绿色全要素生产率 | 0.0384 | ||
| 自动化 | AUT | 工业机器人安装密度(台) | 0.0357 | ||
| 智能化 | INT | 当年授权的人工智能发明数量(个) | 0.0314 | ||
| 资源子系统 | RS | 林地面积 | FA | 人均林地面积(公顷/人) | 0.0400 |
| 森林数量 | FN | 森林覆盖率(%) | 0.0464 | ||
| 森林质量 | FQ | 森林蓄积量(104 m3) | 0.0404 | ||
| 环境子系统 | ENS | 气体调节 | GA | 气体调节人均价值(元/人) | 0.0395 |
| 气候调节 | CA | 气候调节人均价值(元/人) | 0.0395 | ||
| 净化环境 | PE | 森林净化环境人均价值(元/人) | 0.0394 | ||
| 水文调节 | HR | 森林水文调节人均价值(元/人) | 0.0392 | ||
| 土壤保持 | SC | 森林土壤保持人均价值(元/人) | 0.0395 | ||
| 维持养分循环 | MNC | 森林维持养分循环人均价值(元/人) | 0.0395 | ||
| 维持生物性 | MBP | 森林维持生物性人均价值(元/人) | 0.0395 | ||
| 林业废水治理 | FWT | 林业废水化学需氧量(t) | 0.0490 | ||
| 林业固体废物治理 | FSWM | 林业固体废物产生量(t) | 0.0492 | ||
| 林业SO2治理 | FSO2C | 林业SO2排放量(t) | 0.0481 |
Table 1 Indicator system for level of high-quality development of forest ecosystems
| 一级指标 | 指标符号 | 二级指标 | 指标符号 | 指标测量 | 指标权重 |
|---|---|---|---|---|---|
| 经济子系统 | ECS | 林业产值 | FOV | 林业年人均产值(元/人) | 0.0388 |
| 森林旅游 | FT | 森林旅游年人均花费(元/人) | 0.0431 | ||
| 林业产业结构升级 | FISR | 林业产业结构高级化 | 0.0473 | ||
| 社会子系统 | SS | 人力资本质量 | HCQ | 农村劳动力人均受教育年限(a) | 0.0487 |
| 人力资本结构 | HCS | 大专及以上农村劳动力占比(%) | 0.0450 | ||
| 林业工资水平 | FWL | 林业系统在岗年人均工资水平(元) | 0.0445 | ||
| 技术子系统 | TS | 林业科研投入 | FRI | 林业R&D研发经费内部支出(万元) | 0.0378 |
| 林业科研成果 | FRA | 林业专利公开量(个) | 0.0403 | ||
| 生态技术扩散 | ETD | 林业绿色全要素生产率 | 0.0384 | ||
| 自动化 | AUT | 工业机器人安装密度(台) | 0.0357 | ||
| 智能化 | INT | 当年授权的人工智能发明数量(个) | 0.0314 | ||
| 资源子系统 | RS | 林地面积 | FA | 人均林地面积(公顷/人) | 0.0400 |
| 森林数量 | FN | 森林覆盖率(%) | 0.0464 | ||
| 森林质量 | FQ | 森林蓄积量(104 m3) | 0.0404 | ||
| 环境子系统 | ENS | 气体调节 | GA | 气体调节人均价值(元/人) | 0.0395 |
| 气候调节 | CA | 气候调节人均价值(元/人) | 0.0395 | ||
| 净化环境 | PE | 森林净化环境人均价值(元/人) | 0.0394 | ||
| 水文调节 | HR | 森林水文调节人均价值(元/人) | 0.0392 | ||
| 土壤保持 | SC | 森林土壤保持人均价值(元/人) | 0.0395 | ||
| 维持养分循环 | MNC | 森林维持养分循环人均价值(元/人) | 0.0395 | ||
| 维持生物性 | MBP | 森林维持生物性人均价值(元/人) | 0.0395 | ||
| 林业废水治理 | FWT | 林业废水化学需氧量(t) | 0.0490 | ||
| 林业固体废物治理 | FSWM | 林业固体废物产生量(t) | 0.0492 | ||
| 林业SO2治理 | FSO2C | 林业SO2排放量(t) | 0.0481 |
| 年份 | 整体基尼系数 | 区域内基尼系数 | 区域间基尼系数 | 贡献率 | ||||||||||||
|---|---|---|---|---|---|---|---|---|---|---|---|---|---|---|---|---|
| 东部 | 中部 | 西部 | 东北部 | 东-中 | 东-西 | 东-东北 | 中-西 | 中-东北 | 西-东北 | 区域内 | 区域间 | 超变密度 | ||||
| 2005 | 0.058 | 0.036 | 0.032 | 0.074 | 0.047 | 0.035 | 0.058 | 0.051 | 0.062 | 0.055 | 0.076 | 28.132 | 33.138 | 38.730 | ||
| 2006 | 0.080 | 0.035 | 0.039 | 0.100 | 0.051 | 0.037 | 0.078 | 0.061 | 0.085 | 0.074 | 0.111 | 24.946 | 35.046 | 40.008 | ||
| 2007 | 0.071 | 0.051 | 0.045 | 0.079 | 0.072 | 0.051 | 0.068 | 0.068 | 0.070 | 0.075 | 0.087 | 27.573 | 28.211 | 44.216 | ||
| 2008 | 0.077 | 0.056 | 0.043 | 0.088 | 0.065 | 0.054 | 0.077 | 0.071 | 0.076 | 0.070 | 0.097 | 27.209 | 25.208 | 47.583 | ||
| 2009 | 0.084 | 0.062 | 0.049 | 0.100 | 0.091 | 0.059 | 0.086 | 0.074 | 0.086 | 0.077 | 0.106 | 28.367 | 19.641 | 51.992 | ||
| 2010 | 0.087 | 0.066 | 0.042 | 0.102 | 0.072 | 0.060 | 0.088 | 0.082 | 0.086 | 0.078 | 0.108 | 27.450 | 26.256 | 46.294 | ||
| 2011 | 0.095 | 0.069 | 0.060 | 0.108 | 0.108 | 0.069 | 0.094 | 0.086 | 0.095 | 0.095 | 0.115 | 27.867 | 23.862 | 48.272 | ||
| 2012 | 0.117 | 0.092 | 0.070 | 0.124 | 0.115 | 0.092 | 0.112 | 0.112 | 0.111 | 0.122 | 0.136 | 27.024 | 31.886 | 41.090 | ||
| 2013 | 0.106 | 0.071 | 0.053 | 0.116 | 0.124 | 0.069 | 0.100 | 0.104 | 0.101 | 0.118 | 0.132 | 26.075 | 31.854 | 42.072 | ||
| 2014 | 0.098 | 0.091 | 0.053 | 0.089 | 0.136 | 0.085 | 0.092 | 0.109 | 0.085 | 0.108 | 0.105 | 26.868 | 24.768 | 48.363 | ||
| 2015 | 0.098 | 0.071 | 0.046 | 0.106 | 0.120 | 0.072 | 0.093 | 0.093 | 0.094 | 0.104 | 0.117 | 26.718 | 30.624 | 42.658 | ||
| 2016 | 0.106 | 0.079 | 0.048 | 0.124 | 0.097 | 0.078 | 0.106 | 0.094 | 0.108 | 0.099 | 0.128 | 27.698 | 32.394 | 39.908 | ||
| 2017 | 0.088 | 0.086 | 0.052 | 0.073 | 0.092 | 0.083 | 0.082 | 0.098 | 0.072 | 0.098 | 0.088 | 25.737 | 36.087 | 38.176 | ||
| 2018 | 0.082 | 0.071 | 0.042 | 0.089 | 0.082 | 0.066 | 0.082 | 0.079 | 0.079 | 0.076 | 0.093 | 28.063 | 29.062 | 42.875 | ||
| 2019 | 0.088 | 0.065 | 0.042 | 0.103 | 0.079 | 0.067 | 0.089 | 0.073 | 0.089 | 0.079 | 0.105 | 27.561 | 37.690 | 34.750 | ||
| 2020 | 0.088 | 0.082 | 0.055 | 0.094 | 0.093 | 0.076 | 0.089 | 0.089 | 0.084 | 0.084 | 0.098 | 28.843 | 22.734 | 48.422 | ||
| 2021 | 0.093 | 0.088 | 0.053 | 0.100 | 0.080 | 0.078 | 0.096 | 0.094 | 0.088 | 0.080 | 0.102 | 28.798 | 15.817 | 55.385 | ||
| 2022 | 0.083 | 0.074 | 0.060 | 0.086 | 0.091 | 0.071 | 0.082 | 0.083 | 0.080 | 0.084 | 0.092 | 28.480 | 16.627 | 54.893 | ||
| 2023 | 0.079 | 0.070 | 0.050 | 0.086 | 0.077 | 0.065 | 0.080 | 0.079 | 0.077 | 0.074 | 0.089 | 28.664 | 15.032 | 56.304 | ||
| 2024 | 0.083 | 0.076 | 0.061 | 0.087 | 0.078 | 0.072 | 0.083 | 0.083 | 0.080 | 0.080 | 0.091 | 28.736 | 14.149 | 57.114 | ||
Table 2 Regional variations and decomposition of level of high-quality development in forest ecosystems
| 年份 | 整体基尼系数 | 区域内基尼系数 | 区域间基尼系数 | 贡献率 | ||||||||||||
|---|---|---|---|---|---|---|---|---|---|---|---|---|---|---|---|---|
| 东部 | 中部 | 西部 | 东北部 | 东-中 | 东-西 | 东-东北 | 中-西 | 中-东北 | 西-东北 | 区域内 | 区域间 | 超变密度 | ||||
| 2005 | 0.058 | 0.036 | 0.032 | 0.074 | 0.047 | 0.035 | 0.058 | 0.051 | 0.062 | 0.055 | 0.076 | 28.132 | 33.138 | 38.730 | ||
| 2006 | 0.080 | 0.035 | 0.039 | 0.100 | 0.051 | 0.037 | 0.078 | 0.061 | 0.085 | 0.074 | 0.111 | 24.946 | 35.046 | 40.008 | ||
| 2007 | 0.071 | 0.051 | 0.045 | 0.079 | 0.072 | 0.051 | 0.068 | 0.068 | 0.070 | 0.075 | 0.087 | 27.573 | 28.211 | 44.216 | ||
| 2008 | 0.077 | 0.056 | 0.043 | 0.088 | 0.065 | 0.054 | 0.077 | 0.071 | 0.076 | 0.070 | 0.097 | 27.209 | 25.208 | 47.583 | ||
| 2009 | 0.084 | 0.062 | 0.049 | 0.100 | 0.091 | 0.059 | 0.086 | 0.074 | 0.086 | 0.077 | 0.106 | 28.367 | 19.641 | 51.992 | ||
| 2010 | 0.087 | 0.066 | 0.042 | 0.102 | 0.072 | 0.060 | 0.088 | 0.082 | 0.086 | 0.078 | 0.108 | 27.450 | 26.256 | 46.294 | ||
| 2011 | 0.095 | 0.069 | 0.060 | 0.108 | 0.108 | 0.069 | 0.094 | 0.086 | 0.095 | 0.095 | 0.115 | 27.867 | 23.862 | 48.272 | ||
| 2012 | 0.117 | 0.092 | 0.070 | 0.124 | 0.115 | 0.092 | 0.112 | 0.112 | 0.111 | 0.122 | 0.136 | 27.024 | 31.886 | 41.090 | ||
| 2013 | 0.106 | 0.071 | 0.053 | 0.116 | 0.124 | 0.069 | 0.100 | 0.104 | 0.101 | 0.118 | 0.132 | 26.075 | 31.854 | 42.072 | ||
| 2014 | 0.098 | 0.091 | 0.053 | 0.089 | 0.136 | 0.085 | 0.092 | 0.109 | 0.085 | 0.108 | 0.105 | 26.868 | 24.768 | 48.363 | ||
| 2015 | 0.098 | 0.071 | 0.046 | 0.106 | 0.120 | 0.072 | 0.093 | 0.093 | 0.094 | 0.104 | 0.117 | 26.718 | 30.624 | 42.658 | ||
| 2016 | 0.106 | 0.079 | 0.048 | 0.124 | 0.097 | 0.078 | 0.106 | 0.094 | 0.108 | 0.099 | 0.128 | 27.698 | 32.394 | 39.908 | ||
| 2017 | 0.088 | 0.086 | 0.052 | 0.073 | 0.092 | 0.083 | 0.082 | 0.098 | 0.072 | 0.098 | 0.088 | 25.737 | 36.087 | 38.176 | ||
| 2018 | 0.082 | 0.071 | 0.042 | 0.089 | 0.082 | 0.066 | 0.082 | 0.079 | 0.079 | 0.076 | 0.093 | 28.063 | 29.062 | 42.875 | ||
| 2019 | 0.088 | 0.065 | 0.042 | 0.103 | 0.079 | 0.067 | 0.089 | 0.073 | 0.089 | 0.079 | 0.105 | 27.561 | 37.690 | 34.750 | ||
| 2020 | 0.088 | 0.082 | 0.055 | 0.094 | 0.093 | 0.076 | 0.089 | 0.089 | 0.084 | 0.084 | 0.098 | 28.843 | 22.734 | 48.422 | ||
| 2021 | 0.093 | 0.088 | 0.053 | 0.100 | 0.080 | 0.078 | 0.096 | 0.094 | 0.088 | 0.080 | 0.102 | 28.798 | 15.817 | 55.385 | ||
| 2022 | 0.083 | 0.074 | 0.060 | 0.086 | 0.091 | 0.071 | 0.082 | 0.083 | 0.080 | 0.084 | 0.092 | 28.480 | 16.627 | 54.893 | ||
| 2023 | 0.079 | 0.070 | 0.050 | 0.086 | 0.077 | 0.065 | 0.080 | 0.079 | 0.077 | 0.074 | 0.089 | 28.664 | 15.032 | 56.304 | ||
| 2024 | 0.083 | 0.076 | 0.061 | 0.087 | 0.078 | 0.072 | 0.083 | 0.083 | 0.080 | 0.080 | 0.091 | 28.736 | 14.149 | 57.114 | ||

Figure 1 Evolution of the spatial distribution of level of high-quality development in forest ecosystems
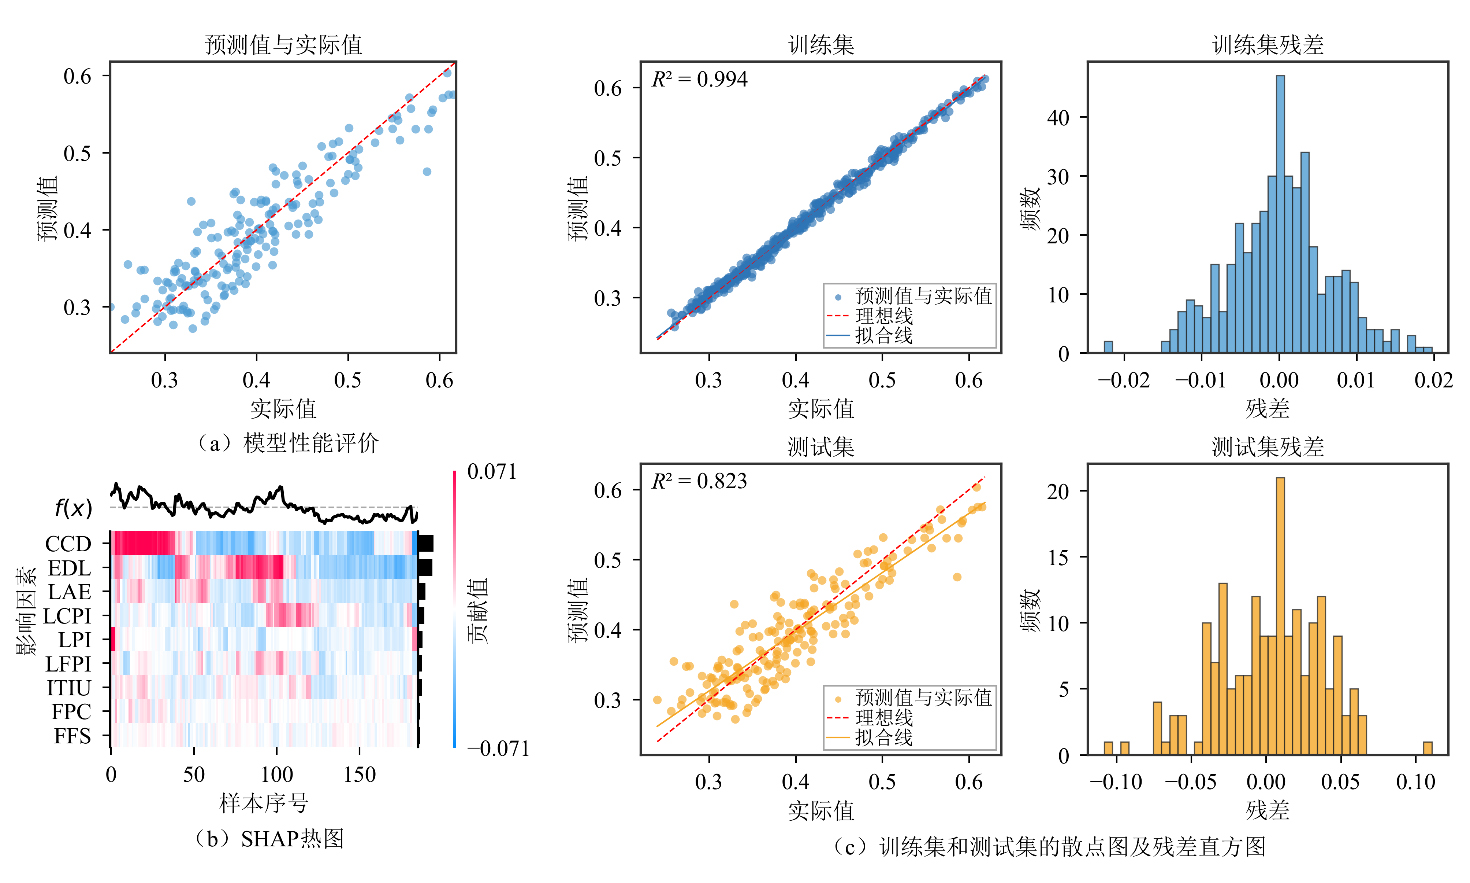
Figure 2 Performance evaluation of the XGBoost-SHAP model
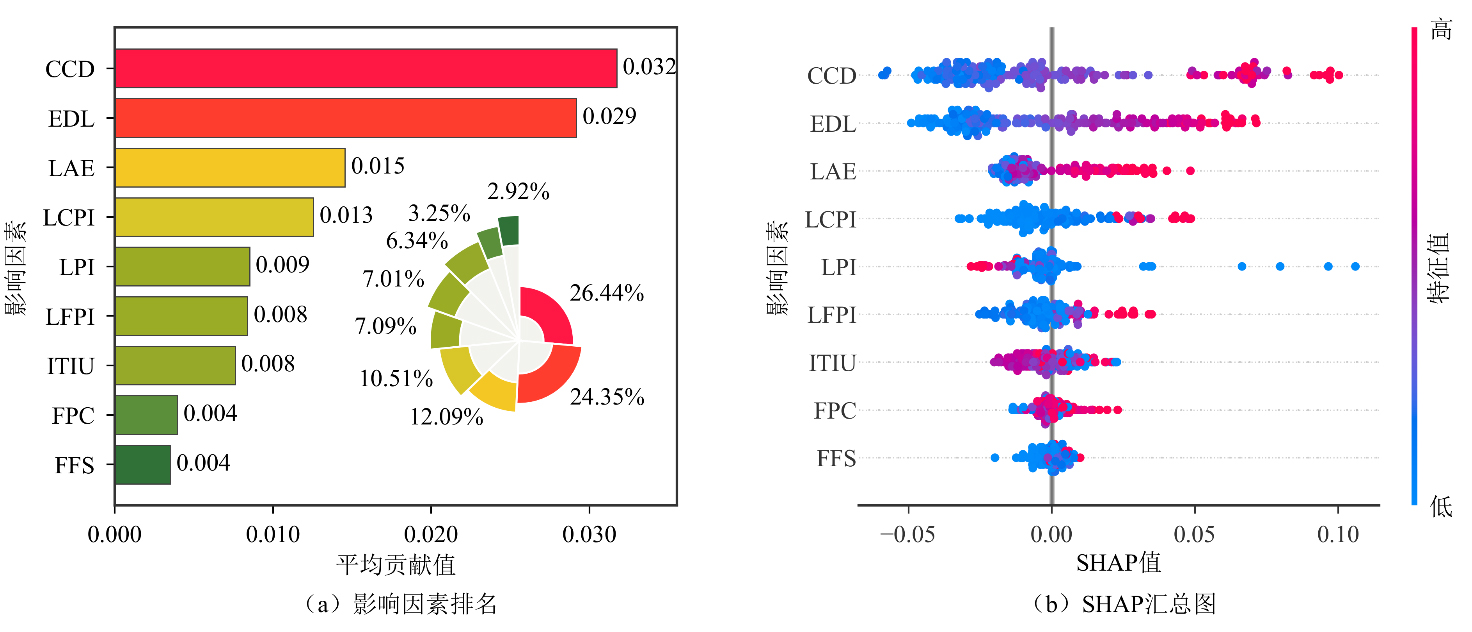
Figure 3 Ranking of the importance of influencing factors based on XGBoost-SHAP
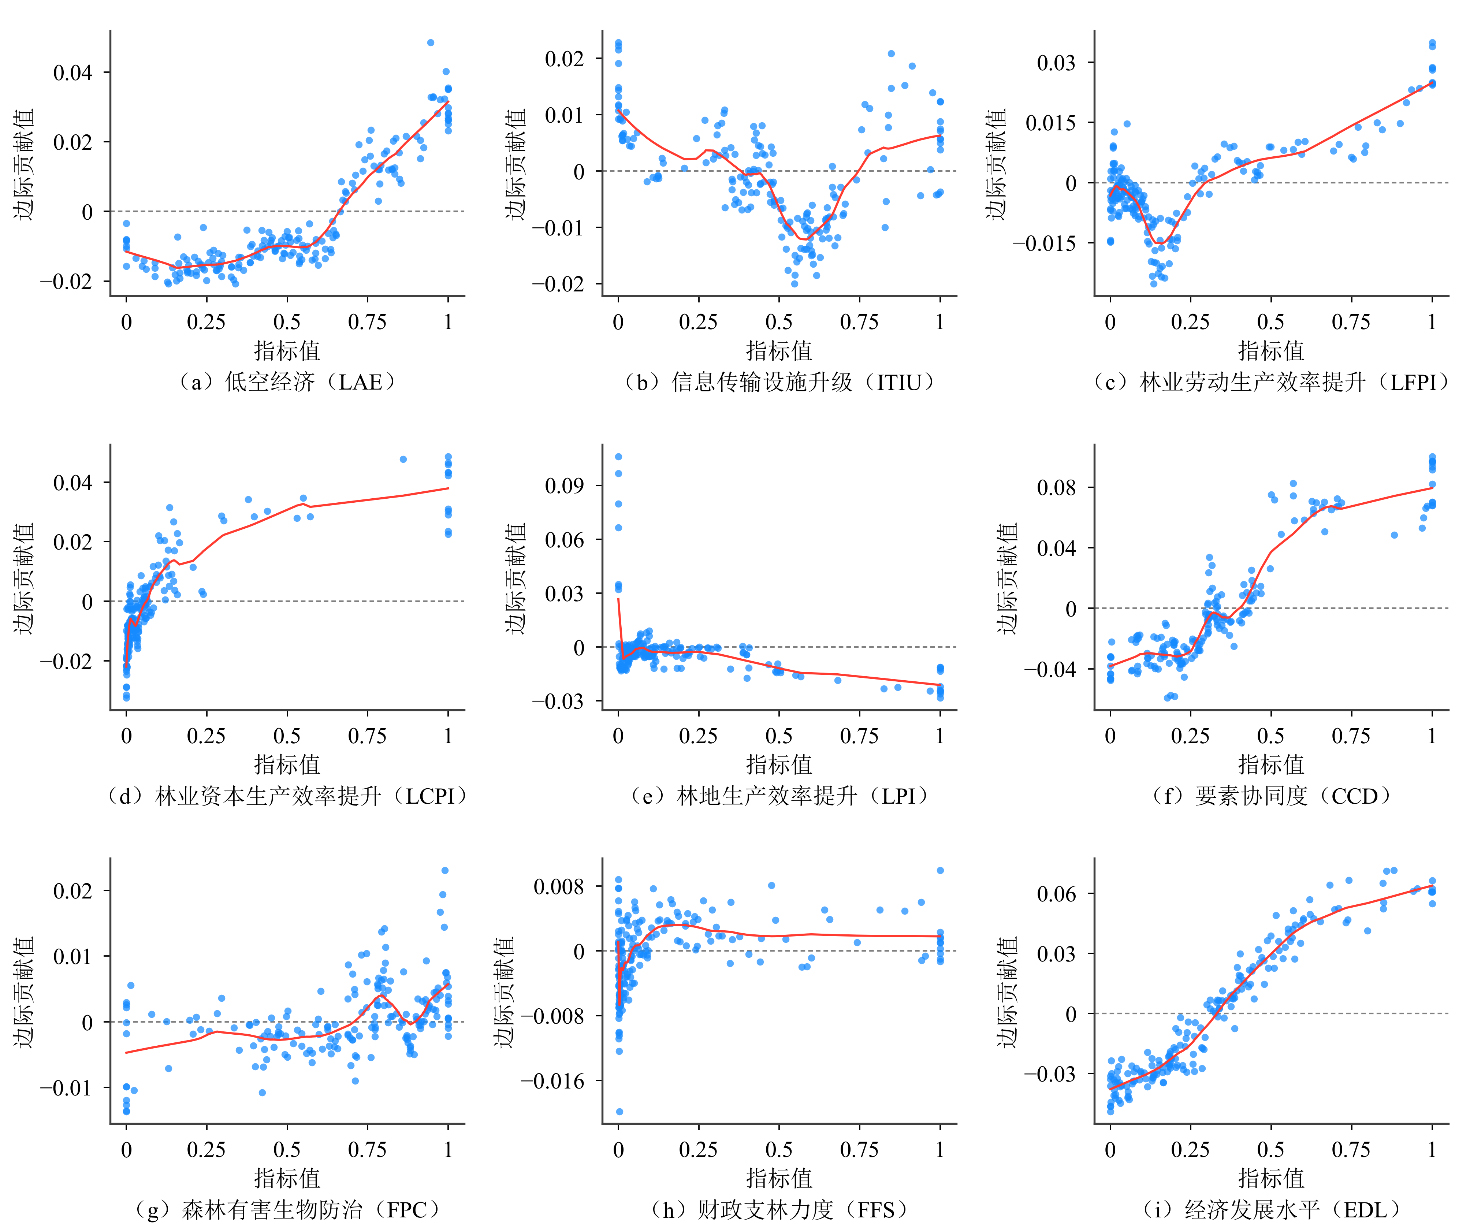
Figure 4 Dependency diagram of influencing factors and the FEHQD
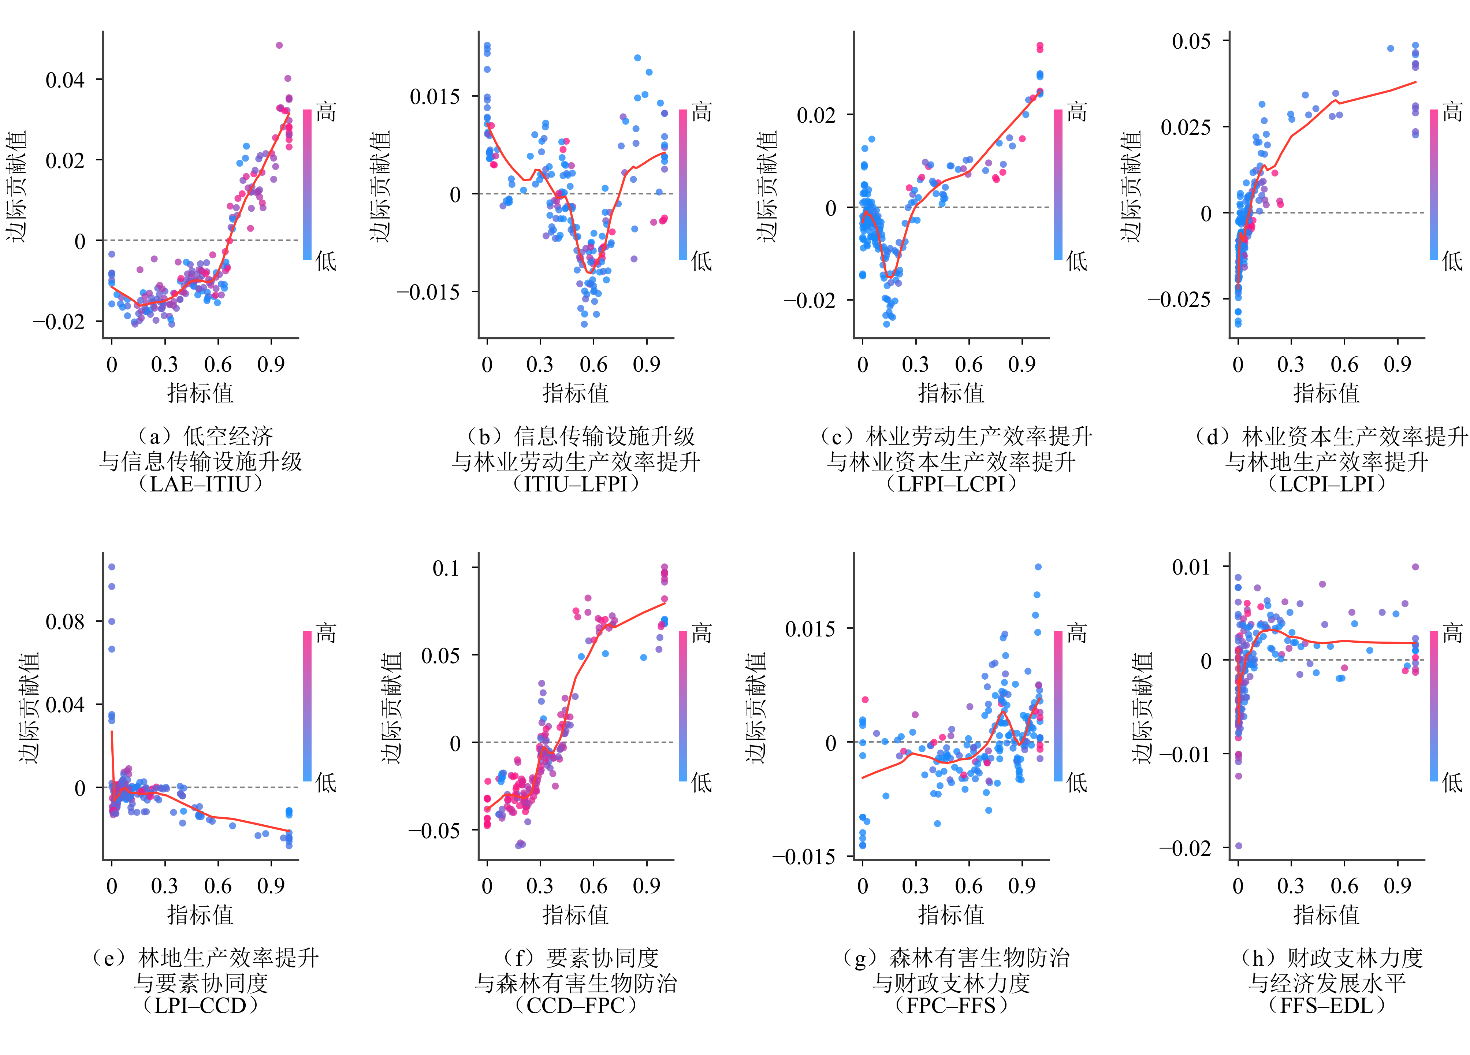
Figure 5 Analysis of the interaction effects of influencing factors
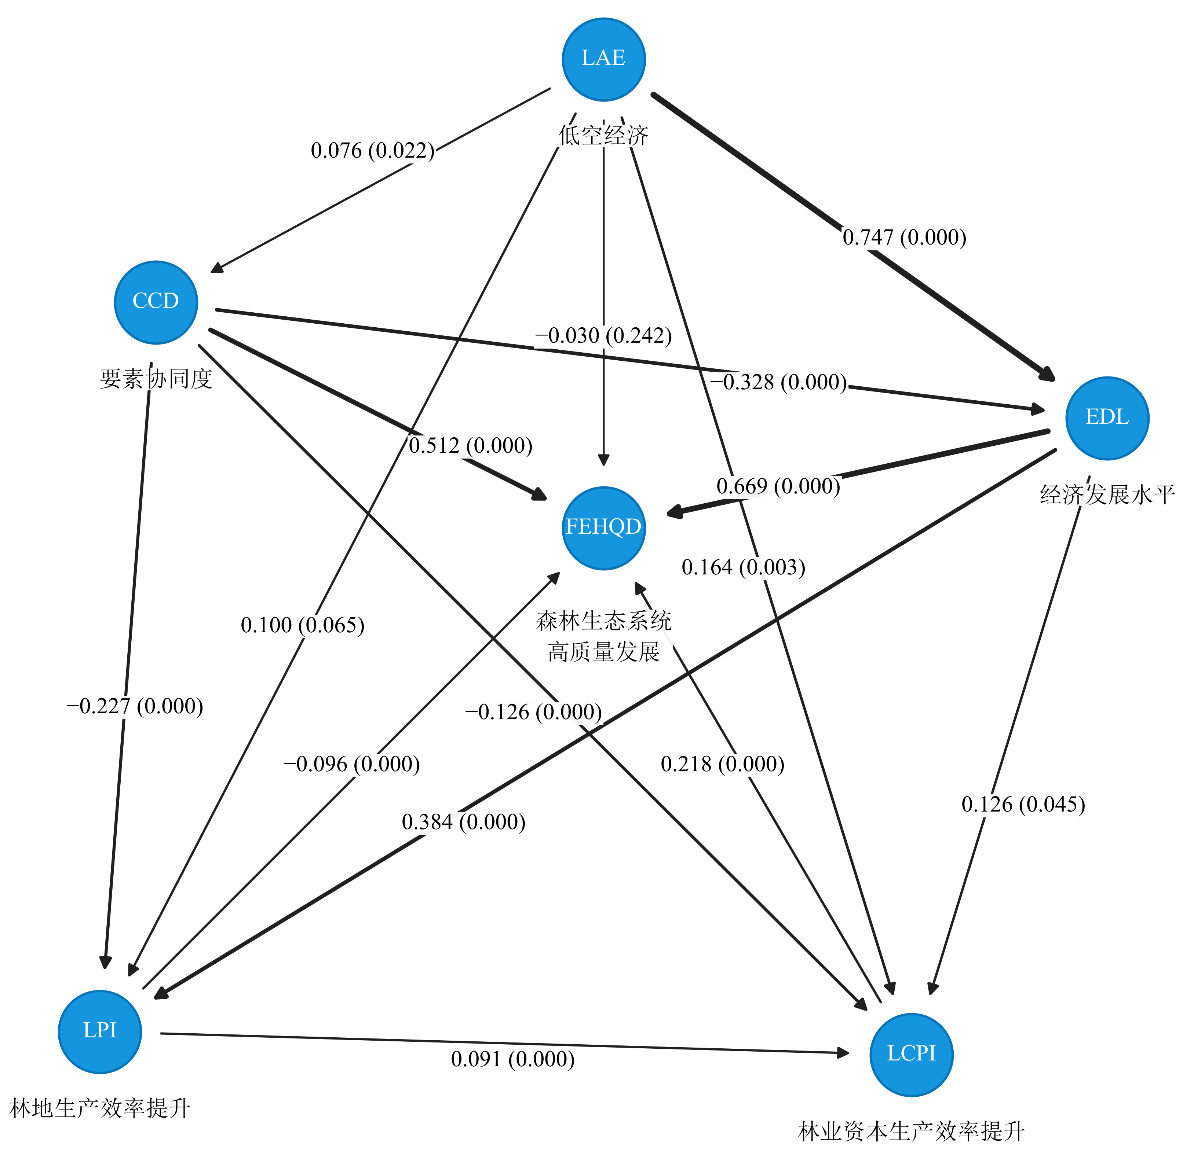
Figure 6 PLS-SEM model diagram
| [1] | Dietz T, Rosa E A, 1994. Rethinking the environmental impacts of population, affluence and technology[J]. Human Ecology Review, 1(2): 277-300. |
| [2] | Lundberg S M, Lee S I, 2017. A unified approach to interpreting model predictions[C]// Proceedings of the 31st International Conference on Neural Information Processing Systems. Long Beach, CA: Curran Associates, Inc.: 4765-4774. |
| [3] |
Ostrom E, 2009. A general framework for analyzing sustainability of social-ecological systems[J]. Science, 325(5939): 419-422.
DOI PMID |
| [4] | Smeets E, Weterings R, 1999. Environmental indicators: Typology and overview: Technical report No. 25[R/OL]. 2026-08-12: 6-7. https://www.eea.europa.eu/en/analysis/publications/tec25.. |
| [5] |
Suganthan P N, Kong L, Snášel V, et al., 2025. Euclidean and Poincaré space ensemble Xgboost[J]. Information Fusion, 115: 102746.
DOI URL |
| [6] |
陈龙斌, 孙昆, 张旭, 等, 2021. 林隙干扰对森林生态系统的影响[J]. 应用生态学报, 32(2): 701-710.
DOI |
| Chen L B, Sun K, Zhang X, et al., 2021. The effects of inter-tree disturbances on forest ecosystems[J]. Chinese Journal of Applied Ecology, 32(2): 701-710. | |
| [7] | 陈伟, 杨飞, 王卷乐, 等, 2018. 冰雪冻灾干扰下的亚热带森林生态系统恢复力综合定量评价——以湖南省道县为例[J]. 林业科学, 54(6): 1-8. |
| Chen W, Yang F, Wang J L, et al., 2018. Comprehensive quantitative assessment of the resilience of subtropical forest ecosystems under the impact of snow, ice, and freezing disasters: A case study of Dao County, Hunan Province[J]. Scientia Silvae Sinicae, 54(6): 1-8. | |
| [8] | 傅伯杰, 吕楠, 吕一河, 2022. 加强生态系统管理助力碳中和目标实现[J]. 中国科学院院刊, 37(11): 1529-1533. |
| Fu B J, Lü N, Lü Y H, 2022. Strengthening ecosystem management to support the achievement of carbon neutrality goals[J]. Bulletin of Chinese Academy of Sciences, 37(11): 1529-1533. | |
| [9] | 高添, 朱教君, 张金鑫, 等, 2023. 基于新一代信息技术的温带森林生态系统碳通量精准计量[J]. 数据与计算发展前沿, 5(2): 60-72. |
| Gao T, Zhu J J, Zhang J X, et al., 2023. Precise measurement of carbon fluxes in temperate forest ecosystems using next-generation information technologies[J]. Frontiers of Data and Computing, 5(2): 60-72. | |
| [10] | 胡海清, 罗碧珍, 罗斯生, 等, 2020. 林火干扰对森林生态系统碳库的影响研究进展[J]. 林业科学, 56(4): 160-169. |
| Hu H Q, Luo B Z, Luo S S, et al., 2020. Recent advances in research on the effects of wildfire disturbance on forest ecosystem carbon pools[J]. Scientia Silvae Sinicae, 56(4): 160-169. | |
| [11] | 黄颖利, 乔振华, 邹为涛, 等, 2021. 基于ISM的国家森林公园生态福利供给系统评价指标体系研究[J]. 生态学报, 41(10): 4090-4098. |
| Huang Y L, Qiao Z H, Zou W T, et al., 2021. Evaluation index system of ecological welfare supply system of national forest parks based on ISM[J]. Acta Ecologica Sinica, 41(10): 4090-4098. | |
| [12] | 姜钰, 姜佳玮, 2021. 林业技术进步对林业产业结构升级影响的空间效应[J]. 东北林业大学学报, 49(5): 148-152. |
| Jiang Y, Jiang J W, 2021. Spatial effects of forestry technological progress on the upgrading of forestry industrial structure[J]. Journal of Northeast Forestry University, 49(5): 148-152. | |
| [13] | 金磊, 勇环英, 蔡慧君, 等, 2026. 林下经济经营对森林生态系统服务及其权衡关系的影响: 以清原县为例[J]. 生态学杂志, 45(4): 1344-1352. |
| Jin L, Yong H Y, Cai H J, et al., 2026. The impact of understory agriculture on forest ecosystem services and their trade-offs: A case study of Qingyuan County[J]. Chinese Journal of Ecology, 45(4): 1344-1352. | |
| [14] |
李坦, 陈天宇, 惠宝航, 2022. 基于 Meta 分析的黄山市森林生态系统服务价值研究[J]. 地理科学, 42(12): 2179-2188.
DOI |
| Li T, Chen T Y, Hui B H, 2022. A meta-analysis-based study on the value of forest ecosystem services in Huangshan City[J]. Scientia Geographica Sinica, 42(12): 2179-2188. | |
| [15] |
李伟伟, 易平涛, 李玲玉, 2018. 综合评价中异常值的识别及无量纲化处理方法[J]. 运筹与管理, 27(4): 173-178.
DOI |
| Li W W, Yi P T, Li L Y, 2018. Identification and dimensionless treatment of outliers in comprehensive evaluation[J]. Operations Research and Management, 27(4): 173-178. | |
| [16] | 李文华, 李芬, 李世东, 等, 2006. 森林生态效益补偿的研究现状与展望[J]. 自然资源学报, 21(5): 677-688. |
| Li W H, Li F, Li S D, et al., 2006. Current status and prospects of research on compensation for forest ecological benefits[J]. Journal of Natural Resources, 21(5): 677-688. | |
| [17] | 刘国华, 傅伯杰, 2001. 全球气候变化对森林生态系统的影响[J]. 自然资源学报, 16(1): 71-78. |
| Liu G H, Fu B J, 2001. The impact of global climate change on forest ecosystems[J]. Journal of Natural Resources, 16(1): 71-78. | |
| [18] | 刘世荣, 陈远其, 聂秀青, 等, 2026. 树种多样性对森林生态系统多功能性和韧性的影响[J]. 林业科学, 62(1): 1-18. |
| Liu S R, Chen Y Q, Nie X Q, et al., 2026. The impact of tree species diversity on the multifunctionality and resilience of forest ecosystems[J]. Scientia Silvae Sinicae, 62(1): 1-18. | |
| [19] | 刘素芝, 何小东, 李建军, 2014. 基于知识粒度的森林生态系统健康评价指标赋权方法[J]. 生态学杂志, 33(4): 1082-1088. |
| Liu S Z, He X D, Li J J, 2014. A weighting method for forest ecosystem health assessment indicators based on knowledge granularity[J]. Chinese Journal of Ecology, 33(4): 1082-1088. | |
| [20] | 刘亚秋, 景维鹏, 井云凌, 2011. 高可靠云计算平台及其在智慧林业中的应用[J]. 世界林业研究, 24(5): 18-24. |
| Liu Y Q, Jing W P, Jing Y L, 2011. A highly reliable cloud computing platform and its application in smart forestry[J]. World Forestry Research, 24(5): 18-24. | |
| [21] | 鲁显楷, 莫江明, 张炜, 等, 2019. 模拟大气氮沉降对中国森林生态系统影响的研究进展[J]. 热带亚热带植物学报, 27(5): 500-522. |
| Lu X K, Mo J M, Zhang W, et al., 2019. Research progress on the effects of simulated atmospheric nitrogen deposition on Chinese forest ecosystems[J]. Journal of Tropical and Subtropical Botany, 27(5): 500-522. | |
| [22] |
萨如拉, 王子瑞, 滑永春, 等, 2024. 基于结构方程模型的大兴安岭北部天然林森林生态系统恢复能力评价研究[J]. 南京林业大学学报(自然科学版), 48(1): 196-204.
DOI |
| Sa R L, Wang Z R, Hua Y C, et al., 2024. A study on the assessment of forest ecosystem resilience in natural forests of northern Greater Khingan Range based on structural equation modeling[J]. Journal of Nanjing Forestry University (Natural Science Edition), 48(1): 196-204. | |
| [23] | 吴楠, 于洋, 董贵华, 等, 2026. 广西森林生态系统质量评价与影响因素研究[J]. 中国环境监测, 42(2): 131-138. |
| Wu N, Yu Y, Dong G H, et al., 2026. Evaluation of forest ecosystem quality and factors influencing it in Guangxi[J]. Environmental Monitoring in China, 42(2): 131-138. | |
| [24] | 吴诗婷, 王国兵, 杨立青, 等, 2024. 干旱对森林生态系统结构及功能的影响研究进展[J]. 世界林业研究, 37(4): 37-45. |
| Wu S T, Wang G B, Yang L Q, et al., 2024. Recent advances in research on the effects of drought on the structure and function of forest ecosystems[J]. World Forestry Research, 37(4): 37-45. | |
| [25] |
吴卓, 戴尔阜, 林媚珍, 2018. 气候变化和人类活动对南方红壤丘陵区森林生态系统影响模拟研究——以江西泰和县为例[J]. 地理研究, 37(11): 2141-2152.
DOI |
| Wu Z, Dai E F, Lin M Z, 2018. A simulation study on the impacts of climate change and human activities on forest ecosystems in southern red soil hilly regions: A case study of Taihe County, Jiangxi[J]. Geographical Research, 37(11): 2141-2152. | |
| [26] | 谢高地, 张彩霞, 张雷明, 等, 2015. 基于单位面积价值当量因子的生态系统服务价值化方法改进[J]. 自然资源学报, 30(8): 1243-1254. |
|
Xie G D, Zhang C X, Zhang L M, et al., 2015. Improvement of the evaluation method for ecosystem service value based on per unit area value equivalent factor[J]. Journal of Natural Resources, 30(8): 1243-1254.
DOI |
|
| [27] | 谢高地, 甄霖, 鲁春霞, 等, 2008. 一个基于专家知识的生态系统服务价值化方法[J]. 自然资源学报, 23(5): 911-919. |
| Xie G D, Zhen L, Lu C X, et al., 2008. An expert-knowledge-based method for valuing ecosystem services[J]. Journal of Natural Resources, 23(5): 911-919. | |
| [28] |
谢花林, 黄凌豪, 温家明, 2026. 生态产品价值实现赋能共同富裕的作用机理与路径——基于主体-技术-产业-制度协同视角[J]. 自然资源学报, 41(2): 387-406.
DOI |
|
Xie H L, Huang L H, Wen J M, 2026. Mechanisms and pathways for realizing the value of ecological products to empower common prosperity: A perspective based on the synergy of actors, technology, industry, and institutions[J]. Journal of Natural Resources, 41(2): 387-406.
DOI URL |
|
| [29] | 谢宁波, 许新桥, 王前鹏, 等, 2025. 面向智慧林草的天空地一体化监测技术研究进展[J]. 林草资源研究 (3): 1-8. |
| Xie N B, Xu X Q, Wang Q P, et al., 2025. Research progress on integrated air-ground monitoring technologies for smart forestry and grassland management[J]. Forest and Grassland Resources Research (3): 1-8. | |
| [30] | 游晓东, 刘苗苗, 董丙瑞, 等, 2025. 城乡融合发展对林业绿色全要素生产率的影响[J]. 林业经济问题, 45(3): 240-251. |
| You X D, Liu M M, Dong B R, et al., 2025. The impact of integrated urban-rural development on green total factor productivity in forestry[J]. Issues in Forestry Economics, 45(3): 240-251. | |
| [31] | 于贵瑞, 朱剑兴, 徐丽, 等, 2022. 中国生态系统碳汇功能提升的技术途径:基于自然解决方案[J]. 中国科学院院刊, 37(4): 490-501. |
| Yu G R, Zhu J X, Xu L, et al., 2022. Technical approaches to enhancing ecosystem carbon sink functions in China: Based on nature-based solutions[J]. Bulletin of Chinese Academy of Sciences, 37(4): 490-501. | |
| [32] |
虞依娜, 徐曼, 叶有华, 2020. 近5年森林生态系统服务价值评估研究进展——基于CiteSpace文献计量学分析方法[J]. 生态环境学报, 29(2): 421-428.
DOI |
| Yu Y N, Xu M, Ye Y H, 2020. Recent advances in research on the valuation of forest ecosystem services over the past five years: A CiteSpace-based bibliometric analysis[J]. Ecology and Environmental Sciences, 29(2): 421-428. | |
| [33] | 袁宝龙, 张壬, 2024. 新质生产力赋能中国林业高质量发展: 理论逻辑、现实困境与实践进路[J]. 世界林业研究, 37(4): 1-8. |
| Yuan B L, Zhang R, 2024. New-quality productive forces empowering high-quality development in China’s forestry sector: Theoretical logic, practical challenges, and practical approaches[J]. World Forestry Research, 37(4): 1-8. | |
| [34] | 张彪, 李文华, 谢高地, 等, 2009. 森林生态系统的水源涵养功能及其计量方法[J]. 生态学杂志, 28(3): 529-534. |
| Zhang B, Li W H, Xie G D, et al., 2009. Water conservation functions of forest ecosystems and methods for their quantification[J]. Chinese Journal of Ecology, 28(3): 529-534. | |
| [35] | 张会儒, 雷相东, 张春雨, 等, 2019. 森林质量评价及精准提升理论与技术研究[J]. 北京林业大学学报, 41(5): 1-18. |
| Zhang H R, Lei X D, Zhang C Y, et al., 2019. Research on the theory and technology of forest quality assessment and precision improvement[J]. Journal of Beijing Forestry University, 41(5): 1-18. | |
| [36] |
张颖, 宋维明, 杨桂红, 2012. 我国城市森林文态保护和管理的探讨[J]. 自然资源学报, 27(8): 1415-1420.
DOI |
| Zhang Y, Song W M, Yang G H, 2012. A study on the conservation and management of urban forest ecosystems in China[J]. Journal of Natural Resources, 27(8): 1415-1420. | |
| [37] | 赵同谦, 欧阳志云, 郑华, 等, 2004. 中国森林生态系统服务功能及其价值评价[J]. 自然资源学报, 19(4): 480-491. |
| Zhao T Q, Ouyang Z Y, Zheng H, et al., 2004. Forest ecosystem services in China and their value assessment[J]. Journal of Natural Resources, 19(4): 480-491. | |
| [38] | 赵忠宝, 李宏志, 王海民, 等, 2025. 黑龙山林场森林生态系统碳储量、碳密度及碳汇增加途径[J]. 水土保持通报, 45(5): 144-154. |
| Zhao Z B, Li H Z, Wang H M, et al., 2025. Carbon stock, carbon density, and strategies for increasing carbon sinks in the forest ecosystem of Heilongshan Forest Farm[J]. Bulletin of Soil and Water Conservation, 45(5): 144-154. | |
| [39] |
朱教君, 高添, 于立忠, 等, 2024. 森林生态系统碳汇: 概念、时间效应与提升途径[J]. 应用生态学报, 35(9): 2313-2321.
DOI |
| Zhu J J, Gao T, Yu L Z, et al., 2024. Forest ecosystem carbon sinks: Concepts, temporal effects, and enhancement strategies[J]. Chinese Journal of Applied Ecology, 35(9): 2313-2321. | |
| [40] | 朱震锋, 曹玉昆, 2017. 国有林区经济增长与资源消耗的伪脱钩风险识别及破解思路[J]. 林业科学, 53(4): 139-149. |
| Zhu Z F, Cao Y K, 2017. Identifying risks of pseudo-decoupling between economic growth and resource consumption in state-owned forest areas and strategies for mitigation[J]. Scientia Silvae Sinicae, 53(4): 139-149. |
| [1] | Hong Tuling, Huang Peng, Chen Meiqiu, Zuo Tengyun, Yang Xiongping, Lai Zhaohao, Yang Fan. Analysis of Value Accounting and Influencing Factors of Ecological Products in Typical Rare Earth Mineral Restoration Areas [J]. Ecology and Environmental Sciences, 2026, 35(9): 1412-1422. |
| [2] | Zhang Jinlan, Lin Zhuoling, Chen Kehai, Yu Huaiyi. Multi-Scale Analysis of the Controlling Factors on Rare Earth Element Contents in Typical High-Abundance Regions [J]. Ecology and Environmental Sciences, 2026, 35(8): 1310-1319. |
| [3] | LIN Yaoben, WANG Dong, WANG Xinliang. Spatial Differentiation of Paddy Soil Micro-ecological Environments and Their Influencing Factors in the Yellow River Irrigation District [J]. Ecology and Environmental Sciences, 2026, 35(5): 748-759. |
| [4] | ZHAO Shuang, NIE Qianyu, YUE Ang, WANG Dongchuan, SUN Xiaowei, ZHANG Haotian, LIU Haotian, YE Kai. Spatial Distribution Characteristics and Driving Mechanisms of Cultivated Land Fragmentation in Typical Agricultural Regions of Northern China under Topographic-Economic Synergy [J]. Ecology and Environmental Sciences, 2026, 35(4): 642-653. |
| [5] | MU Haofeng, SONG Zhelu, GAO Zhen, HOU Ying, CHEN Weiping. Temporal Dynamics and Influencing Factors of Urban PM2.5 Pollution Risk Based on Ecosystem Service Supply and Demand [J]. Ecology and Environmental Sciences, 2026, 35(2): 256-266. |
| [6] | MA Dongdong, LI Xueting, LI Yunlong, LI Xiang, HE Haoxuan. Research on the Impact of Digital Technology on the Coordinated Advancement of Ecological Protection and High-Quality Development in the Yellow River Basin [J]. Ecology and Environmental Sciences, 2026, 35(2): 311-322. |
| [7] | SHI Hanzhi, CAO Yiran, LIU Fan, WU Zhichao, LI Furong, DENGTENG Haobo, XU Aiping, LI Dongqin, WEN Dian, WANG Xu. Study on the Regulation of Soil Lead Forms Transformation under the Combined Action of Straw and Bacteria [J]. Ecology and Environmental Sciences, 2026, 35(1): 155-166. |
| [8] | HAO Xiaoyan, DONG Chao, XUE Yang, HAN Liping. Symbiotic Effects and Influencing Factors of Energy Supply and Ecological Security in Energy Endowment Advantageous Areas [J]. Ecology and Environmental Sciences, 2025, 34(6): 974-985. |
| [9] | CHEN Jieru, YE Changsheng, WEI Wei, CAI Xin, WANG Lili. Analysis of “Production-Living-Ecological Space” Coupling Coordination and Influencing Factors in County Areas of Poyang Lake City Cluster [J]. Ecology and Environmental Sciences, 2025, 34(5): 807-818. |
| [10] | GUO Mingbin, GONG Jianzhou, WANG Lijuan, WANG Shikuan. Analysis of the Natural Dominant Factors Driving NO2 Concentration Changes in the Guangdong-Hong Kong-Macao Greater Bay Area from 2019 to 2023 [J]. Ecology and Environmental Sciences, 2025, 34(4): 534-547. |
| [11] | WANG Chunmei, JIANG Bingqi, HU Jun, CHEN Daiwen, HUANG Lihua, CHENG Wanwan. Multi-scale Variations and Influencing Factors of Total Radioactivity in Atmospheric Environment Around Nuclear Power Plants [J]. Ecology and Environmental Sciences, 2025, 34(12): 1900-1908. |
| [12] | XIA Yining, LIU Peng’ao, HE Kerun, TIAN Chaohui, ZENG Liting, HOU Kelun. Spatiotemporal Dynamics and Scenario Simulations of Ecosystem Carbon Storage Based on Land Use Changes in the Changsha-Zhuzhou-Xiangtan Metropolitan Area [J]. Ecology and Environmental Sciences, 2025, 34(11): 1661-1674. |
| [13] | ZHANG Weichen, WANG Xingqi, WANG Bojie. Spatiotemporal Pattern and Influencing Factors of the Ecosystem Services in the Tabu River Basin [J]. Ecology and Environmental Sciences, 2024, 33(7): 1142-1152. |
| [14] | LI Cheng, CHENG Zhipeng, LIU Yujin, YAO Yiming, LI Chunlei. Research on Ecological Risks and Its Control Policies of Per- and Polyfluoroalkyl Substances [J]. Ecology and Environmental Sciences, 2024, 33(6): 980-996. |
| [15] | LUO Xiaoling, LIU Jun, WANG Qi, LIU Tongxu, LIANG Yaojie, XIE Zhiyi, WANG Zhongwei, CHEN Duohong. Temporal and Spatial Changes in pH and Organic Matter and Their Influencing Factors in Soils with Various Land Use Types in Guangdong Province since 2016 [J]. Ecology and Environmental Sciences, 2024, 33(12): 1849-1861. |
| Viewed | ||||||
|
Full text |
|
|||||
|
Abstract |
|
|||||
Website Copyright © 2021 Editorial Office of Ecology and Environmental Sciences
Add: 808# Tianyuan Road, Tianhe District, Guangzhou. 510650.
Institute of Eco-environmental and Soil Sciences, Guangdong Academy of Sciences
Tel/Fax: 020-87024961; E-mail: editor@jeesci.com
Support by Beijing Magtech Co. Ltd., E-mail: support@magtech.com.cn
