Ecology and Environmental Sciences ›› 2026, Vol. 35 ›› Issue (4): 642-653.DOI: 10.16258/j.cnki.1674-5906.2026.04.014
• Research Article [Environmental Science] • Previous Articles Next Articles
ZHAO Shuang1( ), NIE Qianyu1, YUE Ang2,*(), WANG Dongchuan1, SUN Xiaowei3, ZHANG Haotian1, LIU Haotian1, YE Kai1
Received:2025-05-29
Revised:2025-10-08
Accepted:2025-11-20
Online:2026-04-18
Published:2026-04-14
赵爽1(), 聂谦雨1, 岳昂2,*(), 汪东川1, 孙晓玮3, 张昊天1, 刘昊沺1, 叶凯1
通讯作者:
*E-mail: 作者简介:赵爽(1989年生),女,讲师,研究方向为遥感图像识别与城市遥感。E-mail: zhaoshuang316@163.com
基金资助:CLC Number:
ZHAO Shuang, NIE Qianyu, YUE Ang, WANG Dongchuan, SUN Xiaowei, ZHANG Haotian, LIU Haotian, YE Kai. Spatial Distribution Characteristics and Driving Mechanisms of Cultivated Land Fragmentation in Typical Agricultural Regions of Northern China under Topographic-Economic Synergy[J]. Ecology and Environmental Sciences, 2026, 35(4): 642-653.
赵爽, 聂谦雨, 岳昂, 汪东川, 孙晓玮, 张昊天, 刘昊沺, 叶凯. 地形-经济驱动下北方典型农业区的耕地细碎化空间分布特征及驱动机制[J]. 生态环境学报, 2026, 35(4): 642-653.
Add to citation manager EndNote|Ris|BibTeX
URL: https://www.jeesci.com/EN/10.16258/j.cnki.1674-5906.2026.04.014
| 地区 | 生产总值(2020年)/(1010元) | 人口/(104人) | 总面积/(103 km2) | 耕地面积/(103 hm2) | 主要粮食作物 | 粮食产量/(104 t) |
|---|---|---|---|---|---|---|
| 昌平区 | 13.4 | 226.7 | 1.3 | 4.4 | 大豆、小麦、玉米 | 0.9 |
| 滨海新区 | 69.8 | 206.7 | 2.3 | 11.5 | 小麦、玉米、水稻 | 13.6 |
| 虎林市 | 1.7 | 26.8 | 9.3 | 466. 7 | 大豆、小麦、水稻 | 293.5 |
| 寿光市 | 7.9 | 111.0 | 2.1 | 82.2 | 小麦、玉米、棉花 | 56.1 |
| 灌南县 | 3.8 | 102.7 | 1.0 | 71.8 | 小麦、水稻 | 87.9 |
Table 1 Overview of the study areas
| 地区 | 生产总值(2020年)/(1010元) | 人口/(104人) | 总面积/(103 km2) | 耕地面积/(103 hm2) | 主要粮食作物 | 粮食产量/(104 t) |
|---|---|---|---|---|---|---|
| 昌平区 | 13.4 | 226.7 | 1.3 | 4.4 | 大豆、小麦、玉米 | 0.9 |
| 滨海新区 | 69.8 | 206.7 | 2.3 | 11.5 | 小麦、玉米、水稻 | 13.6 |
| 虎林市 | 1.7 | 26.8 | 9.3 | 466. 7 | 大豆、小麦、水稻 | 293.5 |
| 寿光市 | 7.9 | 111.0 | 2.1 | 82.2 | 小麦、玉米、棉花 | 56.1 |
| 灌南县 | 3.8 | 102.7 | 1.0 | 71.8 | 小麦、水稻 | 87.9 |

Figure 1 Location map of the studied area
| 数据名称 | 数据来源 | 日期 | 作用 |
|---|---|---|---|
| Landsat8 Collection2表面反射率数据 | 地理空间数据云( | 2020年7月-2020年9月 | 识别研究区耕地细碎化的空间特征 |
| ASTER GDEMV3(30 m)数据集 | 地理空间数据云( | 2020年 | 探讨地形因素对耕地细碎化的影响 |
| 2020年统计年鉴数据 | 各研究区人民政府、统计局 | 2020年 | 探讨社会经济和人口因素对 耕地细碎化的影响 |
| NPP/VIIRS夜间灯光数据 | 美国国家气象信息中心( | 2020年 | 探讨社会经济对耕地细碎化的影响 |
Table 2 Data sources and description
| 数据名称 | 数据来源 | 日期 | 作用 |
|---|---|---|---|
| Landsat8 Collection2表面反射率数据 | 地理空间数据云( | 2020年7月-2020年9月 | 识别研究区耕地细碎化的空间特征 |
| ASTER GDEMV3(30 m)数据集 | 地理空间数据云( | 2020年 | 探讨地形因素对耕地细碎化的影响 |
| 2020年统计年鉴数据 | 各研究区人民政府、统计局 | 2020年 | 探讨社会经济和人口因素对 耕地细碎化的影响 |
| NPP/VIIRS夜间灯光数据 | 美国国家气象信息中心( | 2020年 | 探讨社会经济对耕地细碎化的影响 |
| 判据 | 交互作用 |
|---|---|
| q(X1∩X2)<Min[q(X1), q(X2)] | 非线性减弱 |
| Min[q(X1), q(X2)]<q(X1∩X2)<Max[q(X1), q(X2)] | 单因子非线性减弱 |
| q(X1∩X2)>Max[q(X1), q(X2)] | 双因子增强 |
| q(X1∩X2)=q(X1)+q(X2) | 独立 |
| q(X1∩X2)>q(X1)+q(X2) | 非线性增强 |
Table 3 Types of interaction effects
| 判据 | 交互作用 |
|---|---|
| q(X1∩X2)<Min[q(X1), q(X2)] | 非线性减弱 |
| Min[q(X1), q(X2)]<q(X1∩X2)<Max[q(X1), q(X2)] | 单因子非线性减弱 |
| q(X1∩X2)>Max[q(X1), q(X2)] | 双因子增强 |
| q(X1∩X2)=q(X1)+q(X2) | 独立 |
| q(X1∩X2)>q(X1)+q(X2) | 非线性增强 |
| 目标层 | 准则层 | 指标层 | 权重系数 | |||||||||
|---|---|---|---|---|---|---|---|---|---|---|---|---|
| 昌平区 | 滨海新区 | 虎林市 | 寿光市 | 灌南县 | ||||||||
| 不同地区耕地细碎化评价 | 分布指标 | 香农多样性指数 | 0.141 | 0.405 | 0.138 | 0.396 | 0.154 | 0.434 | 0.136 | 0.425 | 0.141 | 0.422 |
| 蔓延度指数 | 0.134 | 0.129 | 0.145 | 0.151 | 0.142 | |||||||
| 聚集度 | 0.130 | 0.129 | 0.135 | 0.138 | 0.139 | |||||||
| 面积指标 | 最大斑块指数 | 0.154 | 0.286 | 0.152 | 0.290 | 0.137 | 0.274 | 0.137 | 0.282 | 0.144 | 0.285 | |
| 斑块面积百分比 | 0.132 | 0.138 | 0.137 | 0.145 | 0.141 | |||||||
| 形状指标 | 分离度指数 | 0.159 | 0.309 | 0.157 | 0.314 | 0.141 | 0.292 | 0.158 | 0.293 | 0.153 | 0.293 | |
| 面积加权的平均斑块分形指标 | 0.150 | 0.157 | 0.151 | 0.135 | 0.140 | |||||||
Table 4 Weights for cultivated land fragmentation indicators
| 目标层 | 准则层 | 指标层 | 权重系数 | |||||||||
|---|---|---|---|---|---|---|---|---|---|---|---|---|
| 昌平区 | 滨海新区 | 虎林市 | 寿光市 | 灌南县 | ||||||||
| 不同地区耕地细碎化评价 | 分布指标 | 香农多样性指数 | 0.141 | 0.405 | 0.138 | 0.396 | 0.154 | 0.434 | 0.136 | 0.425 | 0.141 | 0.422 |
| 蔓延度指数 | 0.134 | 0.129 | 0.145 | 0.151 | 0.142 | |||||||
| 聚集度 | 0.130 | 0.129 | 0.135 | 0.138 | 0.139 | |||||||
| 面积指标 | 最大斑块指数 | 0.154 | 0.286 | 0.152 | 0.290 | 0.137 | 0.274 | 0.137 | 0.282 | 0.144 | 0.285 | |
| 斑块面积百分比 | 0.132 | 0.138 | 0.137 | 0.145 | 0.141 | |||||||
| 形状指标 | 分离度指数 | 0.159 | 0.309 | 0.157 | 0.314 | 0.141 | 0.292 | 0.158 | 0.293 | 0.153 | 0.293 | |
| 面积加权的平均斑块分形指标 | 0.150 | 0.157 | 0.151 | 0.135 | 0.140 | |||||||
| 地区 | 移动窗口尺寸 | |||
|---|---|---|---|---|
| 100 m | 200 m | 500 m | 1 km | |
| 昌平区 | 0.156 | 0.074 | 0.078 | 0.097 |
| 滨海新区 | 0.158 | 0.129 | 0.113 | 0.135 |
| 虎林市 | 0.193 | 0.120 | 0.116 | 0.117 |
| 寿光市 | 0.084 | 0.053 | 0.101 | 0.107 |
| 灌南县 | 0.089 | 0.046 | 0.050 | 0.062 |
Table 5 Multi-scale moving window coefficient of variation
| 地区 | 移动窗口尺寸 | |||
|---|---|---|---|---|
| 100 m | 200 m | 500 m | 1 km | |
| 昌平区 | 0.156 | 0.074 | 0.078 | 0.097 |
| 滨海新区 | 0.158 | 0.129 | 0.113 | 0.135 |
| 虎林市 | 0.193 | 0.120 | 0.116 | 0.117 |
| 寿光市 | 0.084 | 0.053 | 0.101 | 0.107 |
| 灌南县 | 0.089 | 0.046 | 0.050 | 0.062 |

Figure 2 The results map of cultivated land fragmentation for different windows
| 指标类型 | 昌平区 | 滨海新区 | 虎林市 | 寿光市 | 灌南县 |
|---|---|---|---|---|---|
| 分布指数 | 0.324 | 0.333 | 0.328 | 0.324 | 0.333 |
| 面积指数 | 0.500 | 0.541 | 0.547 | 0.519 | 0.504 |
| 形状指数 | 0.543 | 0.548 | 0.501 | 0.544 | 0.542 |
| 综合指数 | 0.133 | 0.132 | 0.140 | 0.138 | 0.142 |
Table 6 Cultivated land fragmentation index calculation results
| 指标类型 | 昌平区 | 滨海新区 | 虎林市 | 寿光市 | 灌南县 |
|---|---|---|---|---|---|
| 分布指数 | 0.324 | 0.333 | 0.328 | 0.324 | 0.333 |
| 面积指数 | 0.500 | 0.541 | 0.547 | 0.519 | 0.504 |
| 形状指数 | 0.543 | 0.548 | 0.501 | 0.544 | 0.542 |
| 综合指数 | 0.133 | 0.132 | 0.140 | 0.138 | 0.142 |
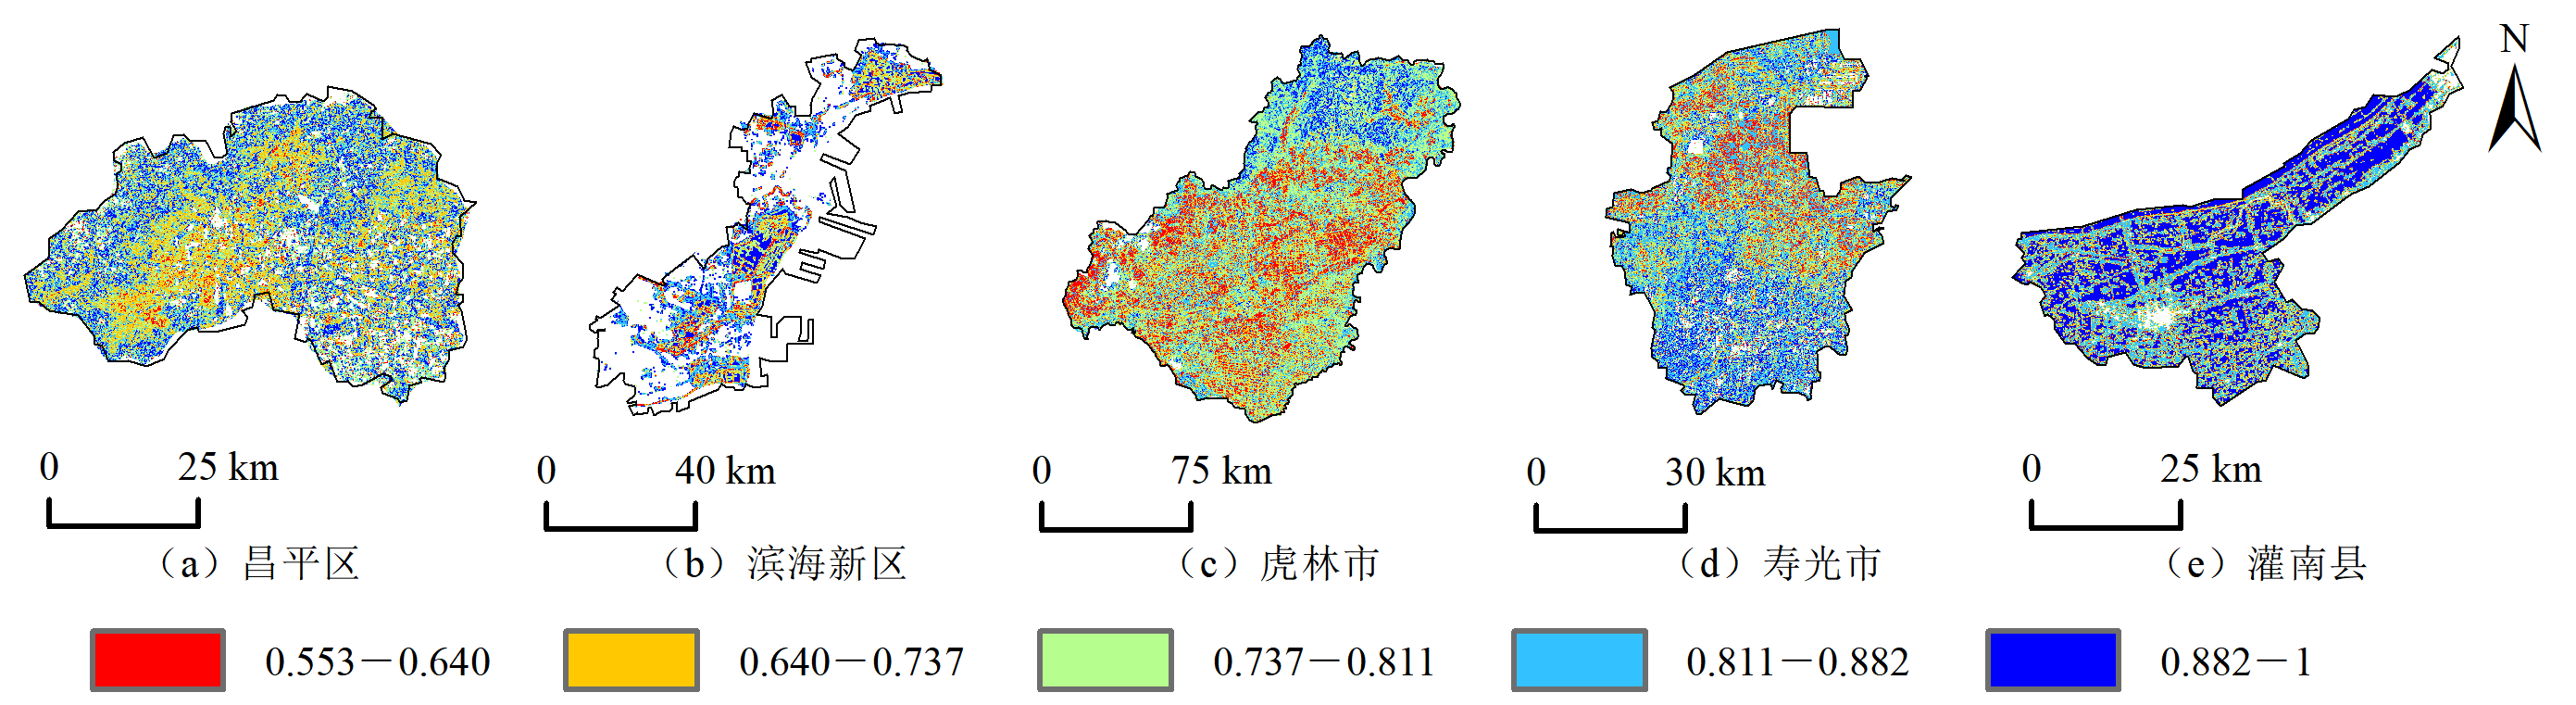
Figure 3 Spatial distribution map of fragmentation
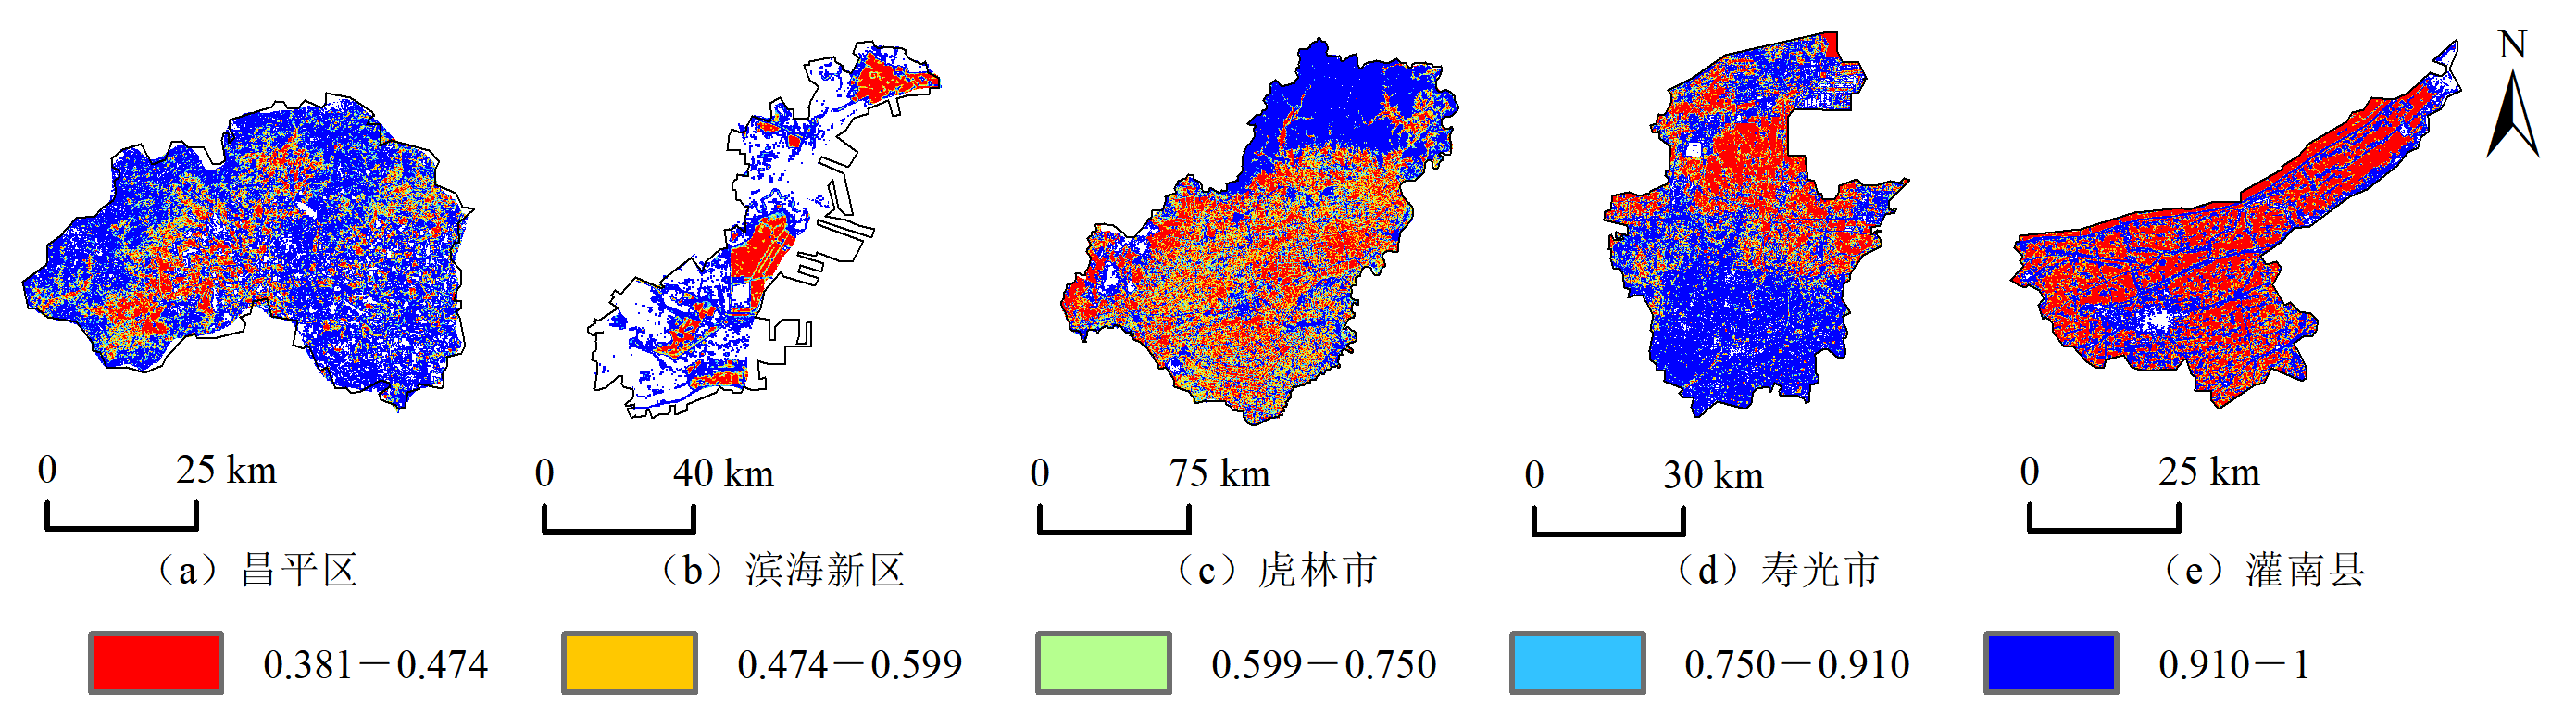
Figure 4 Map of areal fragmentation distribution
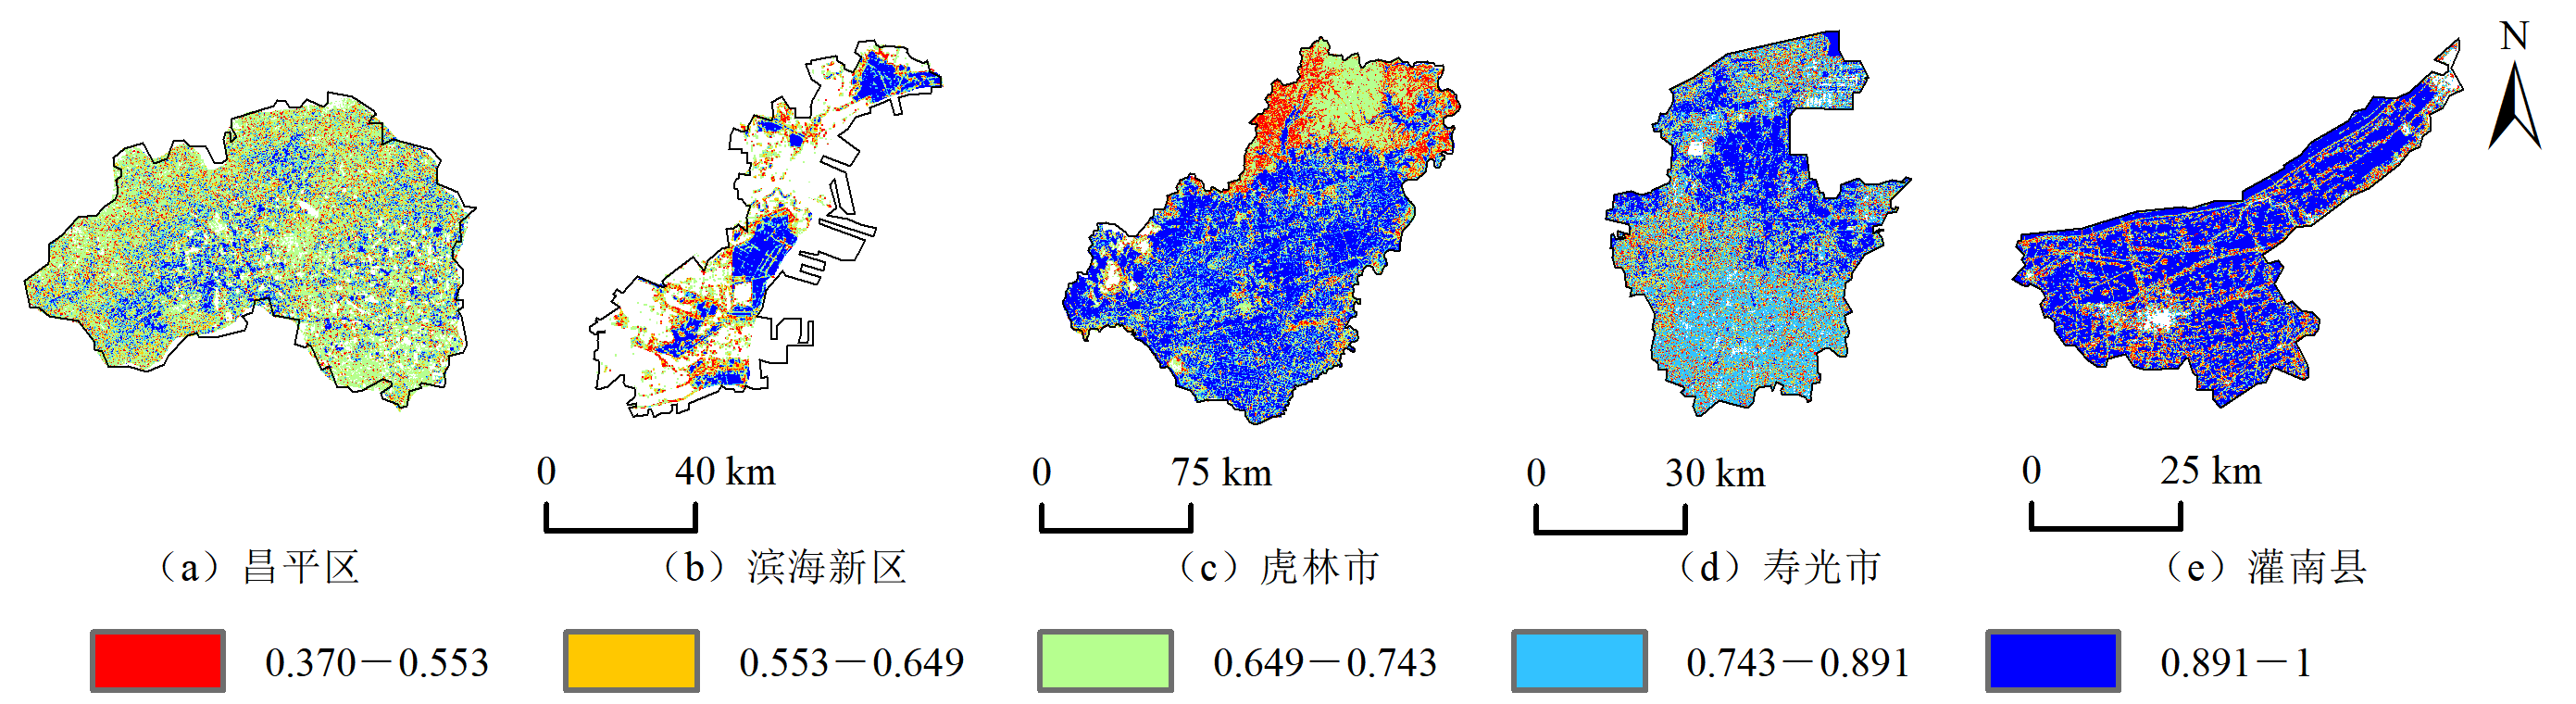
Figure 5 Map of shape fragmentation distribution
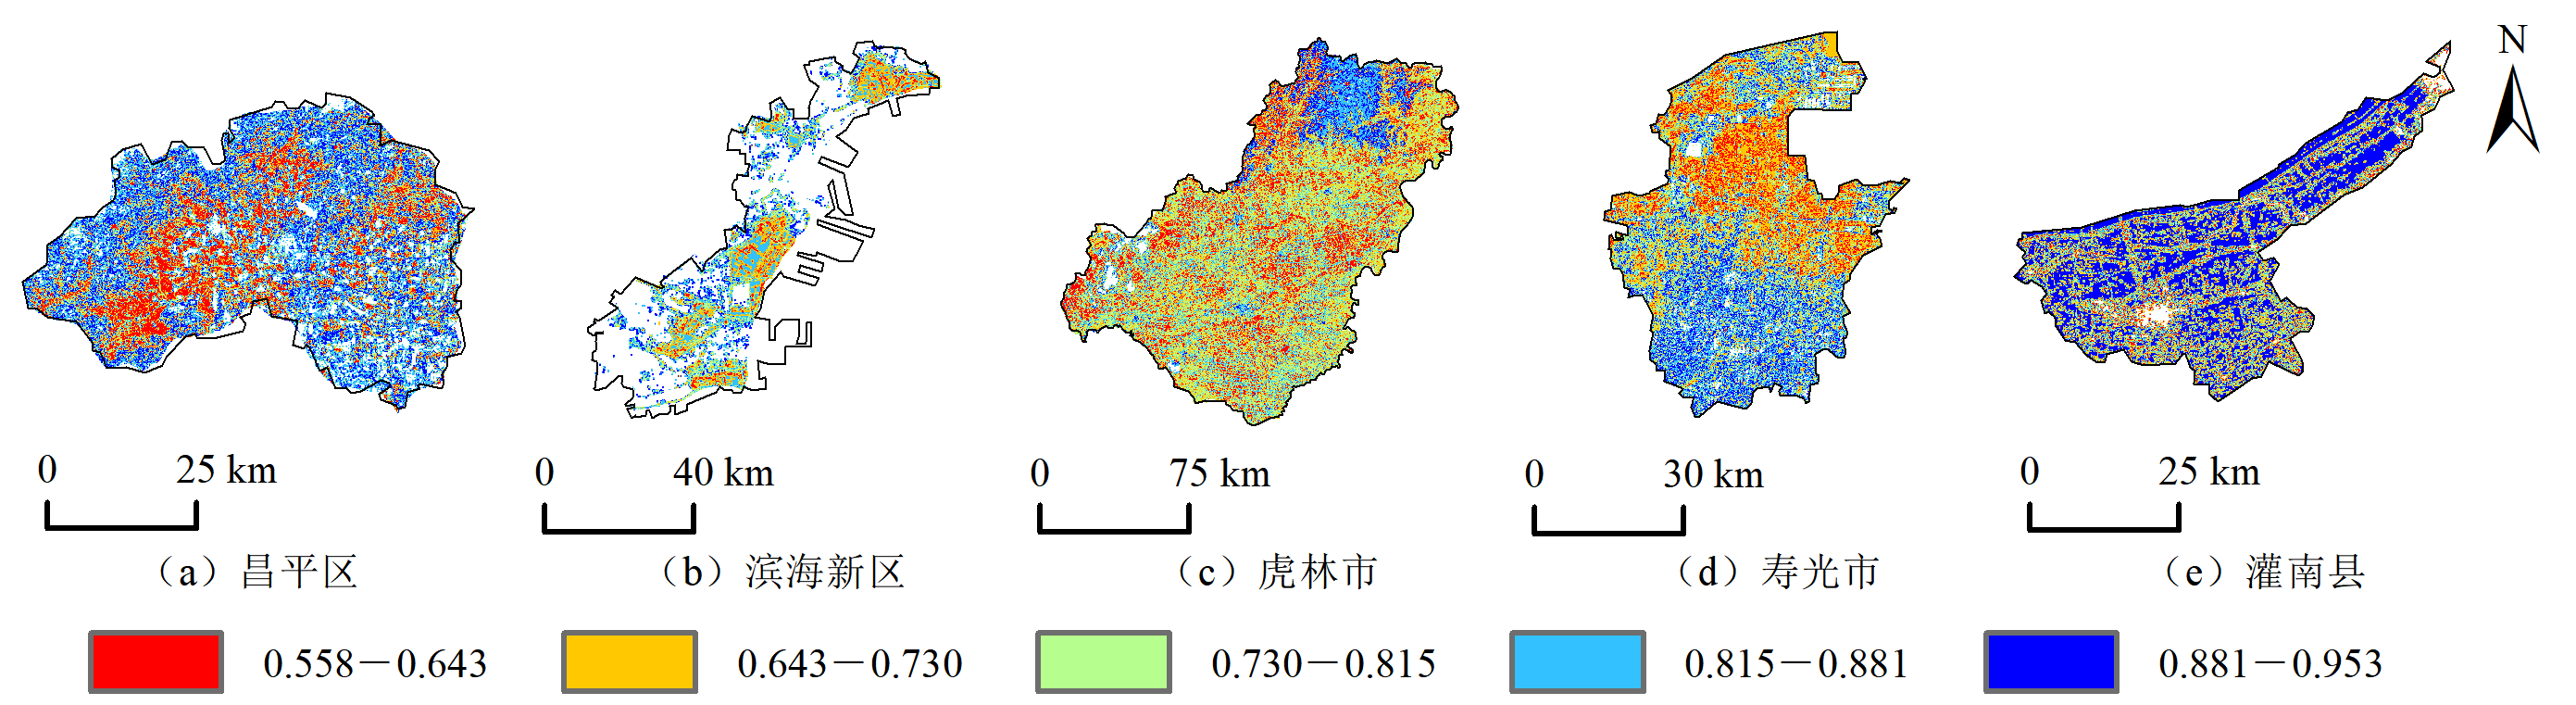
Figure 6 Map of cultivated land fragmentation distribution
| 类型 | 驱动因子 | 昌平区 | 滨海新区 | 虎林市 | 寿光市 | 灌南县 | |||||||||
|---|---|---|---|---|---|---|---|---|---|---|---|---|---|---|---|
| 分类方法 | 级数 | 分类方法 | 级数 | 分类方法 | 级数 | 分类方法 | 级数 | 分类方法 | 级数 | ||||||
| 地形 | 高程 | 自然断点 | 7 | 自然断点 | 6 | 自然断点 | 7 | 标准差 | 7 | 等间隔 | 6 | ||||
| 坡度 | 标准差 | 7 | 自然断点 | 6 | 标准差 | 7 | 标准差 | 7 | 标准差 | 7 | |||||
| 坡向 | 自然断点 | 7 | 自然断点 | 7 | 几何间隔 | 7 | 分位数 | 6 | 自然断点 | 6 | |||||
| 人口 | 人口 | 自然断点 | 7 | 自然断点 | 6 | 自然断点 | 6 | 分位数 | 7 | 分位数 | 7 | ||||
| 人口密度 | 自然断点 | 7 | 自然断点 | 7 | 自然断点 | 7 | 分位数 | 6 | 标准差 | 6 | |||||
| 经济 | 夜间灯光 | 几何间隔 | 6 | 自然断点 | 6 | 自然断点 | 6 | 标准差 | 7 | 几何间隔 | 6 | ||||
| GDP | 自然断点 | 7 | 自然断点 | 5 | 自然断点 | 6 | 分位数 | 6 | 分位数 | 5 | |||||
Table 7 Optimal spatial discretization results for driving factors
| 类型 | 驱动因子 | 昌平区 | 滨海新区 | 虎林市 | 寿光市 | 灌南县 | |||||||||
|---|---|---|---|---|---|---|---|---|---|---|---|---|---|---|---|
| 分类方法 | 级数 | 分类方法 | 级数 | 分类方法 | 级数 | 分类方法 | 级数 | 分类方法 | 级数 | ||||||
| 地形 | 高程 | 自然断点 | 7 | 自然断点 | 6 | 自然断点 | 7 | 标准差 | 7 | 等间隔 | 6 | ||||
| 坡度 | 标准差 | 7 | 自然断点 | 6 | 标准差 | 7 | 标准差 | 7 | 标准差 | 7 | |||||
| 坡向 | 自然断点 | 7 | 自然断点 | 7 | 几何间隔 | 7 | 分位数 | 6 | 自然断点 | 6 | |||||
| 人口 | 人口 | 自然断点 | 7 | 自然断点 | 6 | 自然断点 | 6 | 分位数 | 7 | 分位数 | 7 | ||||
| 人口密度 | 自然断点 | 7 | 自然断点 | 7 | 自然断点 | 7 | 分位数 | 6 | 标准差 | 6 | |||||
| 经济 | 夜间灯光 | 几何间隔 | 6 | 自然断点 | 6 | 自然断点 | 6 | 标准差 | 7 | 几何间隔 | 6 | ||||
| GDP | 自然断点 | 7 | 自然断点 | 5 | 自然断点 | 6 | 分位数 | 6 | 分位数 | 5 | |||||
| 地区 | 影响因子 | ||||||
|---|---|---|---|---|---|---|---|
| X1 | X2 | X3 | X4 | X5 | X6 | X7 | |
| 昌平区 | 0.284 | 0.119 | 0.144 | 0.153 | 0.152 | 0.225 | 0.212 |
| 滨海新区 | 0.215 | 0.207 | 0.238 | 0.125 | 0.084 | 0.086 | 0.213 |
| 虎林市 | 0.286 | 0.065 | 0.108 | 0.046 | 0.237 | 0.090 | 0.195 |
| 寿光市 | 0.491 | 0.221 | 0.186 | 0.228 | 0.637 | 0.129 | 0.239 |
| 灌南县 | 0.299 | 0.119 | 0.112 | 0.072 | 0.249 | 0.093 | 0.265 |
Table 8 Factor detection results
| 地区 | 影响因子 | ||||||
|---|---|---|---|---|---|---|---|
| X1 | X2 | X3 | X4 | X5 | X6 | X7 | |
| 昌平区 | 0.284 | 0.119 | 0.144 | 0.153 | 0.152 | 0.225 | 0.212 |
| 滨海新区 | 0.215 | 0.207 | 0.238 | 0.125 | 0.084 | 0.086 | 0.213 |
| 虎林市 | 0.286 | 0.065 | 0.108 | 0.046 | 0.237 | 0.090 | 0.195 |
| 寿光市 | 0.491 | 0.221 | 0.186 | 0.228 | 0.637 | 0.129 | 0.239 |
| 灌南县 | 0.299 | 0.119 | 0.112 | 0.072 | 0.249 | 0.093 | 0.265 |

Figure 7 Interaction effect plot
| [1] |
AI J W, YANG L Q, LIU Y F, et al., 2022. Dynamic landscape fragmentation and the driving forces on Haitan Island, China[J]. Land, 11(1): 136.
DOI URL |
| [2] | DENG Z Y, CAO J S, HU Y D, 2020. Spatial and temporal evolution of landscape pattern in downtown area of Jixi City, China[J]. European Journal of Remote Sensing, 53(1): 104-113. |
| [3] |
LI D H, DUO L H, BAO C H, et al., 2024. Spatiotemporal distribution and fragmentation driving mechanism in paddy fields and dryland of urban agglomeration in the middle reaches of the Yangtze River[J]. Land, 13(1): 58.
DOI URL |
| [4] |
LIANG J L, PAN S P, CHEN W X, et al., 2022. Cultivated land fragmentation and its influencing factors detection: A case study in Huaihe River basin, China[J]. International Journal of Environmental Research and Public Health, 19(1): 138.
DOI URL |
| [5] |
LIU J, JIN X B, XU W Y, et al., 2022. Evolution of cultivated land fragmentation and its driving mechanism in rural development: A case study of Jiangsu Province[J]. Journal of Rural Studies, 91: 58-72.
DOI URL |
| [6] |
TAN Y Z, CHEN H, LIAN K, et al., 2020. Comprehensive evaluation of cultivated land quality at county scale: A case study of Shengzhou, Zhejiang Province, China[J]. International Journal of Environmental Research and Public Health, 17(4): 1169.
DOI URL |
| [7] |
WANG Y F, ZHAO X L, ZUO L J, et al., 2020. Spatial differentiation of land use and landscape pattern changes in the Beijing-Tianjin-Hebei area[J]. Sustainability, 12(7): 3040.
DOI URL |
| [8] |
XU W Y, JIN X B, LIU J, et al., 2021. Analysis of influencing factors of cultivated land fragmentation based on hierarchical linear model: A case study of Jiangsu Province, China[J]. Land Use Policy, 101: 105119.
DOI URL |
| [9] |
ZHANG J, CHEN M Q, HUANG C, et al., 2022. Labor endowment, cultivated land fragmentation, and ecological farming adoption strategies among farmers in Jiangxi Province, China[J]. Land, 11: 679.
DOI URL |
| [10] |
ZHAO X Y, YAN W Z, WANG K G, et al., 2023. Study of the morphological characteristics of cultivated land in semiarid sandy areas[J]. Land, 12(1): 1849.
DOI URL |
| [11] |
ZHOU Y R, CHEN T Q, FENG Z, et al., 2022. Identifying the contradiction between the cultivated land fragmentation and the construction land expansion from the perspective of urban-rural differences[J]. Ecological Informatics, 71: 101826.
DOI URL |
| [12] | ZOU H Y, YE Y C, KUANG L H, 2024. Study on the relationship between cultivated land quality and landscape pattern index-taking Yingtan City of Jiangxi Province as an example[J]. Journal of Agriculture, 14(1): 44-52. |
| [13] | 常玉旸, 张天柱, 张凤荣, 等, 2021. 赣东山地丘陵区耕地细碎化时空变异与驱动因子探析——以江西省万年县为例[J]. 水土保持研究, 28(3): 264-271, 280. |
| CHANG Y Y, ZHANG T Z, ZHANG F R, et al., 2021. Analysis on the spatiotemporal variability and driving factors of cultivated land fragmentation in the hilly region of eastern Gansu: A case of Wannian County of Jiangxi Province[J]. Research of Soil and Water Conservation, 28(3): 264-271, 280. | |
| [14] | 曹晨晨, 苏芳莉, 李海福, 等, 2022. 辽河口盐地碱蓬湿地景观破碎化及驱动机制[J]. 生态学报, 42(2): 581-589. |
| CAO C C, SU F L, LI H F, et al., 2022. Landscape fragmentation and driving mechanism of Suaeda Salsa Wetland in Liaohe Estuary[J]. Acta Ecologica Sinica, 42(2): 581-589. | |
| [15] | 陈万旭, 段斌俏, 曾杰, 2024. 1980-2020年中国耕地景观细碎化空间分异性与影响因素分析[J]. 农业工程学报, 40(21): 221-231. |
| CHEN W X, DUAN B Q, ZENG J, 2024. Spatial differentiation and influencing factors of cultivated landscape fragmentation in China from 1980 to 2020[J]. Transactions of Chinese Society of Agricultural Engineering, 40(21): 221-231. | |
| [16] | 高文晶, 程诺, 张露月, 等, 2024. 基于参数最优地理探测器的福建省植被NPP时空分异及驱动力探究[J]. 西北林学院学报, 39(4): 120-130. |
| GAO W J, CHENG N, ZHANG L Y, et al., 2024. Spatio-temporal differentiation and driving force of vegetation NPP in Fujian Province based on optimal parameter geographical detector[J]. Journal of Northwest Forestry University, 39(4): 120-130. | |
| [17] | 郭硕, 杨伟州, 魏明欢, 等, 2017. 基于地理加权回归的青龙满族自治县耕地细碎化及影响因子分析[J]. 水土保持研究, 24(3): 264-269. |
| GUO S, YANG W Z, WEI M H, et al., 2017. Cultivated land fragmentation and impact factors of Qinglong Manchu Autonomous County based on geographically weighted regression[J]. Research of Soil and Water Conservation, 24(3): 264-269. | |
| [18] | 郭少壮, 白红英, 孟清, 等, 2020. 秦岭地区林地与草地景观格局变化及其驱动因素[J]. 生态学报, 40(1): 130-140. |
| GUO S Z, BAI H Y, MENG Q, et al., 2020. Landscape pattern changes of woodland and grassland and its driving forces in Qinling Mountains[J]. Acta Ecologica Sinica, 40(1): 130-140. | |
| [19] | 雷越, 张学斌, 罗君, 等, 2023. 基于不同样带的干旱区城市景观格局时空演变特征——以张掖市为例[J]. 生态学报, 43(5): 2034-2048. |
| LEI Y, ZHANG X B, LUO J, et al., 2023. Spatio-temporal evolution of urban landscape pattern in arid areas based on different zones: A case study of Zhangye City[J]. Acta Ecologica Sinica, 43(5): 2034-2048. | |
| [20] | 梁加乐, 陈万旭, 李江风, 等, 2022. 黄河流域景观破碎化时空特征及其成因探测[J]. 生态学报, 42(5): 1993-2009. |
| LIANG J L, CHEN W X, LI J F, et al., 2022. Spatiotemporal patterns of landscape fragmentation and causes in the Yellow River basin[J]. Acta Ecologica Sinica, 42(5): 1993-2009. | |
| [21] | 刘凯, 杨琰瑛, 师荣光, 等, 2023. 1990-2020年于桥水库流域景观格局时空演变及驱动力[J]. 农业资源与环境学报, 40(1): 154-164. |
| LIU K, YANG Y Y, SHI R G, et al., 2023. Spatiotemporal changes and driving forces of landscape patterns in the Yuqiao Reservoir Watershed during 1990-2020[J]. Journal of Agriculture Resources and Environment, 40(1): 154-164. | |
| [22] | 李晓健, 马林兵. 2024. 基于参数最优地理探测器的粤东北耕地非农化特征与影响因素研究[J]. 水土保持通报, 44(5): 100-112. |
| LIU X J, MA B L, 2024. Characteristics and influencing factors of farmland conversion to non-agricultural uses in northeast Guangdong Province based on optimal parameter geographic detector[J]. Bulletin of Soil and Water Conservation, 44(5): 100-112. | |
| [23] | 罗芳, 潘安, 陈忠升, 等, 2021. 四川省宜宾市1980-2018年耕地时空格局变化及其驱动因素[J]. 水土保持通报, 41(6): 336-344. |
| LUO F, PAN A, CHEN Z S, et al., 2021. Spatiotemporal pattern change of cultivated land and its driving forces in Yibin City, Sichuan Province during 1980-2018[J]. Bulletin of Soil and Water Conservation, 41(6): 336-344. | |
| [24] | 马晶, 李鋆垚, 张亚球, 等, 2022. 基于移动窗口法的城市遥感生态质量评价研究[J]. 红外, 43(8): 44-52. |
| MA J, LI J Y, ZHANG Y Q, et al., 2022. Study on ecological quality evaluation of urban remote sensing based on mobile window method[J]. Infrared (Monthly), 43(8): 44-52. | |
| [25] | 施智勇, 谢慧黎, 王圳峰, 等, 2023. 基于参数最优地理探测器的福州市生境质量时空格局与驱动力分析[J]. 环境工程技术学报, 13(5): 1921-1930. |
| SHI Z Y, XIE H L, WANG Z F, et al., 2023. Analysis of spatiotemporal heterogeneity of habitat quality and their driving factors based on optimal parameters based geographic detector for Fuzhou City, China[J]. Journal of Environmental Engineering Technology, 13(5): 1921-1930. | |
| [26] |
王劲峰, 徐成东, 2017. 地理探测器: 原理与展望[J]. 地理学报, 72(1): 116-134.
DOI |
|
WANG J F, XU C D, 2017. Geodetector: Principle and prospective[J]. Acta Geographica Sinica, 72(1): 116-134.
DOI |
|
| [27] | 文高辉, 杨钢桥, 2019. 耕地细碎化对农地整治中农户权属调整意愿的影响研究[J]. 长江流域资源与环境, 28(3): 623-631. |
| WEN G H, YANG G Q, 2019. Impact of cultivated land fragmentation on farmers’ willingness to land ownership adjustment in rural land consolidation[J]. Resources and Environment in the Yangtze Basin, 28(3): 623-631. | |
| [28] | 熊畅, 吴卓, 曾梓瑶, 等, 2023. 基于 “空间形态-破碎化-聚集度” 的粤港澳大湾区森林景观格局时空演变[J]. 生态学报, 43(8): 3032-3044. |
| XIONG C, WU Z, ZENG Z Y, et al., 2023. Spatiotemporal evolution of forest landscape pattern in Guangdong-Hong Kong-Macao Greater Bay Area based on “Spatial Morphology-Fragmentation-Aggregation”[J]. Acta Ecologica Sinica, 43(8): 3032-3044. | |
| [29] | 臧亮, 梁红颖, 梁文涛, 等, 2018. 基于景观格局的卢龙县耕地细碎化评价及影响因素研究[J]. 水土保持研究, 25(6): 2651-269, 276. |
| ZANG L, LIANG H Y, LIANG W T, et al., 2018. Cultivated land fragmentation and affecting factors of Lulong County based on landscape pattern[J]. Research of Soil and Water Conservation, 25(6): 265-269, 276. | |
| [30] | 张星山, 杨恒, 马雯秋, 等, 2024. 基于景观格局的丘陵山区耕地生态风险评价——以重庆市潼南区为例[J]. 智慧农业(中英文), 6(3): 58-68. |
|
ZHANG X S, YANG H, MA W Q, et al., 2024. Ecological risk assessment of cultivated land based on landscape pattern: A case study of Tongnan District, Chongqing[J]. Smart Agriculture, 6(3): 58-68.
DOI |
|
| [31] | 周润芳, 孙建国, 张卓, 2020. 甘肃省榆中县地形对耕地分布影响[J]. 遥感信息, 35(4): 148-154. |
| ZHOU R F, SUN J G, ZHANG Z, 2020. Effect of topography on cultivated land distribution in Yuzhong County of Gansu Province[J]. Remote Sensing Information, 35(4): 148-154. |
| [1] | WANG Yue, YU Fudong, ZHANG Yue, XIANG Hengxing, YAN Hengqi, MAO Dehua. Multi-scenario Simulation of Landscape Pattern and Carbon Storage Changes in Northeast Black Soil Region Based on the PLUS-InVEST Model [J]. Ecology and Environmental Sciences, 2026, 35(2): 178-189. |
| [2] | MU Haofeng, SONG Zhelu, GAO Zhen, HOU Ying, CHEN Weiping. Temporal Dynamics and Influencing Factors of Urban PM2.5 Pollution Risk Based on Ecosystem Service Supply and Demand [J]. Ecology and Environmental Sciences, 2026, 35(2): 256-266. |
| [3] | SHI Hanzhi, CAO Yiran, LIU Fan, WU Zhichao, LI Furong, DENGTENG Haobo, XU Aiping, LI Dongqin, WEN Dian, WANG Xu. Study on the Regulation of Soil Lead Forms Transformation under the Combined Action of Straw and Bacteria [J]. Ecology and Environmental Sciences, 2026, 35(1): 155-166. |
| [4] | YANG Haoyu, HUANG Kangjiang, CHEN Xiaodong, ZHAO Jie, XIONG Jun, TIAN Kang. Evolution of Ecological Spatial Efficiency Pattern and Attribution Analysis of Landscape Pattern in Guizhou Province [J]. Ecology and Environmental Sciences, 2025, 34(6): 902-913. |
| [5] | HAO Xiaoyan, DONG Chao, XUE Yang, HAN Liping. Symbiotic Effects and Influencing Factors of Energy Supply and Ecological Security in Energy Endowment Advantageous Areas [J]. Ecology and Environmental Sciences, 2025, 34(6): 974-985. |
| [6] | LIU Honglin, ZHAO Fangkai, YANG Lei, SHEN Linjun, YANG Kaifeng, LI Min, CHEN Liding. Study on Heavy Metal Pollution in Urban Park Soil and Influencing Factors: A Case Study of Ningbo City [J]. Ecology and Environmental Sciences, 2025, 34(5): 773-783. |
| [7] | CHEN Jieru, YE Changsheng, WEI Wei, CAI Xin, WANG Lili. Analysis of “Production-Living-Ecological Space” Coupling Coordination and Influencing Factors in County Areas of Poyang Lake City Cluster [J]. Ecology and Environmental Sciences, 2025, 34(5): 807-818. |
| [8] | GUO Mingbin, GONG Jianzhou, WANG Lijuan, WANG Shikuan. Analysis of the Natural Dominant Factors Driving NO2 Concentration Changes in the Guangdong-Hong Kong-Macao Greater Bay Area from 2019 to 2023 [J]. Ecology and Environmental Sciences, 2025, 34(4): 534-547. |
| [9] | ZHANG Renfei, XIAO Meng, LIU Zhicheng. Spatio-temporal Heterogeneity and Driving Factors of Landscape Fragmentation in Beijing-Tianjin-Hebei Region [J]. Ecology and Environmental Sciences, 2025, 34(3): 461-473. |
| [10] | WANG Chunmei, JIANG Bingqi, HU Jun, CHEN Daiwen, HUANG Lihua, CHENG Wanwan. Multi-scale Variations and Influencing Factors of Total Radioactivity in Atmospheric Environment Around Nuclear Power Plants [J]. Ecology and Environmental Sciences, 2025, 34(12): 1900-1908. |
| [11] | LI Qingyun, XIAO Yimin, LIN Wei, LEI Jinrui, WANG Yunlei, KONG Meiman, YANG Yunfang. Remote Sensing Inversion of Water Quality Parameters and Their Correlation with Landscape Patterns in Haikou Changqin Lake Based on UAV Multispectral Data [J]. Ecology and Environmental Sciences, 2025, 34(12): 1930-1943. |
| [12] | XIA Yining, LIU Peng’ao, HE Kerun, TIAN Chaohui, ZENG Liting, HOU Kelun. Spatiotemporal Dynamics and Scenario Simulations of Ecosystem Carbon Storage Based on Land Use Changes in the Changsha-Zhuzhou-Xiangtan Metropolitan Area [J]. Ecology and Environmental Sciences, 2025, 34(11): 1661-1674. |
| [13] | WANG Zongyang, ZENG Xuelan, ZHU Zhenchang, GUO Fen, LUO Lijuan, ZHANG Wuying, DU Qingping, ZHANG Yuan. Spatial Distribution and Driving Mechanisms of Vegetation and Soil Carbon Density in the Mangrove Ecosystem of Zhanjiang City [J]. Ecology and Environmental Sciences, 2025, 34(11): 1705-1714. |
| [14] | ZHANG Weichen, WANG Xingqi, WANG Bojie. Spatiotemporal Pattern and Influencing Factors of the Ecosystem Services in the Tabu River Basin [J]. Ecology and Environmental Sciences, 2024, 33(7): 1142-1152. |
| [15] | LI Cheng, CHENG Zhipeng, LIU Yujin, YAO Yiming, LI Chunlei. Research on Ecological Risks and Its Control Policies of Per- and Polyfluoroalkyl Substances [J]. Ecology and Environmental Sciences, 2024, 33(6): 980-996. |
| Viewed | ||||||
|
Full text |
|
|||||
|
Abstract |
|
|||||
Copyright © 2021 Editorial Office of ACTA PETROLEI SINICA
Address:No. 6 Liupukang Street, Xicheng District, Beijing, P.R.China, 510650
Tel: 86-010-62067128, 86-010-62067137, 86-010-62067139
Fax: 86-10-62067130
Email: syxb@cnpc.com.cn
Support byBeijing Magtech Co.ltd, E-mail:support@magtech.com.cn