Ecology and Environmental Sciences ›› 2025, Vol. 34 ›› Issue (6): 974-985.DOI: 10.16258/j.cnki.1674-5906.2025.06.014
• Research Article [Environmental Science] • Previous Articles Next Articles
HAO Xiaoyan1,2( ), DONG Chao1,2, XUE Yang1,2,*(), HAN Liping1,2
Received:2024-09-15
Online:2025-06-18
Published:2025-06-11
郝晓燕1,2(), 董超1,2, 薛阳1,2,*(), 韩丽萍1,2
通讯作者:
* 薛阳, E-mail: 作者简介:郝晓燕(1973年生),女,教授,博士,研究方向为区域经济增长、产业安全规制、能源经济评价。E-mail: haoxiaoyanyan@163.com
基金资助:CLC Number:
HAO Xiaoyan, DONG Chao, XUE Yang, HAN Liping. Symbiotic Effects and Influencing Factors of Energy Supply and Ecological Security in Energy Endowment Advantageous Areas[J]. Ecology and Environmental Sciences, 2025, 34(6): 974-985.
郝晓燕, 董超, 薛阳, 韩丽萍. 能源禀赋优势区能源供给与生态安全共生效应及影响因素[J]. 生态环境学报, 2025, 34(6): 974-985.
Add to citation manager EndNote|Ris|BibTeX
URL: https://www.jeesci.com/EN/10.16258/j.cnki.1674-5906.2025.06.014
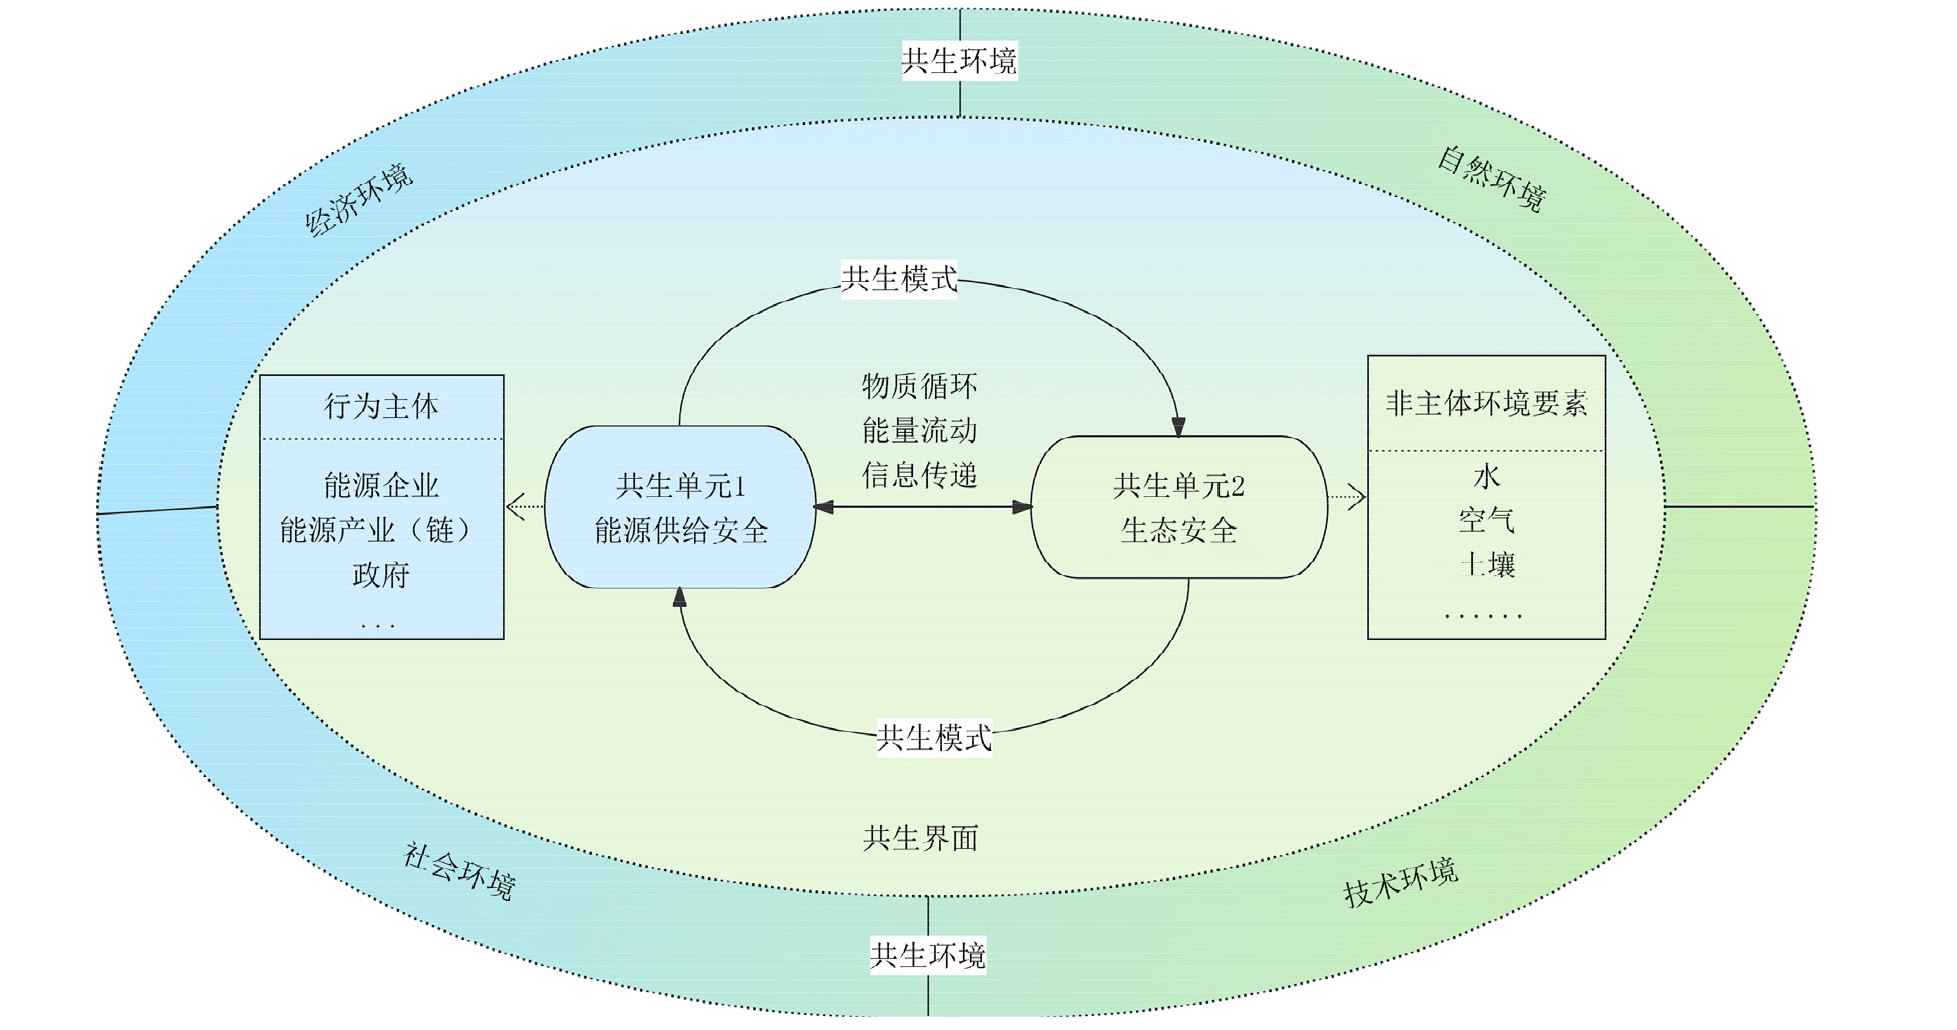
Figure 1 Theoretical framework of symbiotic system of energy supply security and ecological security
| 共生单元 | 维度 | 指标 | 赋值方法 | 权重 | 参考依据 |
|---|---|---|---|---|---|
| 能源供给安全 | 能源可获得性 | 人均能源生产量 | 区域一次能源生产总量/区域常住人口数量 | 0.197 | 薛静静等, |
| 能源自给率 | 区域一次能源生产总量/区域能源消费总量 | 0.134 | 薛静静等, | ||
| 省域能源产量占 中国总产量比例 | 区域一次能源生产总量/中国一次能源生产总量 | 0.163 | 薛静静等, | ||
| 能源结构稳定性 | 火电发电比例 | 区域火电发电量/区域发电量 | 0.023 | 李斌等, | |
| 新能源发电比例 | (区域风力发电量+区域太阳能发电量)/区域发电量 | 0.070 | 陈黎明等, | ||
| 火电装机比重 | 区域火电装机容量/区域发电装机容量合计 | 0.023 | 张展鹏等, | ||
| 新能源装机比重 | (区域风力发电装机容量+区域太阳能发电装机容量)/区域发电装机容量合计 | 0.049 | 李响等, | ||
| 能源可支付性 | 燃料消费 价格指数 | 燃料商品零售价格指数 | 0.019 | 孙才志等, | |
| 能源 效率性 | 能源消费强度 | 一个国家或地区在一定时期内能源消费总量与国内生产总值(GDP)之比 | 0.014 | 薛静静等, | |
| 生态安全 | “三废”排放 | 废水中工业氨氮 排放总量 | 0.004 | 孙亚男等, | |
| 工业二氧化硫 排放量 | 0.019 | 张雪薇等, | |||
| 工业氮氧化物 排放量 | 0.011 | 张敏等, | |||
| 一般工业固体 废物产生量 | 0.012 | 张敏等, | |||
| 环境治理 | 工业污染治理投资总额 | 0.102 | 金永杰等, | ||
| 一般工业固体废物综合利用量 | 0.064 | 菅利荣等, | |||
| 城市污水处理率 | 0.004 | 王礼刚, | |||
| 生活垃圾 无害化处理率 | 0.003 | 王礼刚, | |||
| 环境建设 | 人均公园绿地面积 | 0.025 | 贺小荣等, | ||
| 建成区绿化覆盖率 | 0.017 | 胡宗义等, | |||
| 森林覆盖率 | 0.047 | 胡宗义等, |
Table 1 Comprehensive evaluation index system for the symbiotic relationship between energy supply security and ecological security
| 共生单元 | 维度 | 指标 | 赋值方法 | 权重 | 参考依据 |
|---|---|---|---|---|---|
| 能源供给安全 | 能源可获得性 | 人均能源生产量 | 区域一次能源生产总量/区域常住人口数量 | 0.197 | 薛静静等, |
| 能源自给率 | 区域一次能源生产总量/区域能源消费总量 | 0.134 | 薛静静等, | ||
| 省域能源产量占 中国总产量比例 | 区域一次能源生产总量/中国一次能源生产总量 | 0.163 | 薛静静等, | ||
| 能源结构稳定性 | 火电发电比例 | 区域火电发电量/区域发电量 | 0.023 | 李斌等, | |
| 新能源发电比例 | (区域风力发电量+区域太阳能发电量)/区域发电量 | 0.070 | 陈黎明等, | ||
| 火电装机比重 | 区域火电装机容量/区域发电装机容量合计 | 0.023 | 张展鹏等, | ||
| 新能源装机比重 | (区域风力发电装机容量+区域太阳能发电装机容量)/区域发电装机容量合计 | 0.049 | 李响等, | ||
| 能源可支付性 | 燃料消费 价格指数 | 燃料商品零售价格指数 | 0.019 | 孙才志等, | |
| 能源 效率性 | 能源消费强度 | 一个国家或地区在一定时期内能源消费总量与国内生产总值(GDP)之比 | 0.014 | 薛静静等, | |
| 生态安全 | “三废”排放 | 废水中工业氨氮 排放总量 | 0.004 | 孙亚男等, | |
| 工业二氧化硫 排放量 | 0.019 | 张雪薇等, | |||
| 工业氮氧化物 排放量 | 0.011 | 张敏等, | |||
| 一般工业固体 废物产生量 | 0.012 | 张敏等, | |||
| 环境治理 | 工业污染治理投资总额 | 0.102 | 金永杰等, | ||
| 一般工业固体废物综合利用量 | 0.064 | 菅利荣等, | |||
| 城市污水处理率 | 0.004 | 王礼刚, | |||
| 生活垃圾 无害化处理率 | 0.003 | 王礼刚, | |||
| 环境建设 | 人均公园绿地面积 | 0.025 | 贺小荣等, | ||
| 建成区绿化覆盖率 | 0.017 | 胡宗义等, | |||
| 森林覆盖率 | 0.047 | 胡宗义等, |
| α取值 | 共生关系类别 | 共生关系特征 |
|---|---|---|
| αab=αba,αab>0,αba>0 αab≠αba,αab>0,αba>0 | 正向共生 | 能源供给安全与生态安全为正向对称互惠共生关系 能源供给安全与生态安全为正向非对称互惠共生关系 |
| αab=αba,αab<0,αba<0 αab≠αba,αab<0,αba<0 | 反向共生 | 能源供给安全与生态安全为反向对称共生关系 能源供给安全与生态安全为反向非对称共生关系 |
| αab>0,αba=0;αba>0,αab=0 | 正向偏利共生 | 共生度为正值的为受益方,共生度值为零的为非受益方 |
| αab<0,αba=0;αba<0,αab=0 | 反向偏利共生 | 共生度为负值的为受害方,共生度值为零的为非受害方 |
| αab=0,αba=0 | 并生 | 不存在共生关系,独立发展 |
| αab×αba<0 | 寄生 | 共生度为正值的是受益方,共生度为负值的是受害方 |
Table 2 Basis for determining the type of symbiotic relationship
| α取值 | 共生关系类别 | 共生关系特征 |
|---|---|---|
| αab=αba,αab>0,αba>0 αab≠αba,αab>0,αba>0 | 正向共生 | 能源供给安全与生态安全为正向对称互惠共生关系 能源供给安全与生态安全为正向非对称互惠共生关系 |
| αab=αba,αab<0,αba<0 αab≠αba,αab<0,αba<0 | 反向共生 | 能源供给安全与生态安全为反向对称共生关系 能源供给安全与生态安全为反向非对称共生关系 |
| αab>0,αba=0;αba>0,αab=0 | 正向偏利共生 | 共生度为正值的为受益方,共生度值为零的为非受益方 |
| αab<0,αba=0;αba<0,αab=0 | 反向偏利共生 | 共生度为负值的为受害方,共生度值为零的为非受害方 |
| αab=0,αba=0 | 并生 | 不存在共生关系,独立发展 |
| αab×αba<0 | 寄生 | 共生度为正值的是受益方,共生度为负值的是受害方 |
| 取值结果 | 特征 |
|---|---|
| θab=θba=0.5 | 能源供给安全与生态安全彼此间的影响相同 |
| θab×θba=0 | 能源供给安全与生态安全仅有一方对另一方有影响 |
| 0<θba<θab<1 | 能源供给安全对生态安全的影响小于生态安全对能源供给安全的影响 |
| 0<θab<θba<1 | 能源供给安全对生态安全的影响大于生态安全对能源供给安全的影响 |
Table 3 Basis for determining the interaction between energy supply security and ecological security
| 取值结果 | 特征 |
|---|---|
| θab=θba=0.5 | 能源供给安全与生态安全彼此间的影响相同 |
| θab×θba=0 | 能源供给安全与生态安全仅有一方对另一方有影响 |
| 0<θba<θab<1 | 能源供给安全对生态安全的影响小于生态安全对能源供给安全的影响 |
| 0<θab<θba<1 | 能源供给安全对生态安全的影响大于生态安全对能源供给安全的影响 |
| 地区 | 年份 | 均值 | ||||||||||||||
|---|---|---|---|---|---|---|---|---|---|---|---|---|---|---|---|---|
| 2017 | 2018 | 2019 | 2020 | 2021 | ||||||||||||
| αab | αba | αab | αba | αab | αba | αab | αba | αab | αba | αab | αba | |||||
| 京 | 0.833 | 1.200 | −0.211 | −4.742 | −19.729 | −0.051 | −15.918 | −0.063 | −40.587 | −0.025 | −15.122 | −0.736 | ||||
| 津 | 0.726 | 1.377 | −0.103 | −9.732 | 1.209 | 0.827 | −1.907 | −0.524 | 0.734 | 1.362 | 0.132 | −1.338 | ||||
| 冀 | 1.309 | 0.764 | 0.068 | 14.703 | −0.350 | −2.854 | −1.328 | −0.753 | 1.330 | 0.752 | 0.206 | 2.523 | ||||
| 晋 | 1.252 | 0.799 | −4.147 | −0.241 | 0.485 | 2.060 | −2.274 | −0.440 | −1.000 | −1.000 | −1.137 | 0.236 | ||||
| 蒙 | 1.005 | 0.995 | −0.115 | −8.660 | −1.338 | −0.747 | −1.490 | −0.671 | 1.638 | 0.610 | −0.060 | −1.695 | ||||
| 辽 | 1.072 | 0.932 | −0.707 | −1.415 | 0.826 | 1.211 | 0.323 | 3.098 | −0.887 | −1.128 | 0.126 | 0.540 | ||||
| 吉 | 1.093 | 0.915 | 1.589 | 0.629 | 0.856 | 1.168 | −7.235 | −0.138 | −0.968 | −1.034 | −0.933 | 0.308 | ||||
| 黑 | 0.952 | 1.051 | −0.021 | −46.766 | −1.598 | −0.626 | 2.751 | 0.363 | −0.268 | −3.729 | 0.363 | −9.941 | ||||
| 沪 | 0.856 | 1.169 | −0.144 | −6.927 | 0.473 | 2.112 | −0.322 | −3.104 | −3.453 | −0.290 | −0.518 | −1.408 | ||||
| 苏 | 1.008 | 0.992 | 0.223 | 4.487 | −0.953 | −1.050 | 1.331 | 0.751 | 0.155 | 6.452 | 0.353 | 2.327 | ||||
| 浙 | 0.867 | 1.153 | 3.557 | 0.281 | 13.583 | 0.074 | 0.507 | 1.972 | 0.394 | 2.540 | 3.781 | 1.204 | ||||
| 皖 | 0.765 | 1.307 | −4.009 | −0.249 | 0.580 | 1.724 | −0.209 | −4.787 | 83.704 | 0.012 | 16.166 | −0.399 | ||||
| 闽 | 0.930 | 1.075 | 0.147 | 6.823 | −12.553 | −0.080 | 2.191 | 0.456 | 16.078 | 0.062 | 1.359 | 1.667 | ||||
| 赣 | 0.956 | 1.047 | 0.356 | 2.806 | 5.709 | 0.175 | −3.219 | −0.311 | −1.883 | −0.531 | 0.384 | 0.637 | ||||
| 鲁 | 1.117 | 0.896 | 0.002 | 446.593 | 0.147 | 6.822 | −0.219 | −4.565 | 1.173 | 0.853 | 0.444 | 90.120 | ||||
| 豫 | 0.787 | 1.271 | −0.562 | −1.779 | 1.136 | 0.881 | −0.467 | −2.142 | −0.199 | −5.023 | 0.139 | −1.358 | ||||
| 鄂 | 0.773 | 1.294 | 1.871 | 0.534 | 1.563 | 0.640 | 1.937 | 0.516 | 19.710 | 0.051 | 5.171 | 0.607 | ||||
| 湘 | 0.901 | 1.110 | 1.907 | 0.525 | 3.000 | 0.333 | −1.240 | −0.806 | −0.493 | −2.028 | 0.815 | −0.173 | ||||
| 粤 | 1.018 | 0.982 | −0.243 | −4.108 | 3.626 | 0.276 | −1.075 | −0.931 | −0.916 | −1.092 | 0.482 | −0.975 | ||||
| 桂 | 0.892 | 1.122 | 3.540 | 0.283 | 3.708 | 0.270 | 10.046 | 0.100 | 3.574 | 0.280 | 4.352 | 0.411 | ||||
| 琼 | 1.089 | 0.918 | −3.215 | −0.311 | 4.232 | 0.236 | 2.642 | 0.378 | −7.248 | −0.138 | −0.500 | 0.217 | ||||
| 渝 | 0.776 | 1.288 | −0.006 | −155.237 | −57.021 | −0.018 | 2.113 | 0.473 | 13.260 | 0.075 | −8.176 | −30.683 | ||||
| 川 | 0.540 | 1.852 | −0.200 | −5.002 | 4.863 | 0.206 | 0.255 | 3.928 | −2.478 | −0.404 | 0.596 | 0.116 | ||||
| 贵 | 0.854 | 1.171 | −0.273 | −3.665 | 0.447 | 2.239 | 0.455 | 2.197 | 4.606 | 0.217 | 1.218 | 0.432 | ||||
| 云 | 0.930 | 1.075 | 0.214 | 4.667 | 1.340 | 0.746 | −0.229 | −4.360 | 12.944 | 0.077 | 3.040 | 0.441 | ||||
| 陕 | 0.578 | 1.730 | −22.502 | −0.044 | −0.036 | −27.748 | 2.482 | 0.403 | 0.650 | 1.539 | −3.766 | −4.824 | ||||
| 甘 | 1.155 | 0.866 | −0.564 | −1.773 | 0.759 | 1.317 | 0.866 | 1.155 | −0.837 | −1.195 | 0.276 | 0.074 | ||||
| 青 | 1.085 | 0.922 | 4.929 | 0.203 | 2.162 | 0.462 | −1.080 | −0.926 | 0.360 | 2.780 | 1.491 | 0.688 | ||||
| 宁 | 1.019 | 0.982 | 0.243 | 4.121 | 0.023 | 42.912 | 1.065 | 0.939 | 5.407 | 0.185 | 1.551 | 9.828 | ||||
| 新 | 0.938 | 1.066 | 0.329 | 3.040 | 0.789 | 1.268 | −0.435 | −2.297 | 0.170 | 5.888 | 0.358 | 1.793 | ||||
Table 4 Calculation of the degree of coexistence 2017?2021
| 地区 | 年份 | 均值 | ||||||||||||||
|---|---|---|---|---|---|---|---|---|---|---|---|---|---|---|---|---|
| 2017 | 2018 | 2019 | 2020 | 2021 | ||||||||||||
| αab | αba | αab | αba | αab | αba | αab | αba | αab | αba | αab | αba | |||||
| 京 | 0.833 | 1.200 | −0.211 | −4.742 | −19.729 | −0.051 | −15.918 | −0.063 | −40.587 | −0.025 | −15.122 | −0.736 | ||||
| 津 | 0.726 | 1.377 | −0.103 | −9.732 | 1.209 | 0.827 | −1.907 | −0.524 | 0.734 | 1.362 | 0.132 | −1.338 | ||||
| 冀 | 1.309 | 0.764 | 0.068 | 14.703 | −0.350 | −2.854 | −1.328 | −0.753 | 1.330 | 0.752 | 0.206 | 2.523 | ||||
| 晋 | 1.252 | 0.799 | −4.147 | −0.241 | 0.485 | 2.060 | −2.274 | −0.440 | −1.000 | −1.000 | −1.137 | 0.236 | ||||
| 蒙 | 1.005 | 0.995 | −0.115 | −8.660 | −1.338 | −0.747 | −1.490 | −0.671 | 1.638 | 0.610 | −0.060 | −1.695 | ||||
| 辽 | 1.072 | 0.932 | −0.707 | −1.415 | 0.826 | 1.211 | 0.323 | 3.098 | −0.887 | −1.128 | 0.126 | 0.540 | ||||
| 吉 | 1.093 | 0.915 | 1.589 | 0.629 | 0.856 | 1.168 | −7.235 | −0.138 | −0.968 | −1.034 | −0.933 | 0.308 | ||||
| 黑 | 0.952 | 1.051 | −0.021 | −46.766 | −1.598 | −0.626 | 2.751 | 0.363 | −0.268 | −3.729 | 0.363 | −9.941 | ||||
| 沪 | 0.856 | 1.169 | −0.144 | −6.927 | 0.473 | 2.112 | −0.322 | −3.104 | −3.453 | −0.290 | −0.518 | −1.408 | ||||
| 苏 | 1.008 | 0.992 | 0.223 | 4.487 | −0.953 | −1.050 | 1.331 | 0.751 | 0.155 | 6.452 | 0.353 | 2.327 | ||||
| 浙 | 0.867 | 1.153 | 3.557 | 0.281 | 13.583 | 0.074 | 0.507 | 1.972 | 0.394 | 2.540 | 3.781 | 1.204 | ||||
| 皖 | 0.765 | 1.307 | −4.009 | −0.249 | 0.580 | 1.724 | −0.209 | −4.787 | 83.704 | 0.012 | 16.166 | −0.399 | ||||
| 闽 | 0.930 | 1.075 | 0.147 | 6.823 | −12.553 | −0.080 | 2.191 | 0.456 | 16.078 | 0.062 | 1.359 | 1.667 | ||||
| 赣 | 0.956 | 1.047 | 0.356 | 2.806 | 5.709 | 0.175 | −3.219 | −0.311 | −1.883 | −0.531 | 0.384 | 0.637 | ||||
| 鲁 | 1.117 | 0.896 | 0.002 | 446.593 | 0.147 | 6.822 | −0.219 | −4.565 | 1.173 | 0.853 | 0.444 | 90.120 | ||||
| 豫 | 0.787 | 1.271 | −0.562 | −1.779 | 1.136 | 0.881 | −0.467 | −2.142 | −0.199 | −5.023 | 0.139 | −1.358 | ||||
| 鄂 | 0.773 | 1.294 | 1.871 | 0.534 | 1.563 | 0.640 | 1.937 | 0.516 | 19.710 | 0.051 | 5.171 | 0.607 | ||||
| 湘 | 0.901 | 1.110 | 1.907 | 0.525 | 3.000 | 0.333 | −1.240 | −0.806 | −0.493 | −2.028 | 0.815 | −0.173 | ||||
| 粤 | 1.018 | 0.982 | −0.243 | −4.108 | 3.626 | 0.276 | −1.075 | −0.931 | −0.916 | −1.092 | 0.482 | −0.975 | ||||
| 桂 | 0.892 | 1.122 | 3.540 | 0.283 | 3.708 | 0.270 | 10.046 | 0.100 | 3.574 | 0.280 | 4.352 | 0.411 | ||||
| 琼 | 1.089 | 0.918 | −3.215 | −0.311 | 4.232 | 0.236 | 2.642 | 0.378 | −7.248 | −0.138 | −0.500 | 0.217 | ||||
| 渝 | 0.776 | 1.288 | −0.006 | −155.237 | −57.021 | −0.018 | 2.113 | 0.473 | 13.260 | 0.075 | −8.176 | −30.683 | ||||
| 川 | 0.540 | 1.852 | −0.200 | −5.002 | 4.863 | 0.206 | 0.255 | 3.928 | −2.478 | −0.404 | 0.596 | 0.116 | ||||
| 贵 | 0.854 | 1.171 | −0.273 | −3.665 | 0.447 | 2.239 | 0.455 | 2.197 | 4.606 | 0.217 | 1.218 | 0.432 | ||||
| 云 | 0.930 | 1.075 | 0.214 | 4.667 | 1.340 | 0.746 | −0.229 | −4.360 | 12.944 | 0.077 | 3.040 | 0.441 | ||||
| 陕 | 0.578 | 1.730 | −22.502 | −0.044 | −0.036 | −27.748 | 2.482 | 0.403 | 0.650 | 1.539 | −3.766 | −4.824 | ||||
| 甘 | 1.155 | 0.866 | −0.564 | −1.773 | 0.759 | 1.317 | 0.866 | 1.155 | −0.837 | −1.195 | 0.276 | 0.074 | ||||
| 青 | 1.085 | 0.922 | 4.929 | 0.203 | 2.162 | 0.462 | −1.080 | −0.926 | 0.360 | 2.780 | 1.491 | 0.688 | ||||
| 宁 | 1.019 | 0.982 | 0.243 | 4.121 | 0.023 | 42.912 | 1.065 | 0.939 | 5.407 | 0.185 | 1.551 | 9.828 | ||||
| 新 | 0.938 | 1.066 | 0.329 | 3.040 | 0.789 | 1.268 | −0.435 | −2.297 | 0.170 | 5.888 | 0.358 | 1.793 | ||||
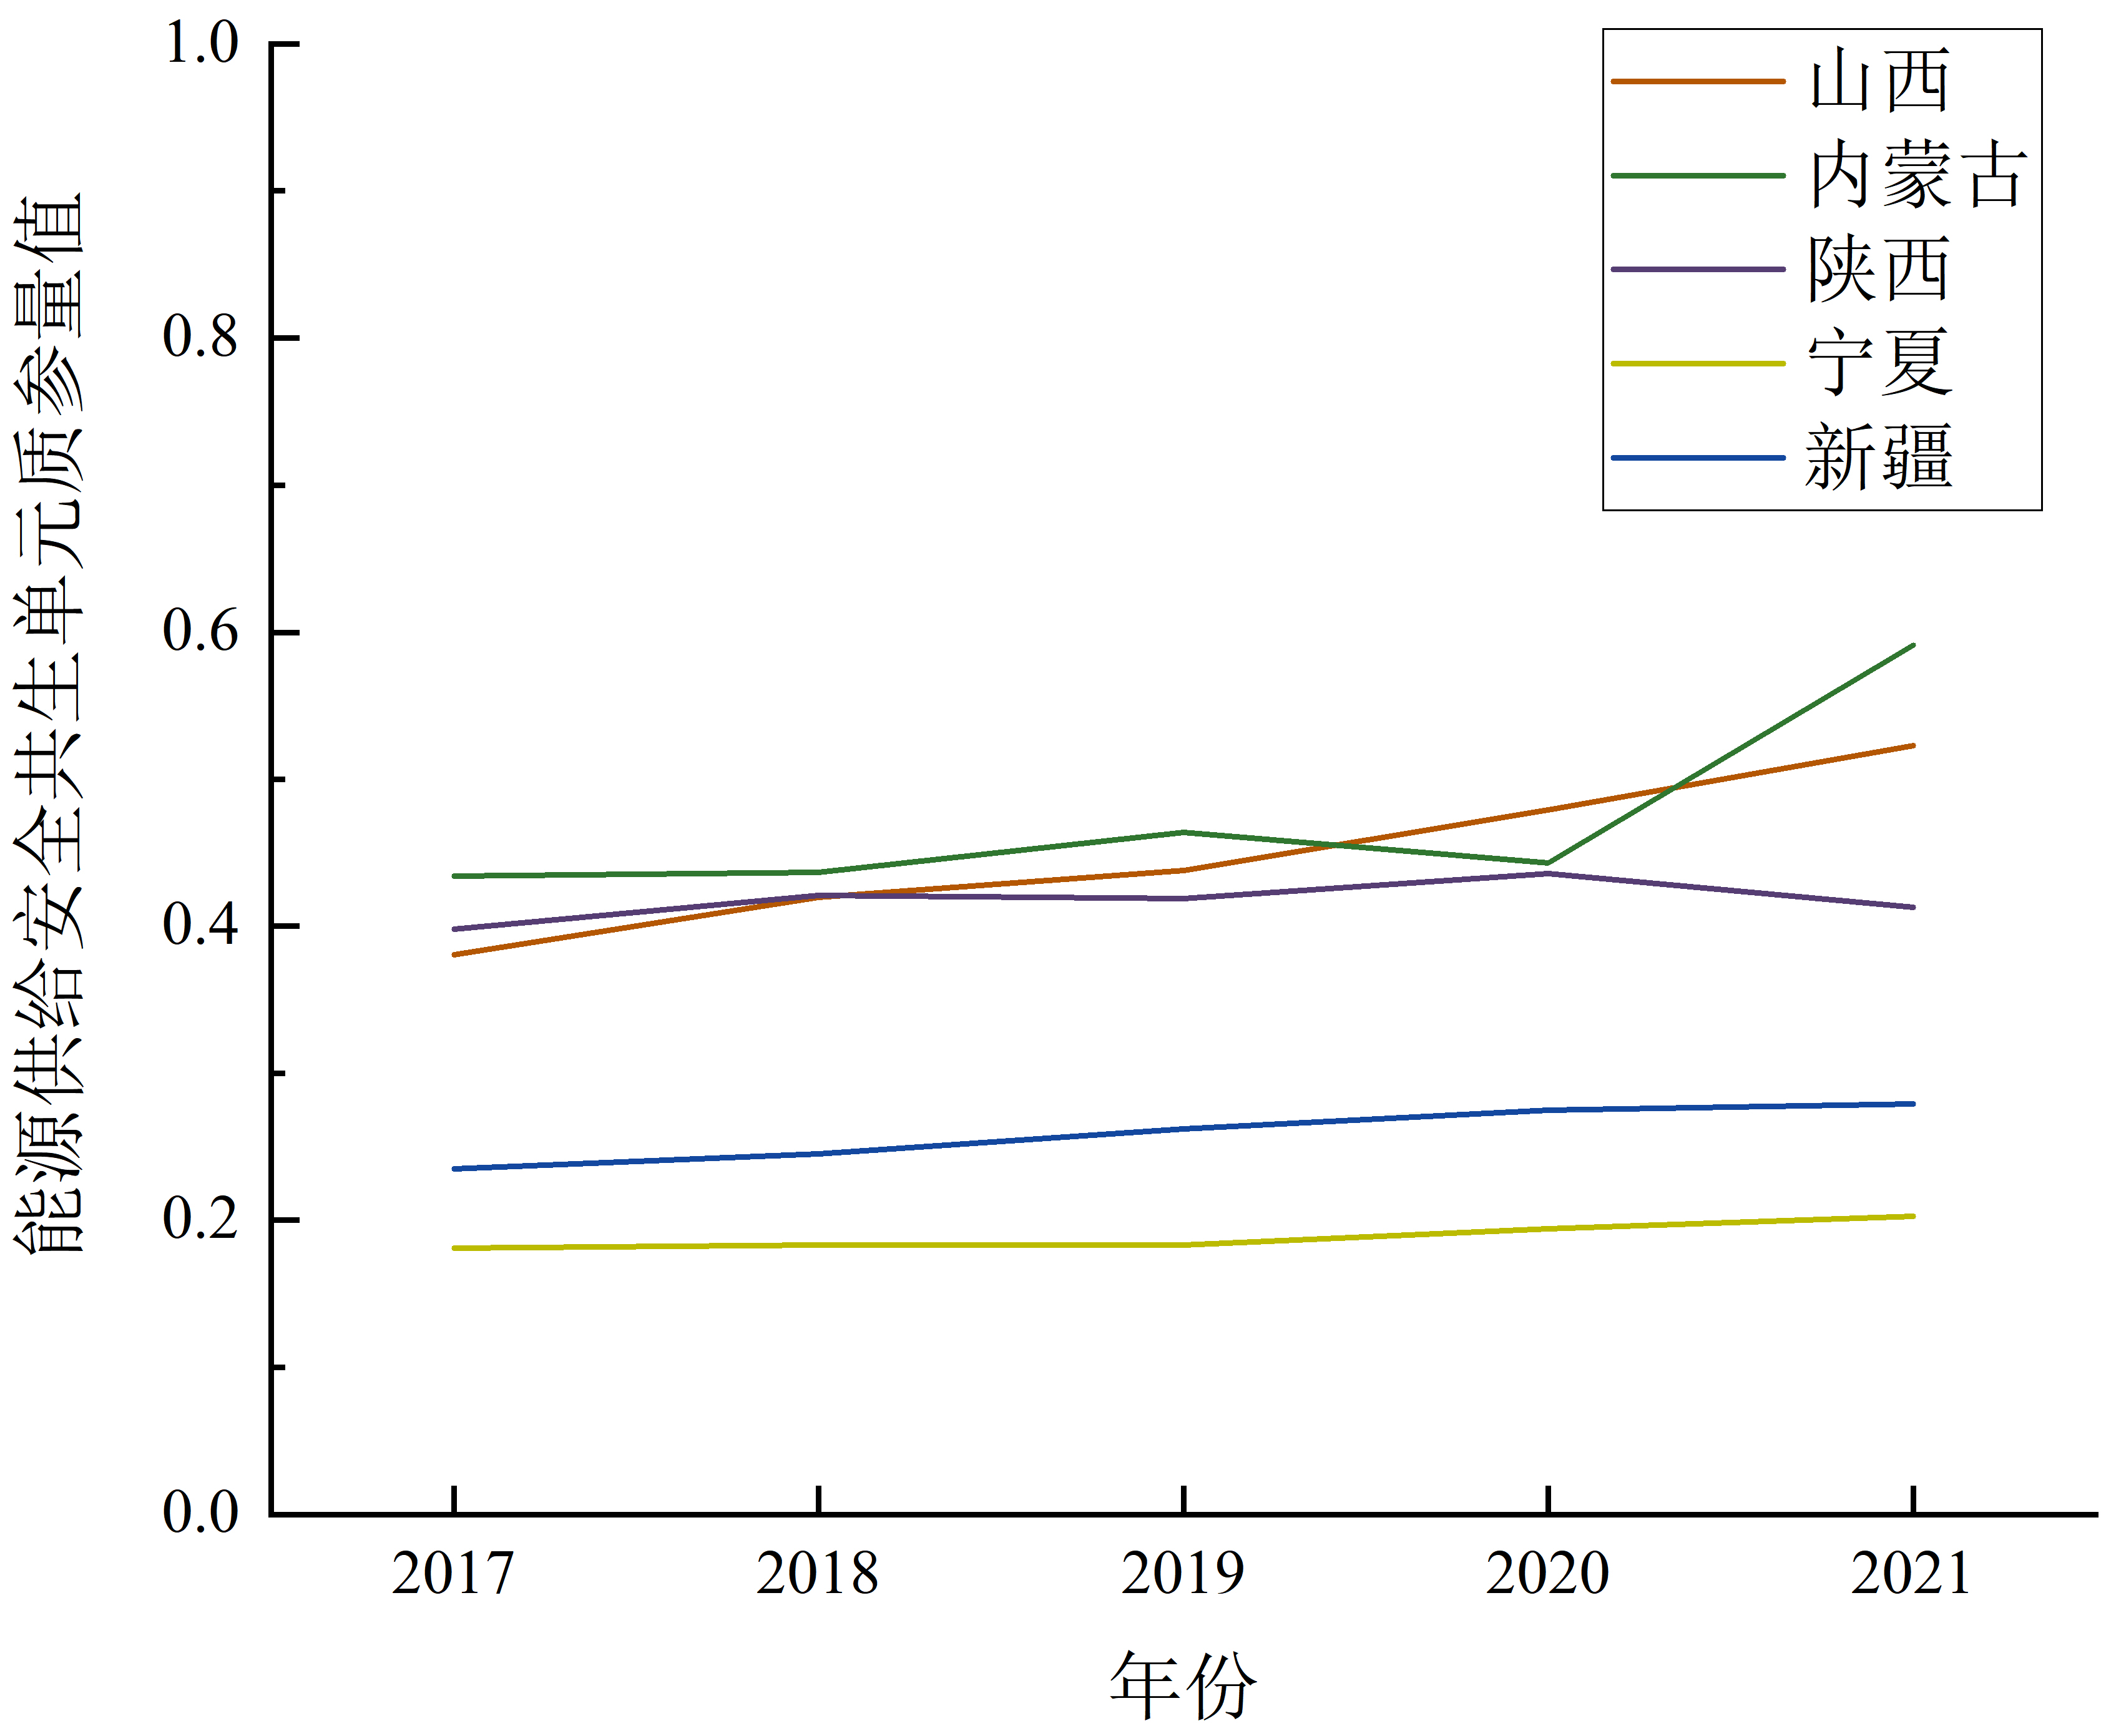
Figure 2 Quality coefficient of security of energy supply in regions with superior energy endowments Za
| 共生单元 | 地区 | 年份 | 均值 | ||||||||||||||
|---|---|---|---|---|---|---|---|---|---|---|---|---|---|---|---|---|---|
| 2017 | 2018 | 2019 | 2020 | 2021 | |||||||||||||
| αab | αba | αab | αba | αab | αba | αab | αba | αab | αba | αab | αba | ||||||
| 能源禀赋 优势区域 | 蒙 | 1.005 | 0.995 | −0.115 | −8.660 | −1.338 | −0.747 | −1.490 | −0.671 | 1.638 | 0.610 | −0.060 | −1.695 | ||||
| 近似正向对称 互惠共生关系 | 反向非对称 共生关系 | 反向非对称 共生关系 | 反向非对称 共生关系 | 正向非对称互惠共生关系 | 反向非对称 共生关系 | ||||||||||||
| 晋 | 1.252 | 0.799 | −4.147 | −0.241 | 0.485 | 2.060 | −2.274 | −0.440 | −1.000 | −1.000 | −1.137 | 0.236 | |||||
| 正向非对称互惠共生关系 | 反向非对称 共生关系 | 正向非对称互惠 共生关系 | 反向非对称 共生关系 | 反向对称 共生关系 | 寄生关系 | ||||||||||||
| 陕 | 0.578 | 1.730 | −22.502 | −0.044 | −0.036 | −27.748 | 2.482 | 0.403 | 0.650 | 1.539 | −3.766 | −4.824 | |||||
| 正向非对称互惠共生关系 | 近似反向偏利 共生关系 | 近似反向偏利 共生关系 | 正向非对称互惠 共生关系 | 正向非对称互惠共生关系 | 反向非对称 共生关系 | ||||||||||||
| 新 | 0.938 | 1.066 | 0.329 | 3.040 | 0.789 | 1.268 | −0.435 | −2.297 | 0.170 | 5.888 | 0.358 | 1.793 | |||||
| 正向非对称互惠共生关系 | 正向非对称互惠 共生关系 | 正向非对称互惠 共生关系 | 反向非对称 共生关系 | 正向非对称互惠共生关系 | 正向非对称互惠 共生关系 | ||||||||||||
| 宁 | 1.019 | 0.982 | 0.243 | 4.121 | 0.023 | 42.912 | 1.065 | 0.939 | 5.407 | 0.185 | 1.551 | 9.828 | |||||
| 近似正向对称互惠共生关系 | 正向非对称互惠 共生关系 | 近似正向偏利 共生关系 | 正向非对称互惠 共生关系 | 正向非对称互惠共生关系 | 正向非对称互惠 共生关系 | ||||||||||||
Table 5 Symbiotic patterns in regions with superior energy endowments, 2017?2021
| 共生单元 | 地区 | 年份 | 均值 | ||||||||||||||
|---|---|---|---|---|---|---|---|---|---|---|---|---|---|---|---|---|---|
| 2017 | 2018 | 2019 | 2020 | 2021 | |||||||||||||
| αab | αba | αab | αba | αab | αba | αab | αba | αab | αba | αab | αba | ||||||
| 能源禀赋 优势区域 | 蒙 | 1.005 | 0.995 | −0.115 | −8.660 | −1.338 | −0.747 | −1.490 | −0.671 | 1.638 | 0.610 | −0.060 | −1.695 | ||||
| 近似正向对称 互惠共生关系 | 反向非对称 共生关系 | 反向非对称 共生关系 | 反向非对称 共生关系 | 正向非对称互惠共生关系 | 反向非对称 共生关系 | ||||||||||||
| 晋 | 1.252 | 0.799 | −4.147 | −0.241 | 0.485 | 2.060 | −2.274 | −0.440 | −1.000 | −1.000 | −1.137 | 0.236 | |||||
| 正向非对称互惠共生关系 | 反向非对称 共生关系 | 正向非对称互惠 共生关系 | 反向非对称 共生关系 | 反向对称 共生关系 | 寄生关系 | ||||||||||||
| 陕 | 0.578 | 1.730 | −22.502 | −0.044 | −0.036 | −27.748 | 2.482 | 0.403 | 0.650 | 1.539 | −3.766 | −4.824 | |||||
| 正向非对称互惠共生关系 | 近似反向偏利 共生关系 | 近似反向偏利 共生关系 | 正向非对称互惠 共生关系 | 正向非对称互惠共生关系 | 反向非对称 共生关系 | ||||||||||||
| 新 | 0.938 | 1.066 | 0.329 | 3.040 | 0.789 | 1.268 | −0.435 | −2.297 | 0.170 | 5.888 | 0.358 | 1.793 | |||||
| 正向非对称互惠共生关系 | 正向非对称互惠 共生关系 | 正向非对称互惠 共生关系 | 反向非对称 共生关系 | 正向非对称互惠共生关系 | 正向非对称互惠 共生关系 | ||||||||||||
| 宁 | 1.019 | 0.982 | 0.243 | 4.121 | 0.023 | 42.912 | 1.065 | 0.939 | 5.407 | 0.185 | 1.551 | 9.828 | |||||
| 近似正向对称互惠共生关系 | 正向非对称互惠 共生关系 | 近似正向偏利 共生关系 | 正向非对称互惠 共生关系 | 正向非对称互惠共生关系 | 正向非对称互惠 共生关系 | ||||||||||||
| 共生单元 | 代表地区 | 年份 | 均值 | ||||
|---|---|---|---|---|---|---|---|
| 2017 | 2018 | 2019 | 2020 | 2021 | |||
| θab | θab | θab | θab | θab | θab | ||
| 能源禀赋 优势区域 | 内蒙古 | 0.502 | 0.013 | 0.642 | 0.689 | 0.729 | 0.515 |
| 山西 | 0.611 | 0.945 | 0.191 | 0.838 | 0.500 | 0.617 | |
| 陕西 | 0.250 | 0.998 | 0.001 | 0.860 | 0.297 | 0.481 | |
| 新疆 | 0.468 | 0.098 | 0.384 | 0.159 | 0.028 | 0.227 | |
| 宁夏 | 0.509 | 0.056 | 0.001 | 0.532 | 0.967 | 0.413 | |
Table 6 Coefficients of coefficients for regions with superior energy endowments, 2017?2021
| 共生单元 | 代表地区 | 年份 | 均值 | ||||
|---|---|---|---|---|---|---|---|
| 2017 | 2018 | 2019 | 2020 | 2021 | |||
| θab | θab | θab | θab | θab | θab | ||
| 能源禀赋 优势区域 | 内蒙古 | 0.502 | 0.013 | 0.642 | 0.689 | 0.729 | 0.515 |
| 山西 | 0.611 | 0.945 | 0.191 | 0.838 | 0.500 | 0.617 | |
| 陕西 | 0.250 | 0.998 | 0.001 | 0.860 | 0.297 | 0.481 | |
| 新疆 | 0.468 | 0.098 | 0.384 | 0.159 | 0.028 | 0.227 | |
| 宁夏 | 0.509 | 0.056 | 0.001 | 0.532 | 0.967 | 0.413 | |
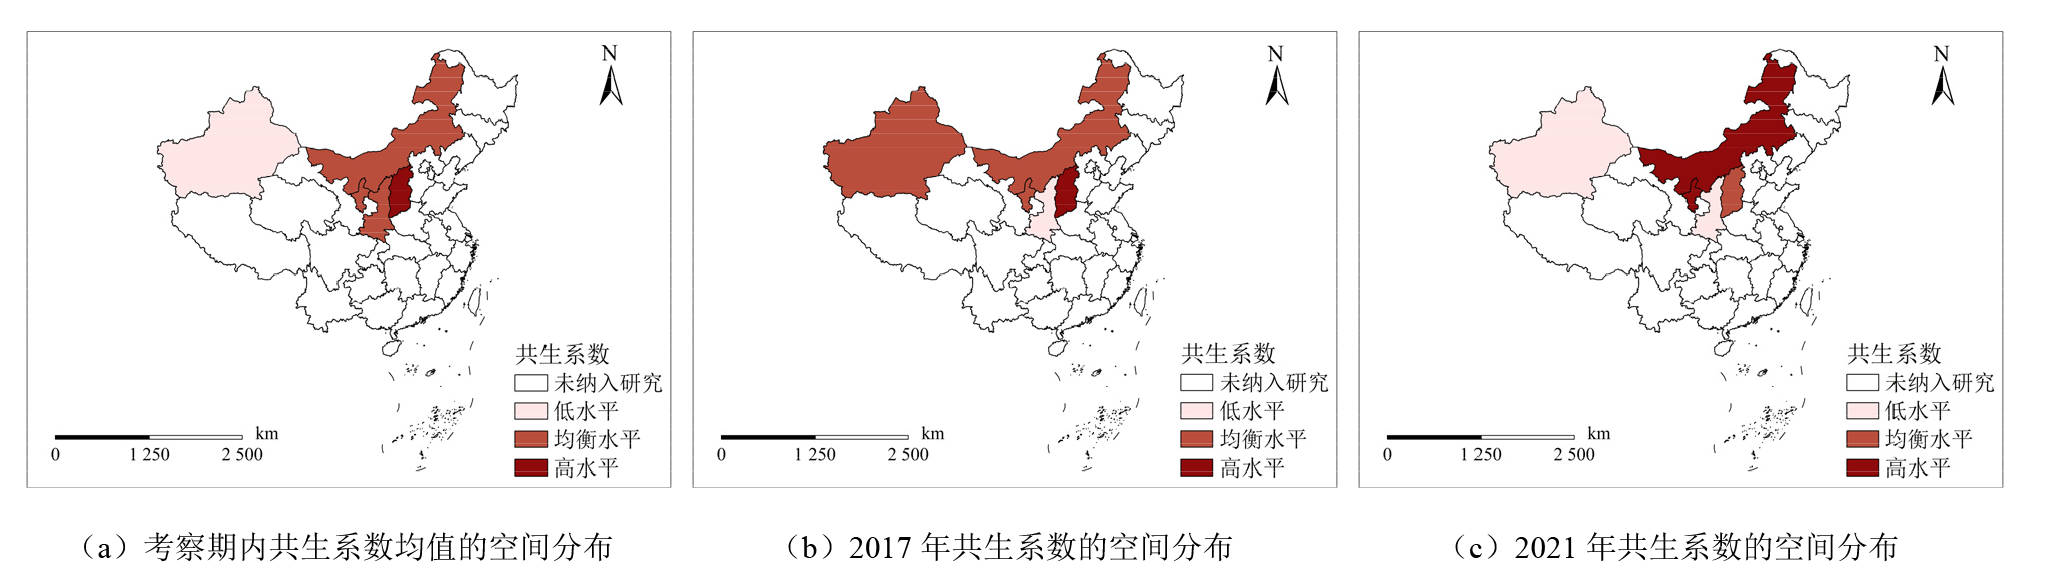
Figure 3 Spatial distribution of co-occurrence coefficients in regions with superior energy endowments
| 能源禀赋 优势区域 | 各年主要影响因子 (指标) | 前三影响因子(维度) |
|---|---|---|
| 内蒙古 | 人均能源生产量,能源自给率,工业污染治理投资总额,新能源发电比例(2021),森林覆盖率(2021) | 可获得性, 环境治理, 结构稳定性 |
| 山西 | 人均能源生产量,工业污染治理投资总额,新能源发电比例 | |
| 陕西 | 人均能源生产量,工业污染治理投资总额,新能源发电比例,省域能源产量占中国总产量比例(2020-2021) | |
| 新疆 | 人均能源生产量,省域能源产量占中国总产量比例,能源自给率,工业污染治理投资总额(2021) | |
| 宁夏 | 人均能源生产量,省域能源产量占中国总产量比例,能源自给率 |
Table 7 Main factors influencing the symbiotic relationship between energy supply security and ecological security in regions with energy endowment advantages
| 能源禀赋 优势区域 | 各年主要影响因子 (指标) | 前三影响因子(维度) |
|---|---|---|
| 内蒙古 | 人均能源生产量,能源自给率,工业污染治理投资总额,新能源发电比例(2021),森林覆盖率(2021) | 可获得性, 环境治理, 结构稳定性 |
| 山西 | 人均能源生产量,工业污染治理投资总额,新能源发电比例 | |
| 陕西 | 人均能源生产量,工业污染治理投资总额,新能源发电比例,省域能源产量占中国总产量比例(2020-2021) | |
| 新疆 | 人均能源生产量,省域能源产量占中国总产量比例,能源自给率,工业污染治理投资总额(2021) | |
| 宁夏 | 人均能源生产量,省域能源产量占中国总产量比例,能源自给率 |
| [1] | AMENT J M, FREEMAN R, CARBONE C, et al., 2020. An empirical analysis of synergies and tradeoffs between sustainable development goals[J]. Sustainability, 12(20): 8424. |
| [2] | International Energy Agency, 1985. Energy technology policy[R]. Paris: OECD/IEA: 29. |
| [3] | JEONG S, LEE J, 2022. Environment and energy? The impact of environmental management systems on energy efficiency[J]. Manufacturing and Service Operations Management, 24(3): 1311-1328. |
| [4] | SAPP J, 1994. Evolution by Association: A History of Symbiosis[M]. New York: Oxford University Press: 3-14. |
| [5] | SU C W, PANG L D, TAO R, et al., 2022. Renewable energy and technological innovation: Which one is the winner in promoting net-zero emissions?[J]. Technological Forecasting and Social Change, 182: 121798. |
| [6] | 陈利, 姚凤禹, 苏宇童, 2024. 能源变革与生态福利绩效研究——基于新能源示范城市设立的准自然实验[J]. 工业技术经济, 43(10): 98-108. |
| CHEN L, YAO F Y, SU Y T, 2024. Energy transformation and ecological welfare performance: A quasi-natural experiment based on the establishment of new energy demonstration cities[J]. Journal of Industrial Technology and Economy, 43(10): 98-108. | |
| [7] |
陈黎明, 李恬曦, 张智, 2024. 中国发展方式绿色转型的统计测度及时空演进分析[J]. 工业技术经济, 43(9): 132-142.
DOI |
| CHEN L M, LI T X, ZHANG Z, 2024. Statistical measurement and spatial-temporal evolution analysis of green transformation in China’s development modes[J]. Journal of Industrial Technology and Economy, 43(9): 132-142. | |
| [8] |
戴前智, 王毅红, 谢启伟, 等, 2024. 基于非合作博弈两阶段DEA的能源环境效率评价方法研究[J]. 系统工程理论与实践, 44(12): 3932-3946.
DOI |
| DAI Q Z, WANG Y H, XIE Q W, et al., 2024. Energy environmental efficiency evaluation method based on non-cooperative game two- stage DEA[J]. Systems Engineering-Theory and Practice, 44(12): 3932-3946. | |
| [9] | 董溯战, 赵绘宇, 2009. 生态安全问题的能源法应对——基于能源安全价值的二元论视角[J]. 生产力研究 (13): 87-88, 97. |
| DONG S Z, ZHAO H Y, 2009. Energy law responses to ecological security issues: A dualistic perspective based on the value of energy security[J]. Productivity Research (13): 87-88, 97. | |
| [10] | 董直庆, 刘备, 蔡玉程, 2020. 财富水平与能源偏向型技术进步——来自地区面板数据的经验证据[J]. 东南大学学报(哲学社会科学版), 22(2): 41-53. |
| DONG Z Q, LIU B, CAI Y C, 2020. The wealth levels and energy-biased technological progress: Empirical evidence from regional panel data[J]. Journal of Southeast University (Philosophy and Social Science), 22(2): 41-53. | |
| [11] | 郭焦锋, 任世华, 2023. 如何保障新时代中国能源供给安全[J]. 人民论坛·学术前沿 (19): 46-55. |
| GUO J F, REN S H, 2023. How to guarantee the security of China’s energy supply in the new era[J]. Frontiers (19): 46-55. | |
| [12] | 贺小荣, 石彩霞, 彭坤杰, 2024. 长江中游城市群新型城镇化与生态韧性的时空适配及互动响应[J]. 长江流域资源与环境, 33(4): 699-714. |
| HE X R, SHI C X, GUO K J, 2024. Spatial-temporal adaptation and interactive response of new-type urbanization and ecological resilience in the middle reaches of the Yangtze River[J]. Resources and Environment in the Yangtze Basin, 33(4): 699-714. | |
| [13] | 胡宗义, 李好, 刘佳琦, 等, 2023. 中国地方政府环境责任履行水平测度及其时空演变[J]. 中国人口·资源与环境, 33(10): 1-14. |
| HU Z Y, LI H, LIU J Q, et al., 2023. Measurement and spatio-temporal evolution of local governments' environmental responsibilities in China[J]. China Population, Resources and Environment, 33(10): 1-14. | |
| [14] | 菅利荣, 曾今, 2023. 考虑废弃物回收利用的区域生态创新效率研究[J]. 科学学研究, 41(12): 2279-2293. |
| JIAN L R, ZENG J, 2023. Study on the efficiency of regional eco-innovation considering waste recycling[J]. Studies in Science of Science, 41(12): 2279-2293. | |
| [15] | 金永杰, 赵树良, 2023. 企业环境伦理对重污染企业绿色创新的影响——制度压力和补贴强度的调节作用[J]. 科学学与科学技术管理, 44(2): 75-93. |
| JIN Y J, ZHAO S L, 2023. Influence of enterprise environmental ethics on green innovation of heavy pollution enterprises: Regulatory effect of institutional pressure and subsidy intensity[J]. Science of Science and Management of Science and Technology, 44(2): 75-93. | |
| [16] | 李斌, 李拓, 2014. 中国空气污染库兹涅茨曲线的实证研究——基于动态面板系统GMM与门限模型检验[J]. 经济问题 (4): 17-22. |
| LI B, LI T, 2014. An empirical study of the environmental Kuznets curve for China's air pollution: By GMM model and threshold effect with dynamic panel data[J]. On Economic Problems (4): 17-22. | |
| [17] | 李健, 高荣泽, 王晓祺, 等, 2024. 长江经济带资源型城市绿色发展效率时空分异与影响机制研究[J/OL]. 长江流域资源与环境, 1-17[2025-01-21]. http://kns.cnki.net/kcms/detail/42.1320.x.20241031.1651.007.html. |
| LI J, GAO R Z, WANG X Q, et al., 2024. Spatio-temporal variation and influencing mechanism of green development efficiency in resource-based cities along the Yangtze River Economic Belt[J/OL]. Resources and Environment in the Yangtze Basin, 1-17 [2025-01-21]. http://kns.cnki.net/kcms/detail/42.1320.x.20241031.1651.007.html. | |
| [18] | 李品, 2018. 中国能源供给安全影响因素研究[J]. 西安科技大学学报, 38(3): 403-410. |
| LI P, 2018. Influential factors of energy supply security of China[J]. Journal of Xi’an University of Science and Technology, 38(3): 403-410. | |
| [19] | 李响, 武海潮, 王文雪, 等, 2024. 考虑大规模新能源接入的电网性能评价指标体系[J]. 电力系统保护与控制, 52(15): 178-187. |
| LI X, WU H C, WANG W X, et al., 2024. Performance evaluation index system of a power grid considering large-scale new energy[J]. Power System Protection and Control, 52(15): 178-187. | |
| [20] | 梁涛, 刘亚祥, 杨硕, 等, 2024. 山东省综合能源系统可持续发展能力评价[J]. 山东大学学报(工学版), 54(4): 159-168. |
| LIANG T, LIU Y X, YANG S, et al., 2024. Evaluation of sustainable development capacity of comprehensive energy system in Shandong Province[J]. Journal of Shandong University (Engineering Science), 54(4): 159-168. | |
| [21] | 刘晓亮, 余一卉, 2024. 地方环境治理何以有效?——中央环保督察背景下省域数据的动态QCA分析[J]. 甘肃行政学院学报 (3): 37-47, 125. |
| LIU X L, YU Y H, 2024. How can local environmental governance be effective?: Dynamic QCA analysis of provincial data under the background of Central Environmental Inspection[J]. Journal of Gansu Administration Institute (3): 37-47, 125. | |
| [22] | 史丹, 薛钦源, 2021. 中国一次能源安全影响因素、评价与展望[J]. 经济纵横 (1): 31-45, 2. |
| SHI D, XUE Q Y, 2021. Influencing factors, evaluation and outlook of primary energy security in China[J]. Economic Review Journal (1): 31-45, 2. | |
| [23] | 施应玲, 余欣玥, 2024. 基于LMDI和系统聚类的电力行业碳排放影响因素分析[J]. 生态经济, 40(2): 22-29. |
| SHI Y L, YU X Y, 2024. An analysis of influencing factors of carbon emission in power industry based on LMDI and System Clustering[J]. Ecological Economy, 40(2): 22-29. | |
| [24] |
孙才志, 魏亚琼, 赵良仕, 2022. 干旱区水—能源—粮食纽带系统协同演化——以中国西北地区为例[J]. 自然资源学报, 37(2): 320-333.
DOI |
| SUN C Z, WEI Y Q, ZHAO L S, 2022. Co-evolution of water-energy- food nexus in arid areas: Take northwest China as an example[J]. Journal of Natural Resources, 37(2): 320-333. | |
| [25] | 孙亚男, 杨名彦, 2020. 中国绿色全要素生产率的俱乐部收敛及地区差距来源研究[J]. 数量经济技术经济研究, 37(6): 47-69. |
| SUN Y N, YANG M Y, 2020. Research on club convergence and the sources of regional gaps of green total factor productivity in China[J]. Journal of Quantitative and Technological Economics, 37(6): 47-69. | |
| [26] | 王礼刚, 2022. 汉江生态经济带产业生态化与生态产业化耦合协调发展研究[J]. 长江流域资源与环境, 31(6): 1198-1207. |
| WANG L G, 2022. Research on coupling coordinated development between industrial ecologicalization and ecological industrialization in Hanjiang River Ecological Economy Belt[J]. Resources and Environment in the Yangtze Basin, 31(6): 1198-1207. | |
| [27] |
王毅, 蔡舒雅, 李晓婷, 等, 2024. 中国能源的 “不可能三角” 真的不可能吗——基于耦合协调度模型的实证检验[J]. 世界地理研究, 33(8): 87-101.
DOI |
|
WANG Y, CAI S Y, LI X T, et al., 2024. Is the “Impossible Triangle” of the energy in China really impossible? An empirical test based on Coupling Coordination Degree Model[J]. World Regional Studies, 33(8): 87-101.
DOI |
|
| [28] | 魏丽莉, 陈熙, 2022. 数字金融、技术进步与能源强度[J]. 兰州学刊 (5): 36-49. |
| WEI L L, CHEN X, 2022. Digital finance, technological progress and energy intensity[J]. Lanzhou Academic Journal (5): 36-49. | |
| [29] |
吴玥葶, 郭利丹, 井沛然, 等, 2023. 中亚五国水-能源-粮食-生态耦合关系及时空分异[J]. 干旱区研究, 40(4): 573-582.
DOI |
|
WU Y T, GUO L D, JING P R, et al., 2023. Coupling relationship and spatiotemporal differentiation of the water-energy-food-ecology nexus in five Central Asian countries[J]. Arid Zone Research, 40(4): 573-582.
DOI |
|
| [30] | 肖笃宁, 陈文波, 郭福良, 2002. 论生态安全的基本概念和研究内容[J]. 应用生态学报, 13(3): 354-358. |
| XIAO D N, CHEN W B, GUO F L, 2002. On the basis concepts and contents of ecological security[J]. Chinese Journal of Applied Ecology, 13(3): 354-358. | |
| [31] | 徐雪, 2024. 新型城镇化高质量发展的多维测度、空间差异及动态演进[J]. 统计与决策, 40(10): 100-105. |
| XU X, 2024. Multidimensional measurement, spatial differences and dynamic evolution of high-quality development of new-type urbanization[J]. Statistics and Decision, 40(10): 100-105. | |
| [32] |
薛静静, 沈镭, 刘立涛, 等, 2014. 中国能源供给安全综合评价及障碍因素分析[J]. 地理研究, 33(5): 842-852.
DOI |
| XUE J J, SHEN L, LIU L T, et al., 2014. Energy supply security assessment of China and the influencing factors based on set pair analysis[J]. Geographical Research, 33(5): 842-852. | |
| [33] | 薛静静, 沈镭, 彭保发, 等, 2015. 中国能源生产和消费大省的能源供给安全综合评价及优化——以陕西省和广东省为例[J]. 自然资源学报, 30(10): 1686-1697. |
|
XUE J J, SHEN L, PENG B F, et al., 2015. Assessment and optimization on energy supply security of high energy producing and high energy consumption provinces in China: Cases study of Shaanxi and Guangdong Provinces[J]. Journal of Natural Resources, 30(10): 1686-1697.
DOI |
|
| [34] |
姚芳虹, 曾元正, 彭春, 等, 2024. 体育用品制造业集聚与区域生态效率的时空特征及空间溢出效应[J]. 经济地理, 44(4): 142-148.
DOI |
|
YAO F H, ZENG Y Z, PENG C, et al., 2024. Spatial spillover effects of manufacturing industry agglomeration of sporting goods on regional ecological efficiency and their spatial characteristics[J]. Economic Geography, 44(4): 142-148.
DOI |
|
| [35] | 尹铎, 梁诗, 林煦丹, 2024. 长江流域国家级水产种质资源保护区时空演变特征及其驱动因素[J]. 长江流域资源与环境, 33(8): 1663-1678. |
| YIN D, LIANG S, LIN X D, 2024. Spatial and temporal evolution characteristics and influencing factors of National Aquatic Germplasm Reserves in the Yangtze River basin[J]. Resources and Environment in the Yangtze Basin, 33(8): 1663-1678. | |
| [36] | 于楠, 孙仁金, 石红玲, 等, 2024. 中国能源生态足迹空间差异及收敛趋势[J]. 环境科学与技术, 47(3): 37-47. |
| YU N, SUN R J, SHI H L, et al., 2024. Energy ecological footprint of China: Trend of spatial differences and convergence[J]. Environmental Science and Technology, 47(3): 37-47. | |
| [37] | 于伟静, 杨鹏威, 王放放, 等, 2023. 双碳战略背景下中国煤电技术发展与挑战[J]. 煤炭学报, 48(7): 2641-2656. |
| YU W J, YANG P W, WANG F F, et al., 2023. Research and challenge of coal power technology development in China under the background of dual carbon strategy[J]. Journal of China Coal Society, 48(7): 2641-2656. | |
| [38] | 袁纯清, 1998. 共生理论及其对小型经济的应用研究(上)[J]. 改革 (2): 100-104. |
| YUAN C Q, 1998. A study of symbiosis theory and its application to small economies (top)[J]. Reform (2): 100-104. | |
| [39] | 张雷, 谢辉, 陈文言, 等, 2004. 现代能源生态系统建设: 一种理论探讨[J]. 自然资源学报, 19(4): 525-530. |
| ZHANG L, XIE H, CHEN W Y, et al., 2004. Studies on modern energy ecosystem development: A theoretical approach[J]. Journal of Natural Resources, 19(4): 525-530. | |
| [40] | 张敏, 李勇, 2022. 基于层次模型的全国主要城市雾霾监测评估及影响因素研究[J]. 数理统计与管理, 41(4): 587-598. |
| ZHANG M, LI Y, 2022. Research on smog monitoring and evaluation and influencing factors in major cities of China based on Hierarchical Model[J]. Journal of Applied Statistics and Management, 41(4): 587-598. | |
| [41] | 张淑惠, 孙燕芳, 2023. 新基建对区域 “创新-生态-经济” 耦合协调发展的影响——基于空间溢出效应和传导机制的检验[J]. 中国人口·资源与环境, 33(10): 187-198. |
| ZHANG S H, SUN Y F, 2023. Impact of new infrastructure construction on regional innovation-ecology-economy coupling coordination: Tests based on spatial spillover effects and transmission mechanisms[J]. China Population, Resources and Environment, 33(10): 187-198. | |
| [42] | 张雪薇, 杜凤莲, 申晓燕, 等, 2023. 黄河流域经济-能源-生态-科技耦合协调发展时空格局及其影响因素[J]. 安全与环境学报, 23(7): 2545-2556. |
| ZHANG X W, DU F L, SHEN X Y, et al., 2023. Coupling coordination development and spatial differentiation of economy-energy-ecology- science and technology in the Yellow River basin[J]. Journal of Safety and Environment, 23(7): 2545-2556. | |
| [43] | 张有生, 苏铭, 田智宇, 2022. 加快黄河流域能源基地转型发展[J]. 宏观经济管理 (5): 38-45, 51. |
| ZHANG Y S, SU M, TIAN Z Y, 2022. Accelerate transformation and development of the energy bases in the Yellow River basin[J]. Macroeconomic Management (5): 38-45, 51. | |
| [44] | 张振华, 陈曦, 汪京, 等, 2024. 绿色金融改革创新试验区政策对碳排放的影响效应——基于282个城市面板数据的准实验研究[J]. 中国人口·资源与环境, 34(2): 32-45. |
| ZHANG Z H, CHEN X, WANG J, et al., 2024. Impact of China's PZGFRI policy on carbon emissions: A quasi-experimental study based on urban panel data from 282 cities[J]. China Population, Resources and Environment, 34(2): 32-45. | |
| [45] |
张展鹏, 班明飞, 郭丹阳, 等, 2021. 适用于环境-经济调度研究的燃煤机组二氧化碳排放特性模型[J]. 上海交通大学学报, 55(12): 1663-1672.
DOI |
| ZHANG Z P, BAN M F, GUO D Y, et al., 2021. A model for carbon dioxide emission characteristics of coal-fired units for environment- economic dispatch research[J]. Journal of Shanghai Jiaotong University, 55(12): 1663-1672. | |
| [46] | 赵平, 谭克龙, 韩效忠, 等, 2021. 新形势下我国能源与生态安全保障研究[J]. 中国煤炭地质, 33(1): 1-7. |
| ZHAO P, TAN K L, HAN X Z, et al., 2021. Research for energy and ecological security in China under new situation[J]. Coal Geology of China, 33(1): 1-7 | |
| [47] | 朱丽, 曹梦莹, 刘瑞杰, 2024. “双碳” 目标下煤炭资源型城市能源转型评价与障碍因子[J]. 环境科学, 45(12): 6858-6869. |
| ZHU L, CAO M Y, LIU R J, 2024. Evaluation of energy transition and barrier factors in coal resource cities under carbon neutral and peak carbon goals[J]. Environmental Science, 45(12): 6858-6869. | |
| [48] | 朱向梅, 袁辉, 张彬, 等, 2023. 城乡共生关系演化及其动态交互影响研究[J]. 地域研究与开发, 42(4): 14-20. |
| ZHU X M, YUAN H, ZHANG B, et al., 2023. Study on the evolution and dynamic interaction of urban-rural symbiosis relationship[J]. Areal Research and Development, 42(4): 14-20. |
| [1] | CHEN Jieru, YE Changsheng, WEI Wei, CAI Xin, WANG Lili. Analysis of “Production-Living-Ecological Space” Coupling Coordination and Influencing Factors in County Areas of Poyang Lake City Cluster [J]. Ecology and Environmental Sciences, 2025, 34(5): 807-818. |
| [2] | GUO Mingbin, GONG Jianzhou, WANG Lijuan, WANG Shikuan. Analysis of the Natural Dominant Factors Driving NO2 Concentration Changes in the Guangdong-Hong Kong-Macao Greater Bay Area from 2019 to 2023 [J]. Ecology and Environmental Sciences, 2025, 34(4): 534-547. |
| [3] | FANG Ji, WU Xiao, GONG Qinghua, WEI Zemian, WANG Yingjia. Planning Strategy of Ecological Restoration of Land Space in Southern Coastal Agricultural Counties: Taking Xuwen County as an Example [J]. Ecology and Environmental Sciences, 2024, 33(7): 1019-1026. |
| [4] | ZHANG Weichen, WANG Xingqi, WANG Bojie. Spatiotemporal Pattern and Influencing Factors of the Ecosystem Services in the Tabu River Basin [J]. Ecology and Environmental Sciences, 2024, 33(7): 1142-1152. |
| [5] | LI Cheng, CHENG Zhipeng, LIU Yujin, YAO Yiming, LI Chunlei. Research on Ecological Risks and Its Control Policies of Per- and Polyfluoroalkyl Substances [J]. Ecology and Environmental Sciences, 2024, 33(6): 980-996. |
| [6] | ZHANG Ruidong, Wu Fuqin, LI Kunji, JIN Yanshan, LIU Chengxia, SHEN Shikang. Species Compositions and Distribution Characteristics Analyses of Invasive Alien Plants in the Lakeside of Nine Plateau Lakes in Yunnan Province [J]. Ecology and Environmental Sciences, 2024, 33(3): 351-361. |
| [7] | LING Hong, ZHU Xiaoxiao, WU Dan, SU Xiaomei, GUO Xiya. Assessing Water Ecological Security in the Taihu Lake Basin through Ecological Function Localization [J]. Ecology and Environmental Sciences, 2024, 33(3): 418-427. |
| [8] | LUO Xiaoling, LIU Jun, WANG Qi, LIU Tongxu, LIANG Yaojie, XIE Zhiyi, WANG Zhongwei, CHEN Duohong. Temporal and Spatial Changes in pH and Organic Matter and Their Influencing Factors in Soils with Various Land Use Types in Guangdong Province since 2016 [J]. Ecology and Environmental Sciences, 2024, 33(12): 1849-1861. |
| [9] | YANG Jinli, WU Yangyang, LI Siliang, YUAN Jia, GUO Chunzi, YANG Xiaodong, SHI Zhenghua, XIE Songchi, LUO Huangting, ZHANG Cui, GU Xuemei, LUO Guangjie. Assessing the Coupling and Coordination of ‘Production-Living-Ecological’ Spaces in Xiong’an New Area: Towards an Optimized Ecological Security Pattern [J]. Ecology and Environmental Sciences, 2024, 33(11): 1816-1826. |
| [10] | YUAN Xi, FU Kaidao, TAO Yuchen, ZHANG Nian, YANG Lisha. Spatial-temporal Distribution and Influencing Factors of Nitrous Oxide Flux Across the Water-air Interface in Lancang River, China [J]. Ecology and Environmental Sciences, 2024, 33(1): 54-61. |
| [11] | LI Jianhui, DANG Zheng, CHEN Lin. Spatial-temporal Characteristics of PM2.5 and Its Influencing Factors in the Yellow River Jiziwan Metropolitan Area [J]. Ecology and Environmental Sciences, 2023, 32(4): 697-705. |
| [12] | XU Jing, LIAO Xingkai, GAN Qixu, ZHOU Maoxian. Construction of Ecological Security Pattern Based on MSPA and Circuit Theory in Gansu Section of the Yellow River Basin [J]. Ecology and Environmental Sciences, 2023, 32(4): 805-813. |
| [13] | ZHANG Lin, QI Shi, ZHOU Piao, WU Bingchen, ZHANG Dai, ZHANG Yan. Study on Influencing Factors of Soil Organic Carbon Content in Mixed Broad-leaved and Coniferous Forests Land in Beijing Mountainous Areas [J]. Ecology and Environmental Sciences, 2023, 32(3): 450-458. |
| [14] | HE Yanhu, GONG Zhenjie, WU Haibin, CAI Yanpeng, YANG Zhifeng, CHEN Xiaohong. Spatiotemporal Evolution of Urban Eco-efficiency and Its Influencing Factors in Guangdong-Hong Kong-Macao Greater Bay Area [J]. Ecology and Environmental Sciences, 2023, 32(3): 469-480. |
| [15] | ZHANG Pingjiang, DANG Guofeng. Construction of Ecological Security Pattern of Tao River Basin Based on MCR Model and ant Colony Algorithm [J]. Ecology and Environmental Sciences, 2023, 32(3): 481-491. |
| Viewed | ||||||
|
Full text |
|
|||||
|
Abstract |
|
|||||
Copyright © 2021 Editorial Office of ACTA PETROLEI SINICA
Address:No. 6 Liupukang Street, Xicheng District, Beijing, P.R.China, 510650
Tel: 86-010-62067128, 86-010-62067137, 86-010-62067139
Fax: 86-10-62067130
Email: syxb@cnpc.com.cn
Support byBeijing Magtech Co.ltd, E-mail:support@magtech.com.cn