Ecology and Environmental Sciences ›› 2025, Vol. 34 ›› Issue (7): 1079-1089.DOI: 10.16258/j.cnki.1674-5906.2025.07.008
• Research Article [Ecology] • Previous Articles Next Articles
DING Xin1( ), LIU Jian2, WEI Lihong1, XIE Dewei1, ZHENG Zhaopei1,*()
Received:2025-01-19
Online:2025-07-18
Published:2025-07-11
丁馨1(), 刘健2, 魏俐宏1, 解德威1, 郑昭佩1,*()
通讯作者:
*E-mail: 作者简介:丁馨(2000年生),女,硕士研究生,研究方向为气候变化与区域响应。E-mail: 2023026623@stu.sdnu.edu.cn
基金资助:CLC Number:
DING Xin, LIU Jian, WEI Lihong, XIE Dewei, ZHENG Zhaopei. Spatiotemporal Patterns and Influencing Factors of Vegetation Net Ecosystem Productivity in Shandong Province Based on GSMSR Model[J]. Ecology and Environmental Sciences, 2025, 34(7): 1079-1089.
丁馨, 刘健, 魏俐宏, 解德威, 郑昭佩. 基于GSMSR模型的山东省植被NEP时空格局及影响因素[J]. 生态环境学报, 2025, 34(7): 1079-1089.
Add to citation manager EndNote|Ris|BibTeX
URL: https://www.jeesci.com/EN/10.16258/j.cnki.1674-5906.2025.07.008

Figure 1 Elevation and vegetation cover types in the studied area
| 数据 | 时间(年份) | 分辨率 | 来源 |
|---|---|---|---|
| 高程(DEM) | - | 30 m | 地理空间数据云( |
| 净初级生产力(NPP) | 2000-2020 | 500 m | 美国国家航空航天局( |
| 与不透水面距离(DFI) | 2020 | 1 km | Zenodo( |
| 年降水量(PRE) | 2000-2020 | 1 km | 国家地球系统科学数据中心( |
| 年平均气温(TEM) | 2000-2020 | 1 km | |
| 植被指数(NDVI) | 2000-2020 | 250 m | |
| 0-20 cm土壤碳密度(SOC) | 2010 | - | |
| 饱和蒸汽压差(VPD) | 2000-2020 | 30 m | |
| 土地利用覆盖(CLCD) | 2000-2020 | 30 m | |
| 坡度(SLO) | - | 30 m | DEM坡度分析 |
| 坡向(ALP) | - | 30 m | DEM坡度分析 |
Table 1 Data sources
| 数据 | 时间(年份) | 分辨率 | 来源 |
|---|---|---|---|
| 高程(DEM) | - | 30 m | 地理空间数据云( |
| 净初级生产力(NPP) | 2000-2020 | 500 m | 美国国家航空航天局( |
| 与不透水面距离(DFI) | 2020 | 1 km | Zenodo( |
| 年降水量(PRE) | 2000-2020 | 1 km | 国家地球系统科学数据中心( |
| 年平均气温(TEM) | 2000-2020 | 1 km | |
| 植被指数(NDVI) | 2000-2020 | 250 m | |
| 0-20 cm土壤碳密度(SOC) | 2010 | - | |
| 饱和蒸汽压差(VPD) | 2000-2020 | 30 m | |
| 土地利用覆盖(CLCD) | 2000-2020 | 30 m | |
| 坡度(SLO) | - | 30 m | DEM坡度分析 |
| 坡向(ALP) | - | 30 m | DEM坡度分析 |
| 交互判据 | 交互作用方式 |
|---|---|
| q(X1∩X2)<Min[q(X1), q(X2)] | 非线性减弱 |
| Min[q(X1), q(X2)]<q(X1∩X2)<Max[q(X1), q(X2)] | 单因子非线性减弱 |
| q(X1∩X2)>Max[q(X1), q(X2)] | 双因子增强 |
| q(X1∩X2)=q(X1)+q(X2) | 独立 |
| q(X1∩X2)>q(X1)+q(X2) | 非线性增强 |
Table 2 Interaction modes of driving factors
| 交互判据 | 交互作用方式 |
|---|---|
| q(X1∩X2)<Min[q(X1), q(X2)] | 非线性减弱 |
| Min[q(X1), q(X2)]<q(X1∩X2)<Max[q(X1), q(X2)] | 单因子非线性减弱 |
| q(X1∩X2)>Max[q(X1), q(X2)] | 双因子增强 |
| q(X1∩X2)=q(X1)+q(X2) | 独立 |
| q(X1∩X2)>q(X1)+q(X2) | 非线性增强 |
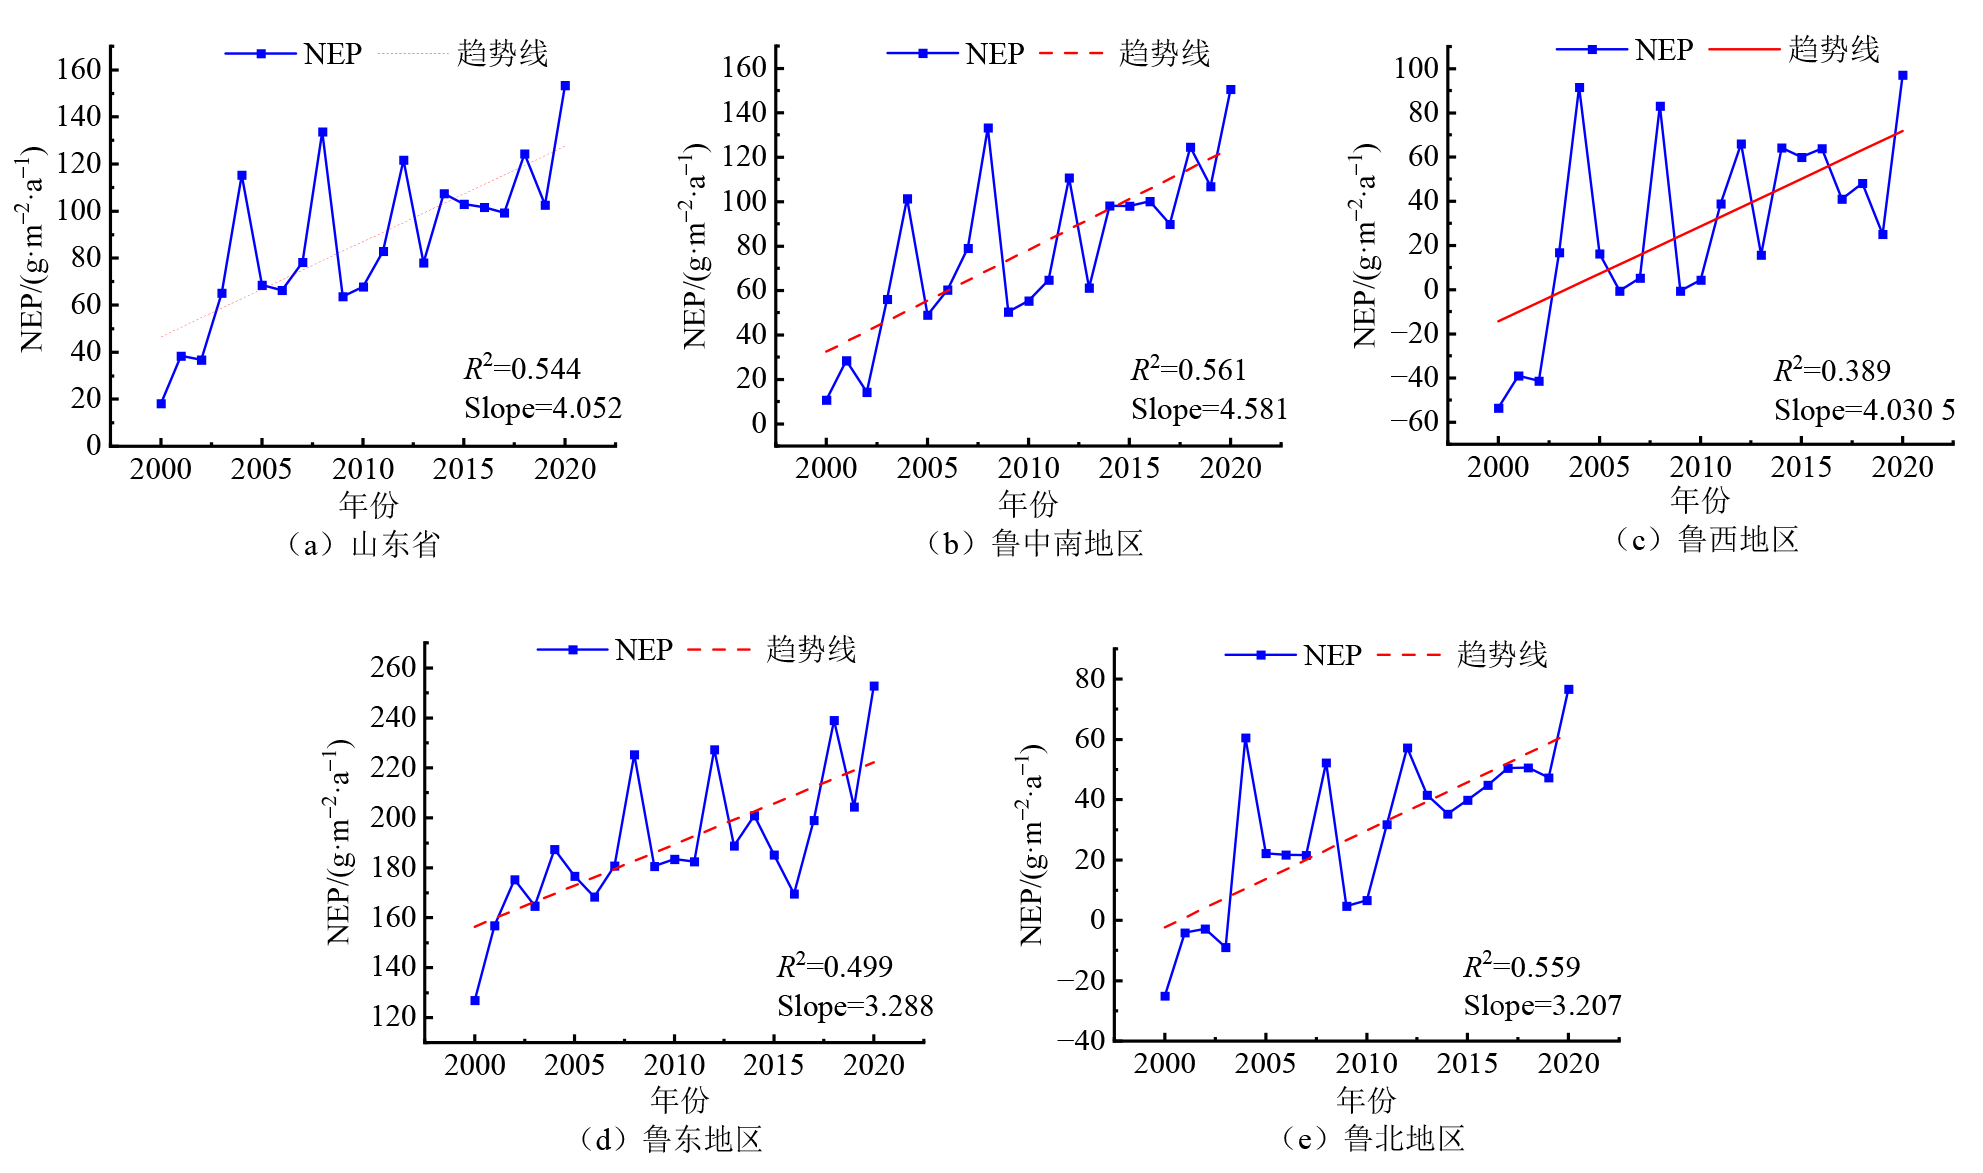
Figure 2 Annual variation of vegetation NEP in Shandong Province and its sub-regions from 2000 to 2020
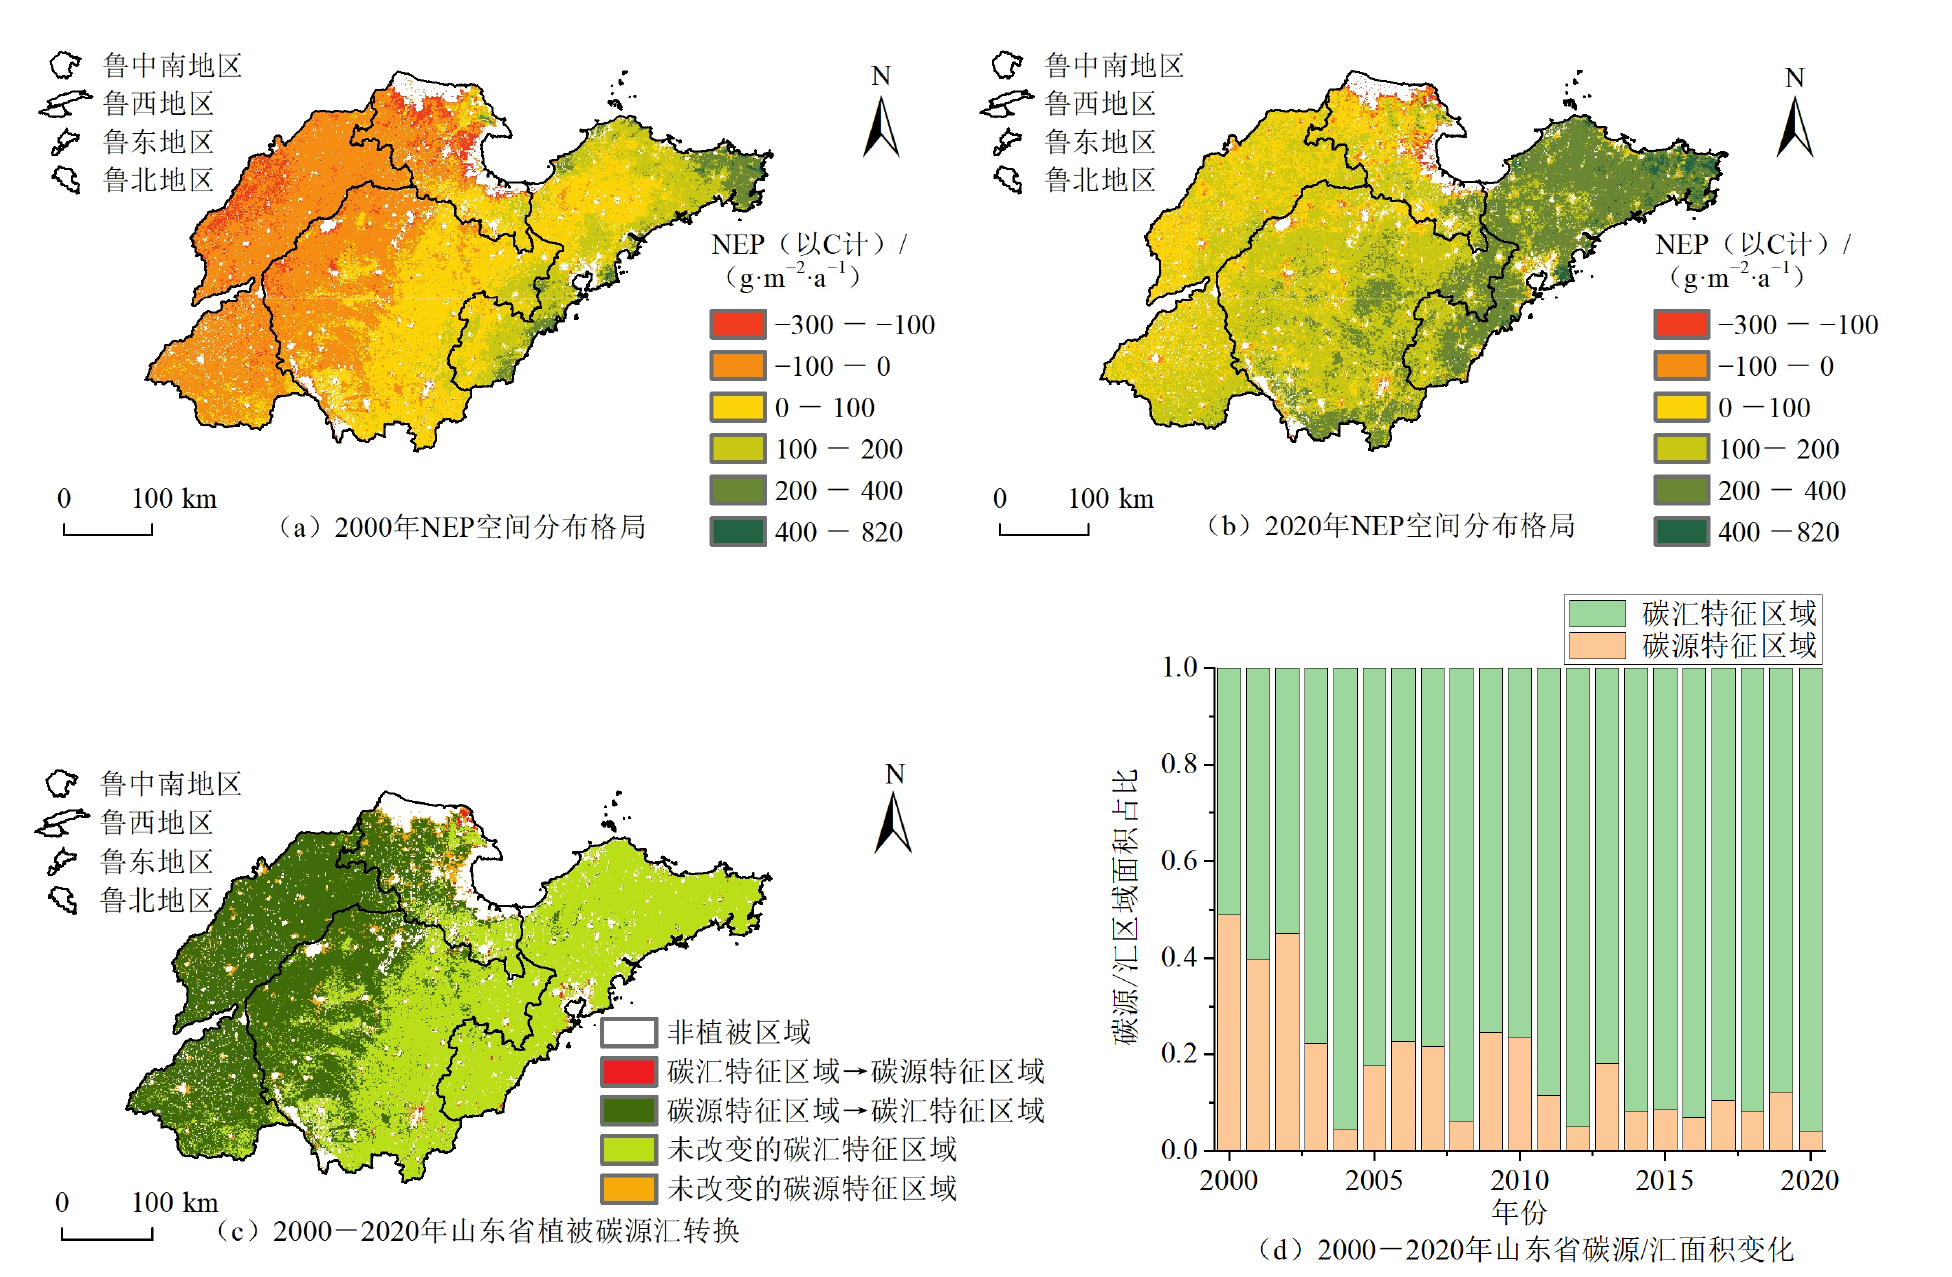
Figure 3 Analysis of vegetation NEP changes and carbon source-sink transition in Shandong Province from 2000 to 2020
| β | |Z|值 | NEP趋势特征 | NEP年际变化趋势面积占比/% | ||||
|---|---|---|---|---|---|---|---|
| 鲁北 | 鲁东 | 鲁中南 | 鲁西 | 山东省 | |||
| >0 | 2.58<Z | 极显著增加 | 40.99 | 45.84 | 63.42 | 36.93 | 49.63 |
| 1.96<Z≤2.58 | 显著增加 | 9.95 | 15.51 | 14.09 | 22.99 | 16.15 | |
| 1.65<Z≤1.96 | 微显著增加 | 3.35 | 5.78 | 4.01 | 10.57 | 6.01 | |
| Z≤1.65 | 不显著增加 | 11.38 | 15.83 | 8.75 | 22.48 | 14.26 | |
| =0 | Z | 基本不变 | 24.52 | 7.62 | 5.88 | 5.30 | 8.53 |
| <0 | Z≤1.65 | 不显著减少 | 5.96 | 5.55 | 2.66 | 1.25 | 3.42 |
| 1.65<Z≤1.96 | 微显著减少 | 0.79 | 0.66 | 0.28 | 0.12 | 0.40 | |
| 1.96<Z≤2.58 | 显著减少 | 1.49 | 1.25 | 0.46 | 0.23 | 0.72 | |
| 2.58<Z | 极显著减少 | 1.57 | 1.97 | 0.47 | 0.14 | 0.88 | |
Table 3 Statistical analysis of vegetation NEP trends in Shandong Province and its regions from 2000 to 2020
| β | |Z|值 | NEP趋势特征 | NEP年际变化趋势面积占比/% | ||||
|---|---|---|---|---|---|---|---|
| 鲁北 | 鲁东 | 鲁中南 | 鲁西 | 山东省 | |||
| >0 | 2.58<Z | 极显著增加 | 40.99 | 45.84 | 63.42 | 36.93 | 49.63 |
| 1.96<Z≤2.58 | 显著增加 | 9.95 | 15.51 | 14.09 | 22.99 | 16.15 | |
| 1.65<Z≤1.96 | 微显著增加 | 3.35 | 5.78 | 4.01 | 10.57 | 6.01 | |
| Z≤1.65 | 不显著增加 | 11.38 | 15.83 | 8.75 | 22.48 | 14.26 | |
| =0 | Z | 基本不变 | 24.52 | 7.62 | 5.88 | 5.30 | 8.53 |
| <0 | Z≤1.65 | 不显著减少 | 5.96 | 5.55 | 2.66 | 1.25 | 3.42 |
| 1.65<Z≤1.96 | 微显著减少 | 0.79 | 0.66 | 0.28 | 0.12 | 0.40 | |
| 1.96<Z≤2.58 | 显著减少 | 1.49 | 1.25 | 0.46 | 0.23 | 0.72 | |
| 2.58<Z | 极显著减少 | 1.57 | 1.97 | 0.47 | 0.14 | 0.88 | |

Figure 4 Analysis and difference analysis of vegetation NEP trends in Shandong Province from 2000 to 2020
| NEP差异水平/ (g·m−2·a−1) | NEP年际差异变化面积占比/% | ||||
|---|---|---|---|---|---|
| 鲁西 | 鲁中南 | 鲁东 | 鲁北 | 山东省 | |
| <0 | 0.62 | 9.74 | 17.05 | 34.34 | 3.50 |
| 0-100 | 11.57 | 90.26 | 82.95 | 65.66 | 18.80 |
| 100-200 | 75.69 | - | - | - | 65.90 |
| 200-300 | 12.03 | - | - | - | 11.65 |
| >300 | 0.09 | - | - | - | 0.16 |
Table 4 Vegetation NEP Difference levels and their percentages in Shandong Province and its regions from 2000 to 2020
| NEP差异水平/ (g·m−2·a−1) | NEP年际差异变化面积占比/% | ||||
|---|---|---|---|---|---|
| 鲁西 | 鲁中南 | 鲁东 | 鲁北 | 山东省 | |
| <0 | 0.62 | 9.74 | 17.05 | 34.34 | 3.50 |
| 0-100 | 11.57 | 90.26 | 82.95 | 65.66 | 18.80 |
| 100-200 | 75.69 | - | - | - | 65.90 |
| 200-300 | 12.03 | - | - | - | 11.65 |
| >300 | 0.09 | - | - | - | 0.16 |
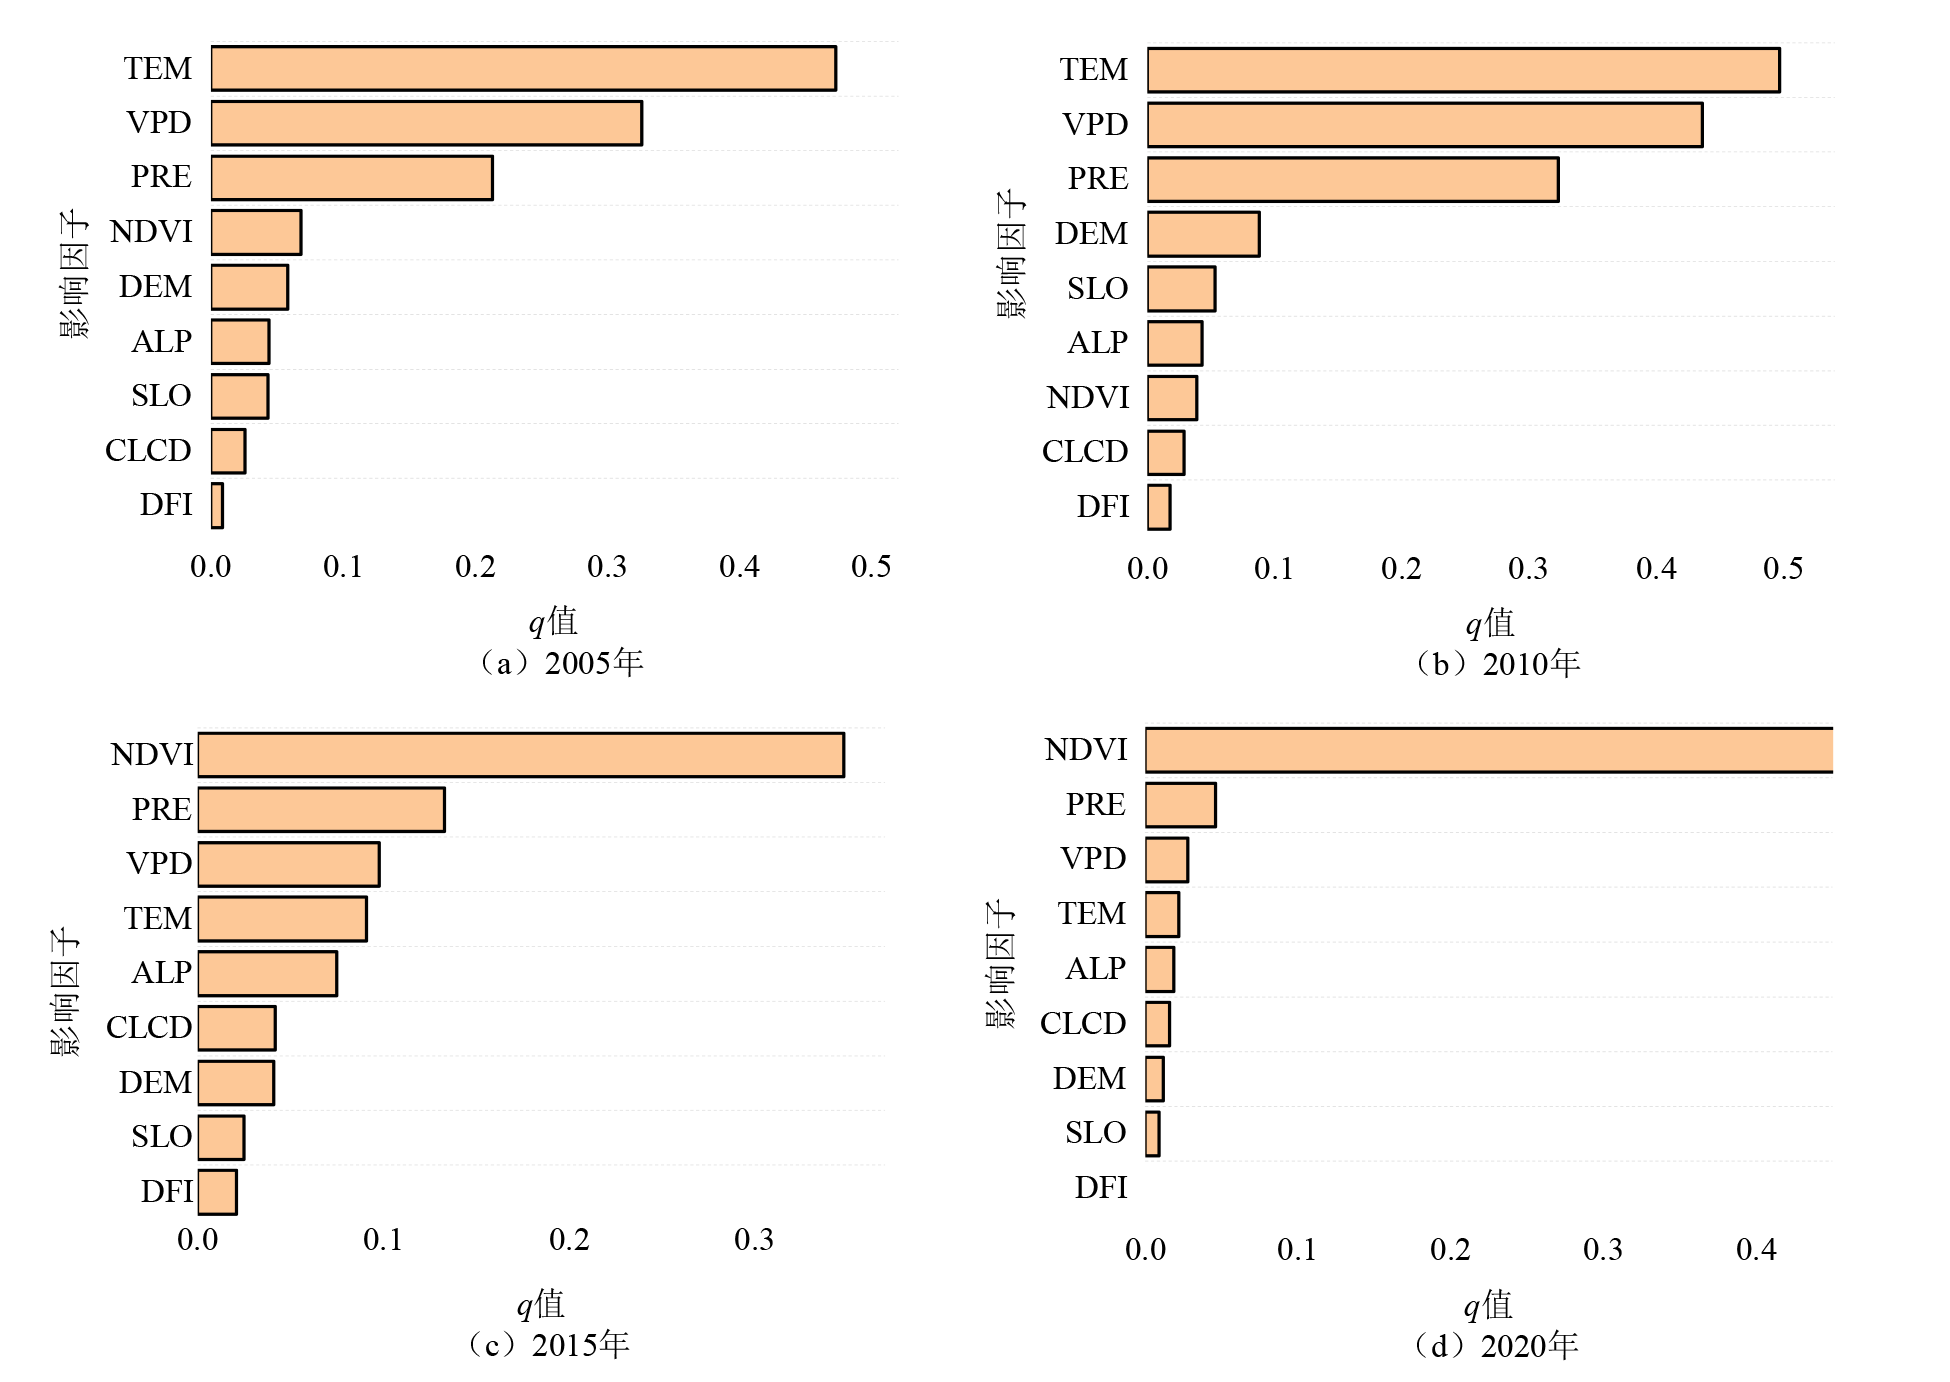
Figure 5 Representative year vegetation NEP single factor detection results
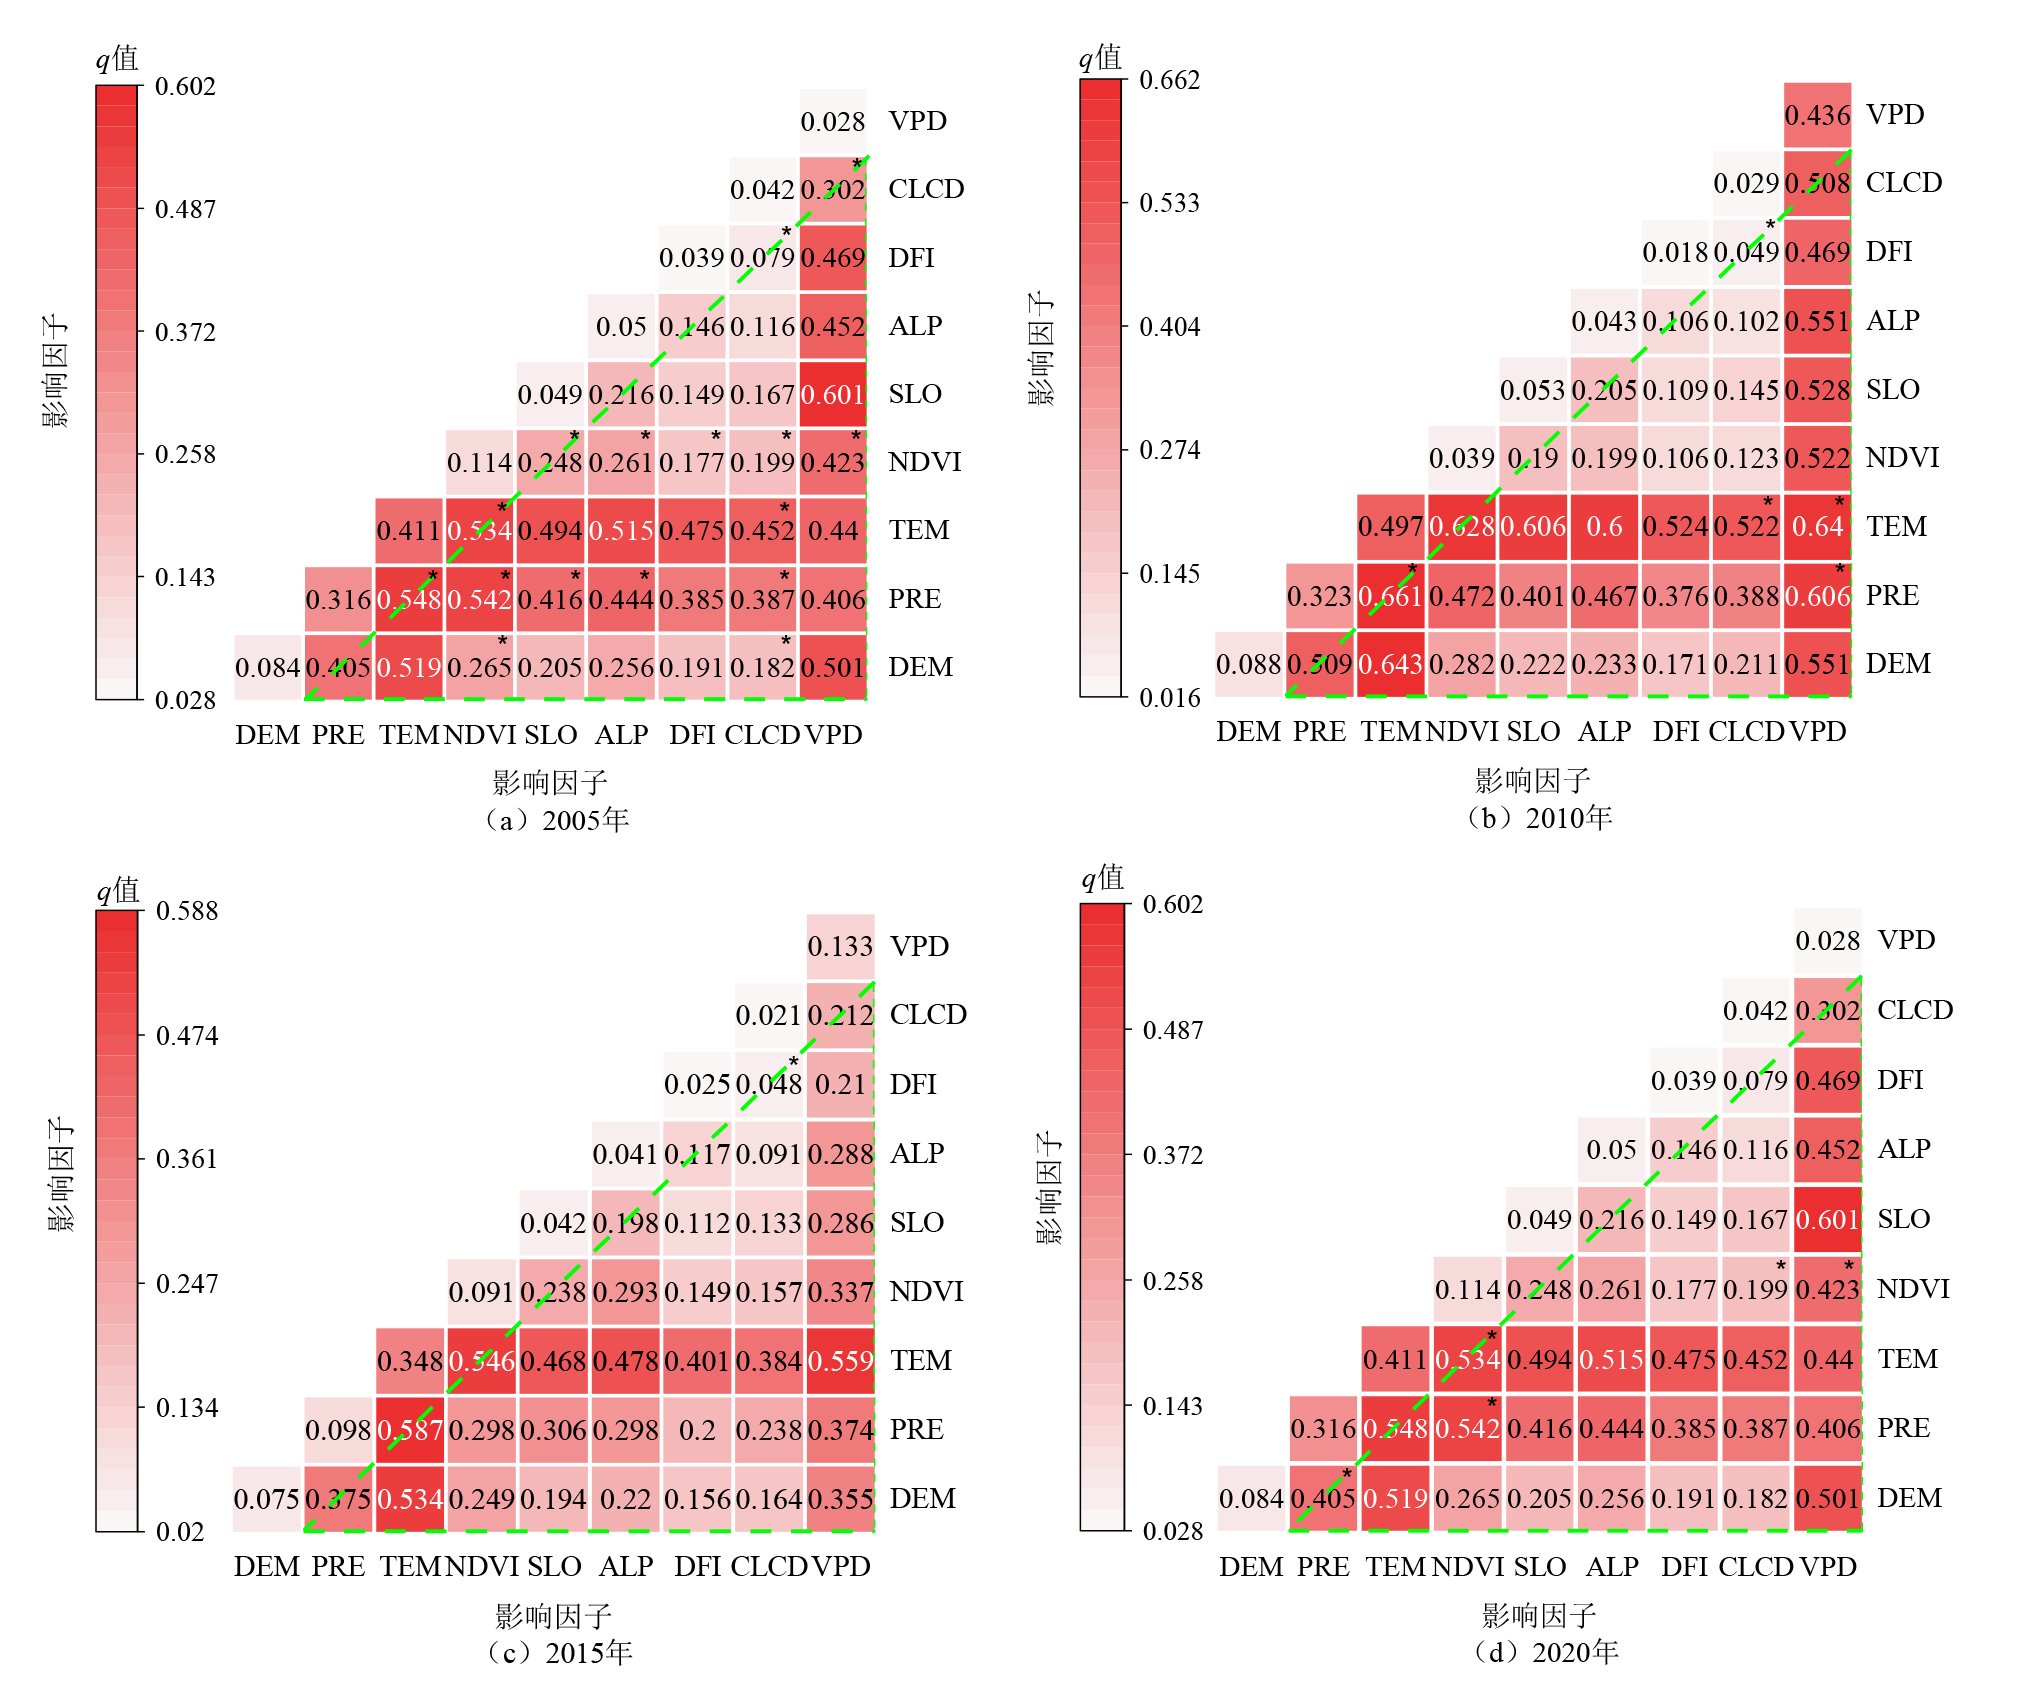
Figure 6 Vegetation NEP interaction q-values for representative years
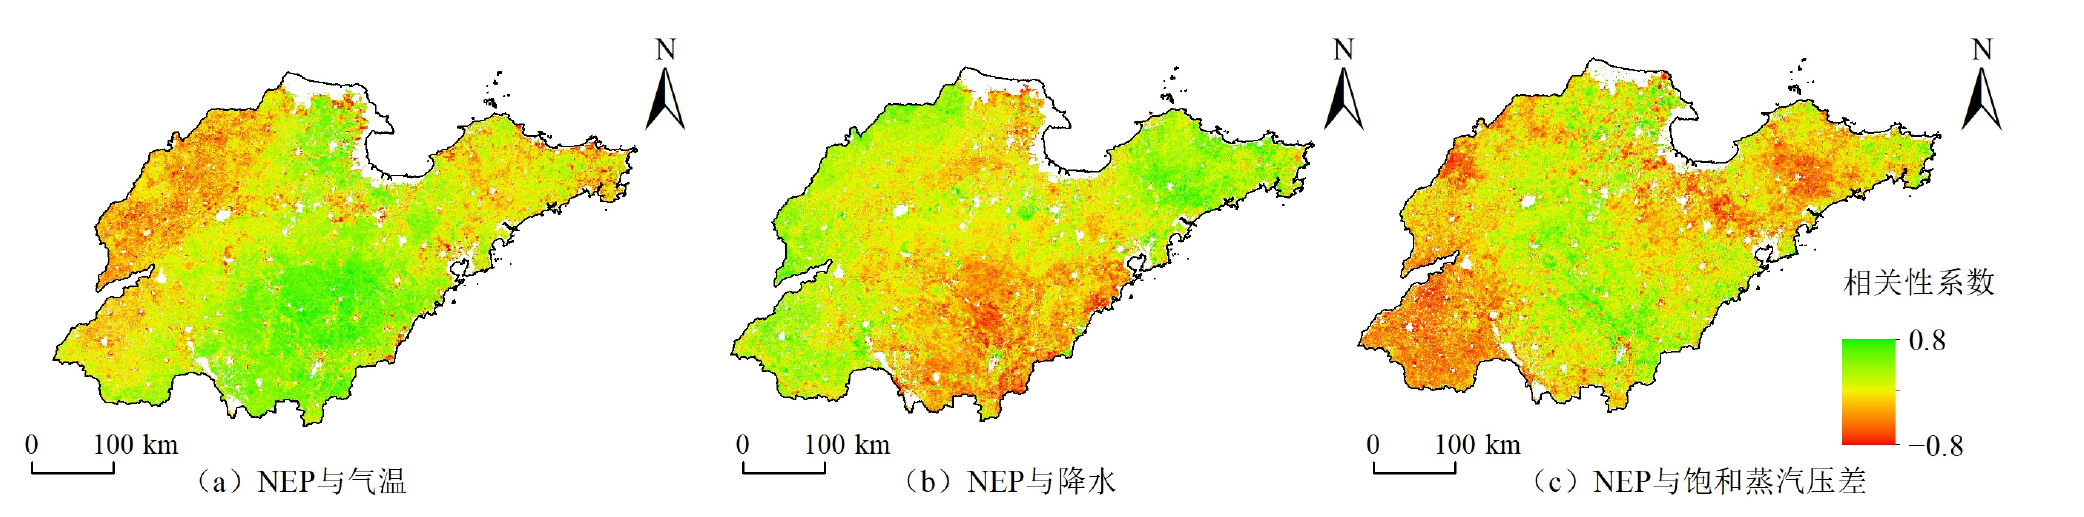
Figure 7 Correlation analysis of vegetation NEP and meteorological factors
| 研究时段 | NEP增速/(g·m−2·a−1) | 参考文献 | |
|---|---|---|---|
| 黄河流域 | 2000-2020年 | 4.7 | 曹云, |
| 北京 | 2000-2020年 | 6.0 | 曹云, |
| 山西 | 1982-2020年 | 6.0 | 曹云, |
| 山东省 | 2000-2020年 | 4.05 | 本研究 |
Table 5 Comparison of NEP growth rates in different regions
| 研究时段 | NEP增速/(g·m−2·a−1) | 参考文献 | |
|---|---|---|---|
| 黄河流域 | 2000-2020年 | 4.7 | 曹云, |
| 北京 | 2000-2020年 | 6.0 | 曹云, |
| 山西 | 1982-2020年 | 6.0 | 曹云, |
| 山东省 | 2000-2020年 | 4.05 | 本研究 |
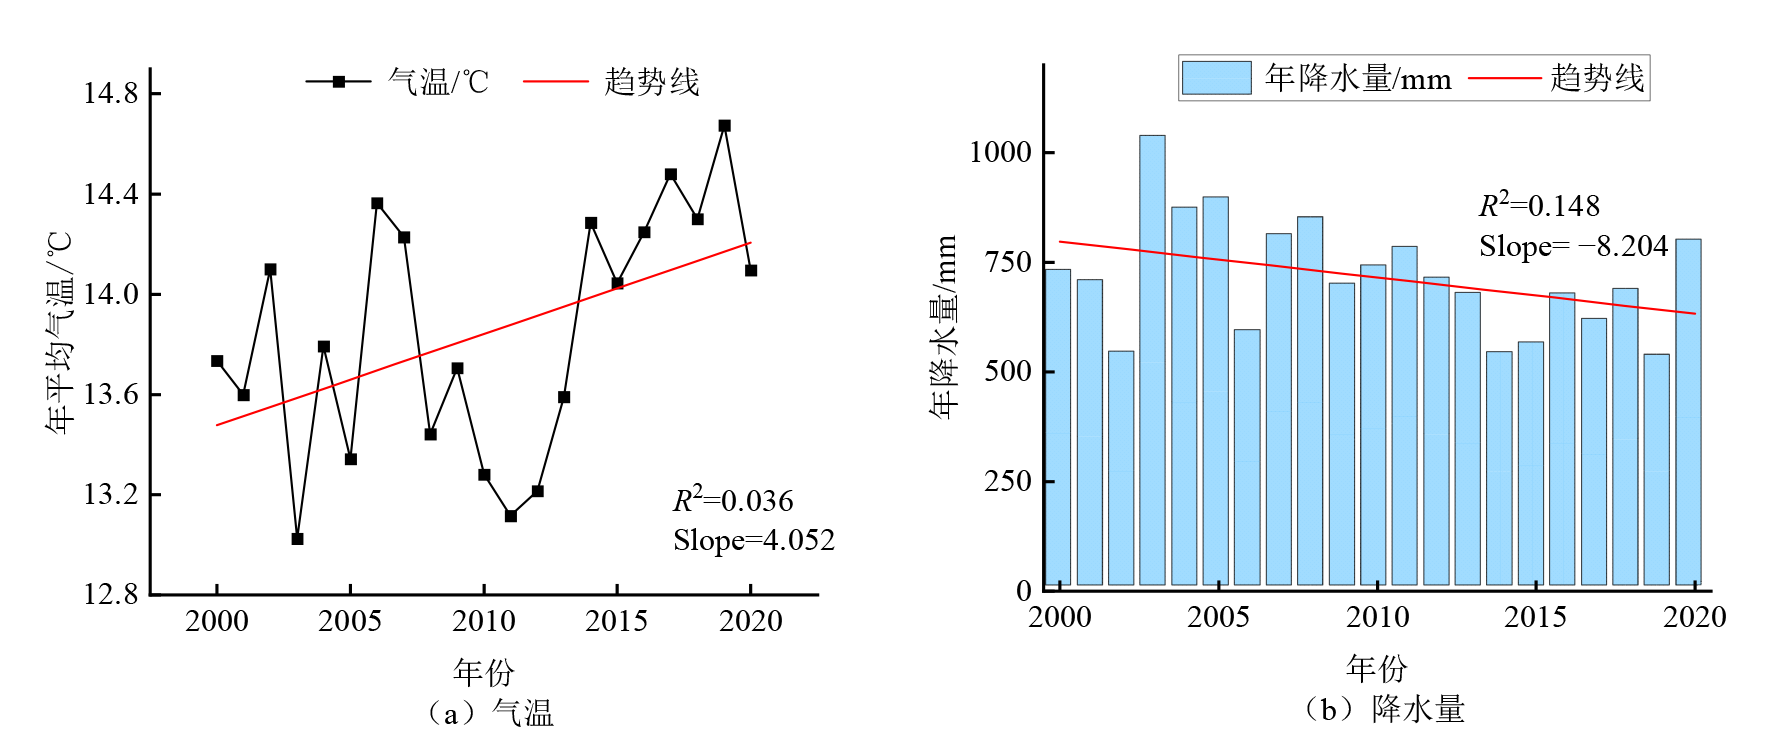
Figure 8 The trend of temperature and precipitation in Shandong Province from 2000 to 2020
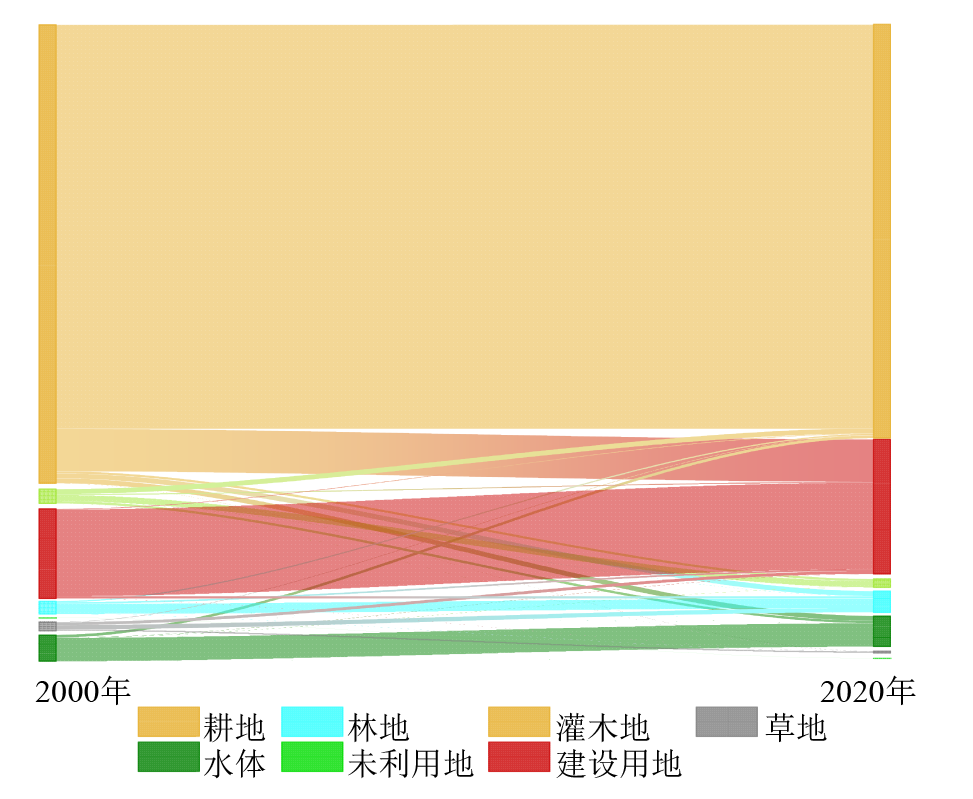
Figure 9 Sankey diagram of land use transition matrix in the studied area from 2000 to 2020
| [1] | ALASHAN S, 2024. Non-monotonic trend analysis using Mann-Kendall with self-quantiles[J]. Theoretical and Applied Climatology, 155(2): 901-910. |
| [2] | CHURKINA G, BROVKIN V, VON BLOH W, et al., 2009. Synergy of rising nitrogen depositions and atmospheric CO2 on land carbon uptake moderately offsets global warming[J]. Global Biogeochemical Cycles, 23(4): GB4027. |
| [3] | CHUAI X W, QI X X, ZHANG X Y, et al., 2018. Land degradation monitoring using terrestrial ecosystem carbon sinks/sources and their response to climate change in China[J]. Land Degradation & Development, 29(10): 3489-3502. |
| [4] | DISE N, ASHMORE M, et al., 2011. Nitrogen as a threat to European terrestrial biodiversity-Chapter 20[J]. European Nitrogen Assessment Sources Effects & Policy Perspectives, 12(2): 463-494. |
| [5] | HASAN S S, ZHEN L, MIAH M G, et al., 2020. Impact of land use change on ecosystem services: A review[J]. Environmental Development, 34: 100527. |
| [6] | PIAO S, CIAIS P, FRIEDLINGSTEIN P, et al., 2009. Spatiotemporal patterns of terrestrial carbon cycle during the 20th century[J]. Global Biogeochemical Cycles, 23(4): GB4026. |
| [7] |
PRAVEEN B, TALUKDAR S, SHAHFAHAD, et al., 2020. Analyzing trend and forecasting of rainfall changes in india using non-parametrical and machine learning approaches[J]. Scientific Reports, 10(1): 10342.
DOI PMID |
| [8] | RU J, WAN S, HUI D, et al., 2022. Increased interannual precipitation variability enhances the carbon sink in a semi-arid grassland[J]. Functional Ecology, 36(4): 987-997. |
| [9] |
STEVENS C J, DISE N B, GOWING D J, 2009. Regional trends in soil acidification and exchangeable metal concentrations in relation to acid deposition rates[J]. Environ Pollut, 157(1): 313-319.
DOI PMID |
| [10] |
WOODWELL G M, WHITTAKER R H, REINERS W A, et al., 1978. The biota and the world carbon budget[J]. Science, 199(4325): 141-146.
PMID |
| [11] | WU J P, LIU Z F, 2013. Effects of biotic factors on net ecosystem production in forests: A review[J]. Ecology and Environmental Sciences, 22(3): 535-540. |
| [12] | YU G R, ZHENG Z M, WANG Q F, et al., 2010. Spatiotemporal pattern of soil respiration of terrestrial ecosystems in China: The development of a geostatistical model and its simulation[J]. Environmental Science & Technology, 44(16): 6074-6080. |
| [13] | YUE C, XU M Y, CIAIS P, et al., 2024. Contributions of ecological restoration policies to China’s land carbon balance[J]. Nature Communications, 15: 9708. |
| [14] |
ZHU L Y, XING H Q, HOU D Y, 2022. Analysis of carbon emissions from land cover change during 2000 to 2020 in Shandong Province, China[J]. Scientific Reports, 12(1): 8021.
DOI PMID |
| [15] |
曹云, 孙应龙, 姜月清, 等, 2022. 黄河流域净生态系统生产力的时空分异特征及其驱动因子分析[J]. 生态环境学报, 31(11): 2101-2110.
DOI |
| CAO Y, SUN Y L, JIANG Y Q, et al., 2022. analysis on temporal-spatial variations and driving factors of net ecosystem productivity in the Yellow River basin[J]. Ecology and Environment, 31(11): 2101-2110. | |
| [16] | 曹云, 张称意, 孙应龙, 等, 2023. 2000-2020年华北地区植被固碳能力时空变化特征及其气象影响分析[J]. 生态学报, 43(9): 3488-3499. |
| CAO Y, ZHANG C G, SUN Y L, et al., 2023. Spatial and temporal patterns of carbon sequestration and their responses to climatic factors in North China from 2000 to 2020[J]. Acta Ecologica Sinica, 43(9): 3488-3499. | |
| [17] | 崔晓伟, 王金胜, 刘志晓, 等, 2024. 碳排放 “双控” 背景下山东省碳中和实现路径研究[J]. 生态学报, 44(21): 9783-9791. |
| CUI X W, WANG J S, LIU Z X, et al., 2024. Path of carbon neutralization under the background of “dual control” of carbon emissions in Shandong Province[J]. Acta Ecologica Sinica, 44(21): 9783-9791. | |
| [18] | 方精云, 黄耀, 朱江玲, 等, 2015. 森林生态系统碳收支及其影响机制[J]. 中国基础科学, 17(3): 20-25. |
| FANG J Y, HUANG Y, ZHU J L, et al., 2015. Carbon budget of forest ecosystems and its driving forces[J]. China Basic Science, 17(3): 20-25. | |
| [19] | 费敦悦, 2016. 基于涡度相关的农田CO2通量和光能利用率研究[D]. 南京: 南京信息工程大学: 1-92. |
| FEI D Y, 2016. CO2 flux and light use efficiency of farmland based on eddy covariance[D]. Nanjing: Nanjing University of Information Science and Technology: 1-92. | |
| [20] |
韩静, 芮旸, 杨坤, 等, 2020. 基于地理探测器和GWR模型的中国重点镇布局定量归因[J]. 地理科学进展, 39(10): 1687-1697.
DOI |
|
HAN J, RUI Y, YANG K, et al., 2020. Quantitative attribution of national key town layout based on geodetector and the geographically weighted regression model[J]. Progress in Geography, 39(10): 1687-1697.
DOI |
|
| [21] | 黄悦悦, 2020. 2000-2018年华北平原植被净初级生产力时空分布及其驱动因素研究[D]. 兰州: 西北师范大学: 1-62. |
| HUANG Y Y, 2020. Spatial-temporal distribution and driving factors of vegetation net primary productivity in north China Plain from 2000 to 2018[D]. Lanzhou: Northwest Normal University: 1-62. | |
| [22] | 刘园园, 2015. 基于RS和GIS的山东省植被覆盖的时空演变特征及其成因研究[J]. 地理科学研究, 4(3): 95-109. |
| LIU Y Y, 2015. Vegetation Covering Spatial-Temporal Changes in Shandong Province Based on RS and GIS[J]. Geographical Science Research, 4(3): 95-1099. | |
| [23] | 刘凤, 曾永年, 2021. 2000-2015年青海高原植被碳源/汇时空格局及变化[J]. 生态学报, 41(14): 5792-5803. |
| LIU F, ZENG Y N, 2021. Analysis of the spatio-temporal variation of vegetation carbon source/sink in Qinghai Plateau from 2000-2015[J]. Acta Ecologica Sinica, 41(14): 5792-5803. | |
| [24] | 孙政国, 2013. 南方草地生态系统生产力和碳储量初步核算研究[D]. 南京: 南京大学: 1-174. |
| SUN Z G, 2013. The study of productivity and carbon storage estimation in the southern of China’s grasslands[D]. Nanjing: Nanjing University: 1-174. | |
| [25] | 石旭霞, 侯继华, 王冰雪, 等, 2018. 长白山阔叶红松林生态系统生产力与温度的关系[J]. 北京林业大学学报, 40(11): 49-57. |
| SHI X X, HOU J H, WANG B X, et al., 2018. Relationship between primary productivity and temperature in broadleaved Pinus koraiensis mixed forest in Changbai Mountains of northeastern China[J]. Journal of Beijing Forestry University, 40(11): 49-57. | |
| [26] |
王劲峰, 徐成东, 2017. 地理探测器: 原理与展望[J]. 地理学报, 72(1): 116-134.
DOI |
|
WANG J F, XU C D, 2017. Geodetector: Principle and prospective[J]. Acta Geographica Sinica, 72(1): 116-134.
DOI |
|
| [27] | 魏永富, 崔英杰, 吴英杰, 2017. 基于Mann-Kendall法与草地分类的气候变化特征[J]. 科学技术与工程, 17(24): 1-8. |
| WEI Y F, CUI Y J, WU Y J, 2017. Climate change characteristics based on Mann-Kendall method and grassland classification[J]. Science Technology and Engineering, 17(24): 1-8. | |
| [28] |
翁升恒, 张玉琴, 姜冬昕, 等, 2023. 福建省森林植被NEP时空变化及影响因子分析[J]. 生态环境学报, 32(5): 845-856.
DOI |
| WENG S H, ZHANG Y Q, JIANG D X, et al., 2023. Spatio-temporal changes and attribution analysis of net ecosystem productivity in forest ecosystem in Fujian province[J]. Ecology and Environment, 32(5): 845-856. | |
| [29] | 吴丽媛, 神祥金, 刘奕雯, 等, 2024. 青藏高原草本沼泽植被净初级生产力时空变化及其对气候变化的响应[J]. 生态学报, 44(5): 2115-2126. |
| WU L Y, SHEN X J, LIU Y W, et al., 2024. Spatio-temporal variation in vegetation net primary productivity and its response to climate change in herbaceous marshes on the Qinghai-Tibet Plateau[J]. Acta Ecologica Sinica, 44(5): 2115-2126. | |
| [30] | 张建云, 刘九夫, 金君良, 等, 2019. 青藏高原水资源演变与趋势分析[J]. 中国科学院院刊, 34(11): 1264-1273. |
| ZHANG J Y, LIU J F, JIN J L, et al., 2019. Evolution and trend of water resources in Qinghai-Tibet Plateau[J]. Bulletin of Chinese Academy of Sciences, 34(11): 1264-1273. | |
| [31] | 周怡婷, 严俊霞, 刘菊, 等, 2024. 2000-2021年黄土高原生态分区NEP时空变化及其驱动因子[J]. 环境科学, 45(5): 2806-2816. |
| ZHOU Y T, YAN J X, LIU J, et al., 2024. Spatio-temporal variation in NEP in Ecological Zoning on the Loess Plateau and its driving factors from 2000 to 2021[J]. Environmental Science, 45(5): 2806-2816. | |
| [32] | 周登文, 刘子涵, 刘玉铠, 2024. 基于像素对比学习的图像超分辨率算法[J]. 自动化学报, 50(1): 181-193. |
| ZHOU D W, LIU Z H, LIU Y K, 2024. Pixel-wise contrastive learning for single image super-resolution[J]. Acta Automatica Sinica, 50(1): 181-193. |
| [1] | YANG Haoyu, HUANG Kangjiang, CHEN Xiaodong, ZHAO Jie, XIONG Jun, TIAN Kang. Evolution of Ecological Spatial Efficiency Pattern and Attribution Analysis of Landscape Pattern in Guizhou Province [J]. Ecology and Environmental Sciences, 2025, 34(6): 902-913. |
| [2] | WU Yutong, YU Ran, YU Qiqi, WANG Cheng, ZHANG Zihan. Evaluation and Multi-Scenario Optimization of Habitat Quality in the Basin of Yangtze River in Anhui Province [J]. Ecology and Environmental Sciences, 2025, 34(6): 961-973. |
| [3] | JIANG Cunzheng, CHEN Anqiang, HU Wanli, FU Bin, ZHU Linli, LIU Yune, LI Mingqi, WANG Chi, ZHANG Dan. Spatiotemporal Variations of NO3−-N Concentration in Shallow Groundwater around Yilong Lake and Its Source Analysis [J]. Ecology and Environmental Sciences, 2025, 34(4): 570-580. |
| [4] | LI Man, WU Dongli, HE Hao, YU Huijie, ZHAO Lin, LIU Cong, HU Zhenghua, LI Qi. Spatio-temporal Evolution and Driving Factors of Carbon Storage in the Yellow River Basin from 1990 to 2020 [J]. Ecology and Environmental Sciences, 2025, 34(3): 333-344. |
| [5] | GUO Zhao, SHI Yun, LIU Tieming, ZHANG Yuxin, YAN Yongzhi. Analysis of Spatiotemporal Patterns and Driving Factors of NPP on the Northern Slope of the Qinling Mountains from 2001 to 2020 [J]. Ecology and Environmental Sciences, 2025, 34(3): 401-410. |
| [6] | ZHAO Lejun, WANG Shiyao, ZHAO Ziyu, HONG Xing, LI Fuxing, WU Jiayi, HUA Jingyu. Spatial and Temporal Variation of AOD in Seven Provinces and Cities of North China Plain from 2008 to 2022 and Its Main Influencing Factors [J]. Ecology and Environmental Sciences, 2025, 34(2): 256-267. |
| [7] | ZHANG Shuhan, JIANG Hailing, YU Hailin, FENG Xinhui. Spatio-temporal Evolution and Driving Force Analysis of Landscape Ecological Risk in Shenyang Modern Metropolitan [J]. Ecology and Environmental Sciences, 2024, 33(9): 1471-1481. |
| [8] | WANG Jiechun, DENG Yujiao, ZHU Huaiwei, KONG Yunqi. Spatiotemporal Variations of Vegetation NPP of Different Ecosystems in Guangdong Province and Its Response to Climate Factors [J]. Ecology and Environmental Sciences, 2024, 33(6): 831-840. |
| [9] | WANG Meinai, FAN Shunxiang, SHU Hanjun, ZHANG Jianjie, CHU Liqi, FA Yuqi. Spatio-temporal Variations in Soil Erosion and Its Economic Value of Soil Conservation in Henan Province [J]. Ecology and Environmental Sciences, 2024, 33(5): 730-744. |
| [10] | ZHANG Miao, WANG Guixia, WANG Changwei, HE Yanyun, XU Yanfang, LI Qi, XU Yang, ZHANG Junxiao, ZHANG Guiqin. Characteristics and Source Analysis of Black Carbon Pollution Changes in Ji’nan City [J]. Ecology and Environmental Sciences, 2024, 33(4): 560-572. |
| [11] | HU Yingying, LUO Hongxia, DAI Shengpei, YU Xuan, DENG Chunmei, LI Hailiang, LIANG Weihong, ZHENG Qian. Evaluation of Ecological Environment Quality and Analysis of Driving Mechanism in Wuzhishan City of Hainan Island Based on Remote Sensing Ecological Indices [J]. Ecology and Environmental Sciences, 2024, 33(10): 1624-1633. |
| [12] | LI Qing, ZHANG Mengyue, YU Mingqiao, LI Xiaoxuan, CHANG Ming, CHEN Libin, DING Sen. Community Structure and Influencing Factors of Macroinvertebrate in Urban Rivers of Dongguan [J]. Ecology and Environmental Sciences, 2024, 33(1): 101-110. |
| [13] | CHEN Wenyu, XIA Lihua, XU Guoliang, YU Shiqin, CHEN Hang, CHEN Jinfeng. Dynamic Variation of NDVI and Its Influencing Factors in the Pearl River Basin from 2000 to 2020 [J]. Ecology and Environmental Sciences, 2022, 31(7): 1306-1316. |
| [14] | LI Menghua, HAN Yingjuan, ZHAO Hui, WANG Yunxia. Analysis on Spatial-temporal Variation Characteristics and Driving Factors of Fractional Vegetation Cover in Ningxia Based on Geographical Detector [J]. Ecology and Environmental Sciences, 2022, 31(7): 1317-1325. |
| [15] | GAO Siqi, DONG Guotao, JIANG Xiaohui, NIE Tong, GUO Xinwei, DANG Suzhen, LI Xinyu, LI Haoyang. Analysis of Vegetation Coverage Changes and Natural Driving Forces of Spatial Distribution in the Source Region of the Yellow River [J]. Ecology and Environmental Sciences, 2022, 31(3): 429-439. |
| Viewed | ||||||
|
Full text |
|
|||||
|
Abstract |
|
|||||
Copyright © 2021 Editorial Office of ACTA PETROLEI SINICA
Address:No. 6 Liupukang Street, Xicheng District, Beijing, P.R.China, 510650
Tel: 86-010-62067128, 86-010-62067137, 86-010-62067139
Fax: 86-10-62067130
Email: syxb@cnpc.com.cn
Support byBeijing Magtech Co.ltd, E-mail:support@magtech.com.cn