Ecology and Environmental Sciences ›› 2025, Vol. 34 ›› Issue (6): 902-913.DOI: 10.16258/j.cnki.1674-5906.2025.06.007
• Research Article [Ecology] • Previous Articles Next Articles
YANG Haoyu1( ), HUANG Kangjiang1, CHEN Xiaodong1, ZHAO Jie1, XIONG Jun2, TIAN Kang1,*()
Received:2025-01-04
Online:2025-06-18
Published:2025-06-11
杨昊彧1(), 黄康江1, 陈晓东1, 赵劼1, 熊军2, 田康1,*()
通讯作者:
* 田康, E-mail: 作者简介:杨昊彧(1994年生),男(布依族),工程师,硕士,国家注册城乡规划师,主要研究方向为国土空间规划。E-mail: yhylobking@163.com
基金资助:CLC Number:
YANG Haoyu, HUANG Kangjiang, CHEN Xiaodong, ZHAO Jie, XIONG Jun, TIAN Kang. Evolution of Ecological Spatial Efficiency Pattern and Attribution Analysis of Landscape Pattern in Guizhou Province[J]. Ecology and Environmental Sciences, 2025, 34(6): 902-913.
杨昊彧, 黄康江, 陈晓东, 赵劼, 熊军, 田康. 贵州省生态空间效率演变及景观格局的影响归因[J]. 生态环境学报, 2025, 34(6): 902-913.
Add to citation manager EndNote|Ris|BibTeX
URL: https://www.jeesci.com/EN/10.16258/j.cnki.1674-5906.2025.06.007
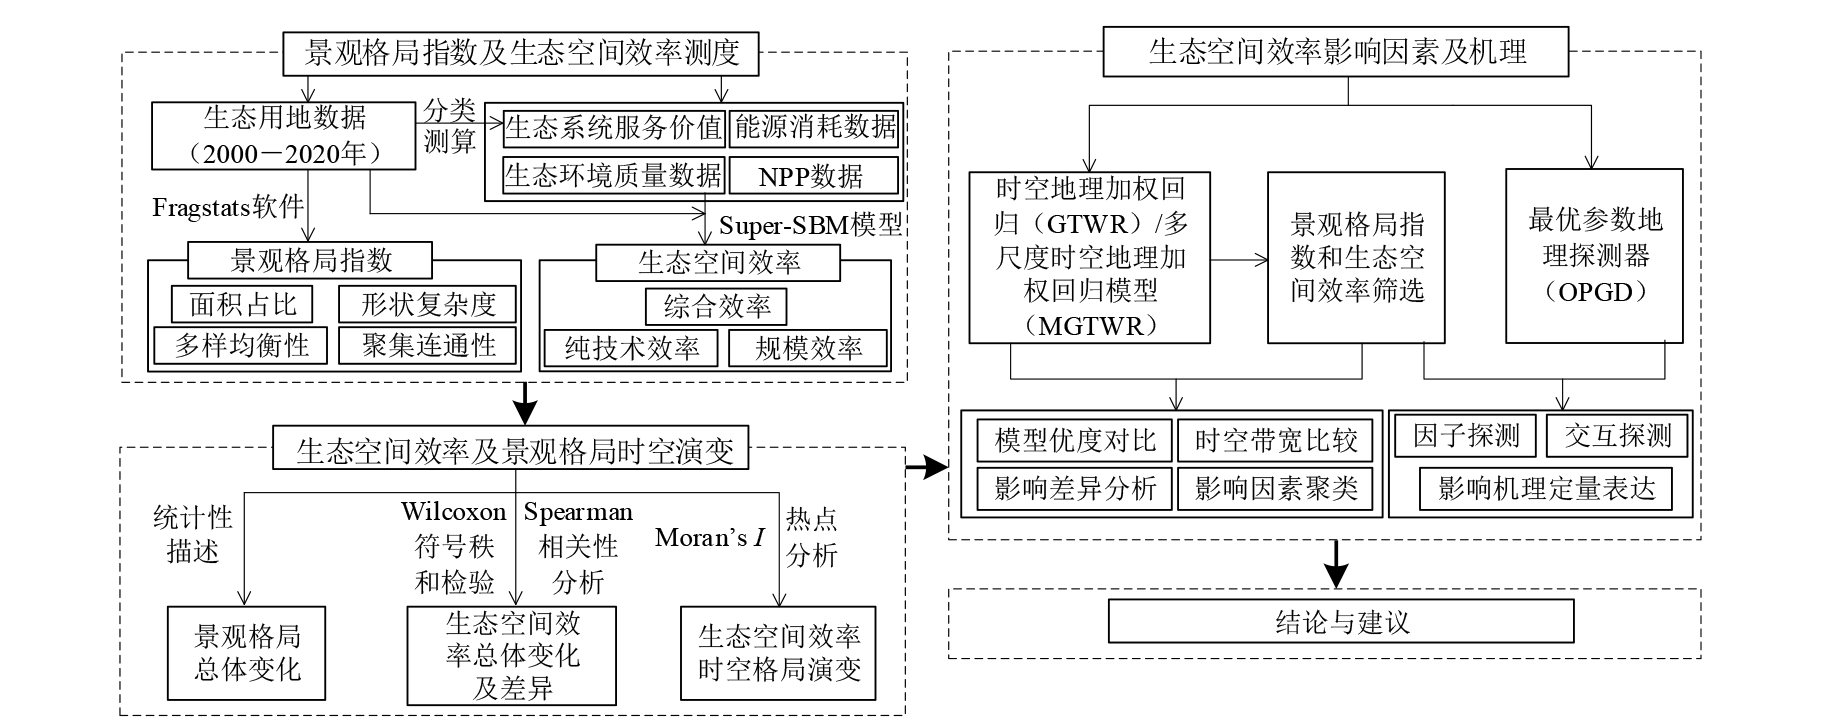
Figure 1 Research framework
| 类型 | 名称 | 单位 | 说明 |
|---|---|---|---|
| 面积占比 | 规模占比 PLAND | % | 生态空间面积占行政区面积及不同类型用地面积占生态空间面积的比例 |
| 最大斑块指数 LPI | % | 表示最大斑块占生态空间总面积的百分比,值越大说明整体性越好 | |
| 形状复杂 | 景观形状指数 LSI | - | 表示生态空间整体形状的复杂程度,值越大形状越复杂 |
| 面积加权形状指数AWMSI | - | 从面积加权的角度考察各斑块对整体形状的综合影响,值越大越复杂 | |
| 多样均衡 | 香农均衡度指数SHEI | - | 取值0-1,值越大表明各类生态用地越均衡 |
| 聚集连通 | 内聚力指数COHESION | % | 表示斑块的自然连通程度,值越大表示斑块连接性越强 |
| 平均最近距离MNN | m | 表示斑块的集中程度,值越小说明聚集趋势越强 | |
| 边缘密度 ED | m∙hm−2 | 表示生态空间的分割化程度,值越大表明分割程度越高 | |
| 聚集度指数 AI | % | 表示斑块在空间上的聚集程度,值越大聚集越紧密 |
Table 1 Description of landscape pattern index
| 类型 | 名称 | 单位 | 说明 |
|---|---|---|---|
| 面积占比 | 规模占比 PLAND | % | 生态空间面积占行政区面积及不同类型用地面积占生态空间面积的比例 |
| 最大斑块指数 LPI | % | 表示最大斑块占生态空间总面积的百分比,值越大说明整体性越好 | |
| 形状复杂 | 景观形状指数 LSI | - | 表示生态空间整体形状的复杂程度,值越大形状越复杂 |
| 面积加权形状指数AWMSI | - | 从面积加权的角度考察各斑块对整体形状的综合影响,值越大越复杂 | |
| 多样均衡 | 香农均衡度指数SHEI | - | 取值0-1,值越大表明各类生态用地越均衡 |
| 聚集连通 | 内聚力指数COHESION | % | 表示斑块的自然连通程度,值越大表示斑块连接性越强 |
| 平均最近距离MNN | m | 表示斑块的集中程度,值越小说明聚集趋势越强 | |
| 边缘密度 ED | m∙hm−2 | 表示生态空间的分割化程度,值越大表明分割程度越高 | |
| 聚集度指数 AI | % | 表示斑块在空间上的聚集程度,值越大聚集越紧密 |
| 类型 | 指标 | 说明 |
|---|---|---|
| 投入 | 生态空间用地面积 | 包含林地、草地、水域、湿地和荒漠五类;单位:km2 |
| 能源消耗量 | 单位:万吨标准煤 | |
| 产出 | 平均植被净初生产力 | 反映生态系统的固碳能力;单位:kg∙m−2∙a−1 |
| 生态环境质量指数均值 | 表征区域环境污染及环境质量状况 | |
| 生态系统服务价值 | 从经济视角核算生态系统为社会提供的产品及服务价值,通过单位面积价值当量因子法分类计算并求和(谢高地等, |
Table 2 Ecological spatial efficiency index system
| 类型 | 指标 | 说明 |
|---|---|---|
| 投入 | 生态空间用地面积 | 包含林地、草地、水域、湿地和荒漠五类;单位:km2 |
| 能源消耗量 | 单位:万吨标准煤 | |
| 产出 | 平均植被净初生产力 | 反映生态系统的固碳能力;单位:kg∙m−2∙a−1 |
| 生态环境质量指数均值 | 表征区域环境污染及环境质量状况 | |
| 生态系统服务价值 | 从经济视角核算生态系统为社会提供的产品及服务价值,通过单位面积价值当量因子法分类计算并求和(谢高地等, |
| 交互类型 | 依据 |
|---|---|
| 独立 | q(X1∩X2)=q(X1)+q(X2) |
| 非线性减弱 | q(X1∩X2)<Min[q(X1), q(X2)] |
| 单因子非线性减弱 | Min[q(X1), q(X2)]<q(X1∩X2)<Max[q(X1), q(X2)] |
| 非线性增强 | q(X1∩X2)>q(X1)+q(X2) |
| 双因子增强 | q(X1∩X2)>Max[q(X1), q(X2)] |
Table 3 Type of double factor interactive detection
| 交互类型 | 依据 |
|---|---|
| 独立 | q(X1∩X2)=q(X1)+q(X2) |
| 非线性减弱 | q(X1∩X2)<Min[q(X1), q(X2)] |
| 单因子非线性减弱 | Min[q(X1), q(X2)]<q(X1∩X2)<Max[q(X1), q(X2)] |
| 非线性增强 | q(X1∩X2)>q(X1)+q(X2) |
| 双因子增强 | q(X1∩X2)>Max[q(X1), q(X2)] |
| 指数 | 2000年 | 2005年 | 2010年 | 2015年 | 2020年 |
|---|---|---|---|---|---|
| 生态PLAND /% | 70.370 | 70.261 | 70.271 | 70.271 | 69.707 |
| 林地PLAND/% | 74.194 | 75.373 | 75.797 | 75.720 | 74.101 |
| 草地PLAND/% | 25.370 | 24.196 | 23.567 | 23.569 | 24.770 |
| 水域PLAND/% | 0.400 | 0.403 | 0.610 | 0.682 | 1.102 |
| 湿地PLAND/% | 0.005 | 0.005 | 0.005 | 0.006 | 0.005 |
| 荒漠PLAND/% | 0.031 | 0.023 | 0.021 | 0.023 | 0.021 |
| LPI/% | 87.308 | 86.654 | 86.059 | 86.445 | 86.491 |
| LSI | 44.228 | 44.171 | 43.568 | 42.787 | 44.172 |
| AWMSI | 34.483 | 34.284 | 33.632 | 33.029 | 34.195 |
| SHEI | 0.369 | 0.361 | 0.363 | 0.4365 | 0.385 |
| COHESION/% | 99.958 | 99.957 | 99.955 | 99.956 | 99.950 |
| MNN/m | 131.199 | 128.663 | 130.454 | 131.992 | 128.514 |
| ED/(m∙hm−2) | 49.725 | 50.249 | 49.650 | 49.145 | 50.521 |
| AI/% | 96.363 | 96.325 | 96.368 | 96.406 | 96.303 |
Table 4 Change of landscape pattern index
| 指数 | 2000年 | 2005年 | 2010年 | 2015年 | 2020年 |
|---|---|---|---|---|---|
| 生态PLAND /% | 70.370 | 70.261 | 70.271 | 70.271 | 69.707 |
| 林地PLAND/% | 74.194 | 75.373 | 75.797 | 75.720 | 74.101 |
| 草地PLAND/% | 25.370 | 24.196 | 23.567 | 23.569 | 24.770 |
| 水域PLAND/% | 0.400 | 0.403 | 0.610 | 0.682 | 1.102 |
| 湿地PLAND/% | 0.005 | 0.005 | 0.005 | 0.006 | 0.005 |
| 荒漠PLAND/% | 0.031 | 0.023 | 0.021 | 0.023 | 0.021 |
| LPI/% | 87.308 | 86.654 | 86.059 | 86.445 | 86.491 |
| LSI | 44.228 | 44.171 | 43.568 | 42.787 | 44.172 |
| AWMSI | 34.483 | 34.284 | 33.632 | 33.029 | 34.195 |
| SHEI | 0.369 | 0.361 | 0.363 | 0.4365 | 0.385 |
| COHESION/% | 99.958 | 99.957 | 99.955 | 99.956 | 99.950 |
| MNN/m | 131.199 | 128.663 | 130.454 | 131.992 | 128.514 |
| ED/(m∙hm−2) | 49.725 | 50.249 | 49.650 | 49.145 | 50.521 |
| AI/% | 96.363 | 96.325 | 96.368 | 96.406 | 96.303 |
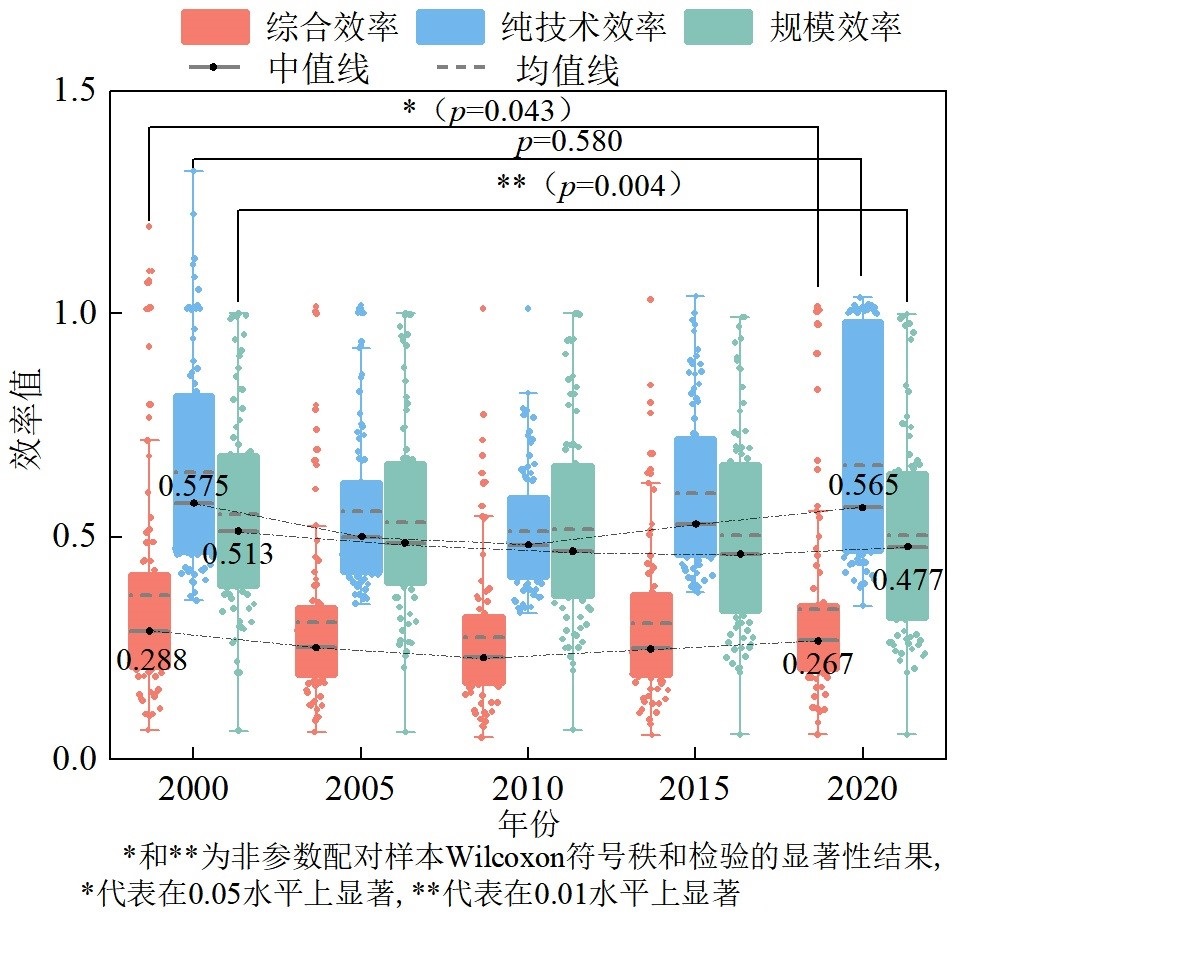
Figure 2 Change and comparison of ecological space efficiency from 2000 to 2020

Figure 3 Spatial distribution pattern of ecological space efficiency in Guizhou Province from 2000 to 2020
| 变量及检验指标 | GTWR | MGTWR | |||
|---|---|---|---|---|---|
| 时间带宽/期 | 空间带宽个数 | 时间带宽/期 | 空间带宽个数 | ||
| 常数项 | 2.805 | 62.377 | 0.315 | 4.283 | |
| 生态PLAND | 2.805 | 62.377 | 0.400 | 5.233 | |
| 水域PLAND | 2.805 | 62.377 | 3.886 | 41.601 | |
| LPI | 2.805 | 62.377 | 1.172 | 15.952 | |
| LSI | 2.805 | 62.377 | 1.891 | 25.749 | |
| SHEI | 2.805 | 62.377 | 0.727 | 9.897 | |
| COHESION | 2.805 | 62.377 | 0.400 | 5.233 | |
| ED | 2.805 | 62.377 | 0.727 | 9.897 | |
| Radj2 | 0.804 | 0.915 | |||
| RSS | 80.991 | 26.902 | |||
| AICc | 559.151 | 354.841 | |||
Table 5 Comparison of bandwidth and model goodness
| 变量及检验指标 | GTWR | MGTWR | |||
|---|---|---|---|---|---|
| 时间带宽/期 | 空间带宽个数 | 时间带宽/期 | 空间带宽个数 | ||
| 常数项 | 2.805 | 62.377 | 0.315 | 4.283 | |
| 生态PLAND | 2.805 | 62.377 | 0.400 | 5.233 | |
| 水域PLAND | 2.805 | 62.377 | 3.886 | 41.601 | |
| LPI | 2.805 | 62.377 | 1.172 | 15.952 | |
| LSI | 2.805 | 62.377 | 1.891 | 25.749 | |
| SHEI | 2.805 | 62.377 | 0.727 | 9.897 | |
| COHESION | 2.805 | 62.377 | 0.400 | 5.233 | |
| ED | 2.805 | 62.377 | 0.727 | 9.897 | |
| Radj2 | 0.804 | 0.915 | |||
| RSS | 80.991 | 26.902 | |||
| AICc | 559.151 | 354.841 | |||
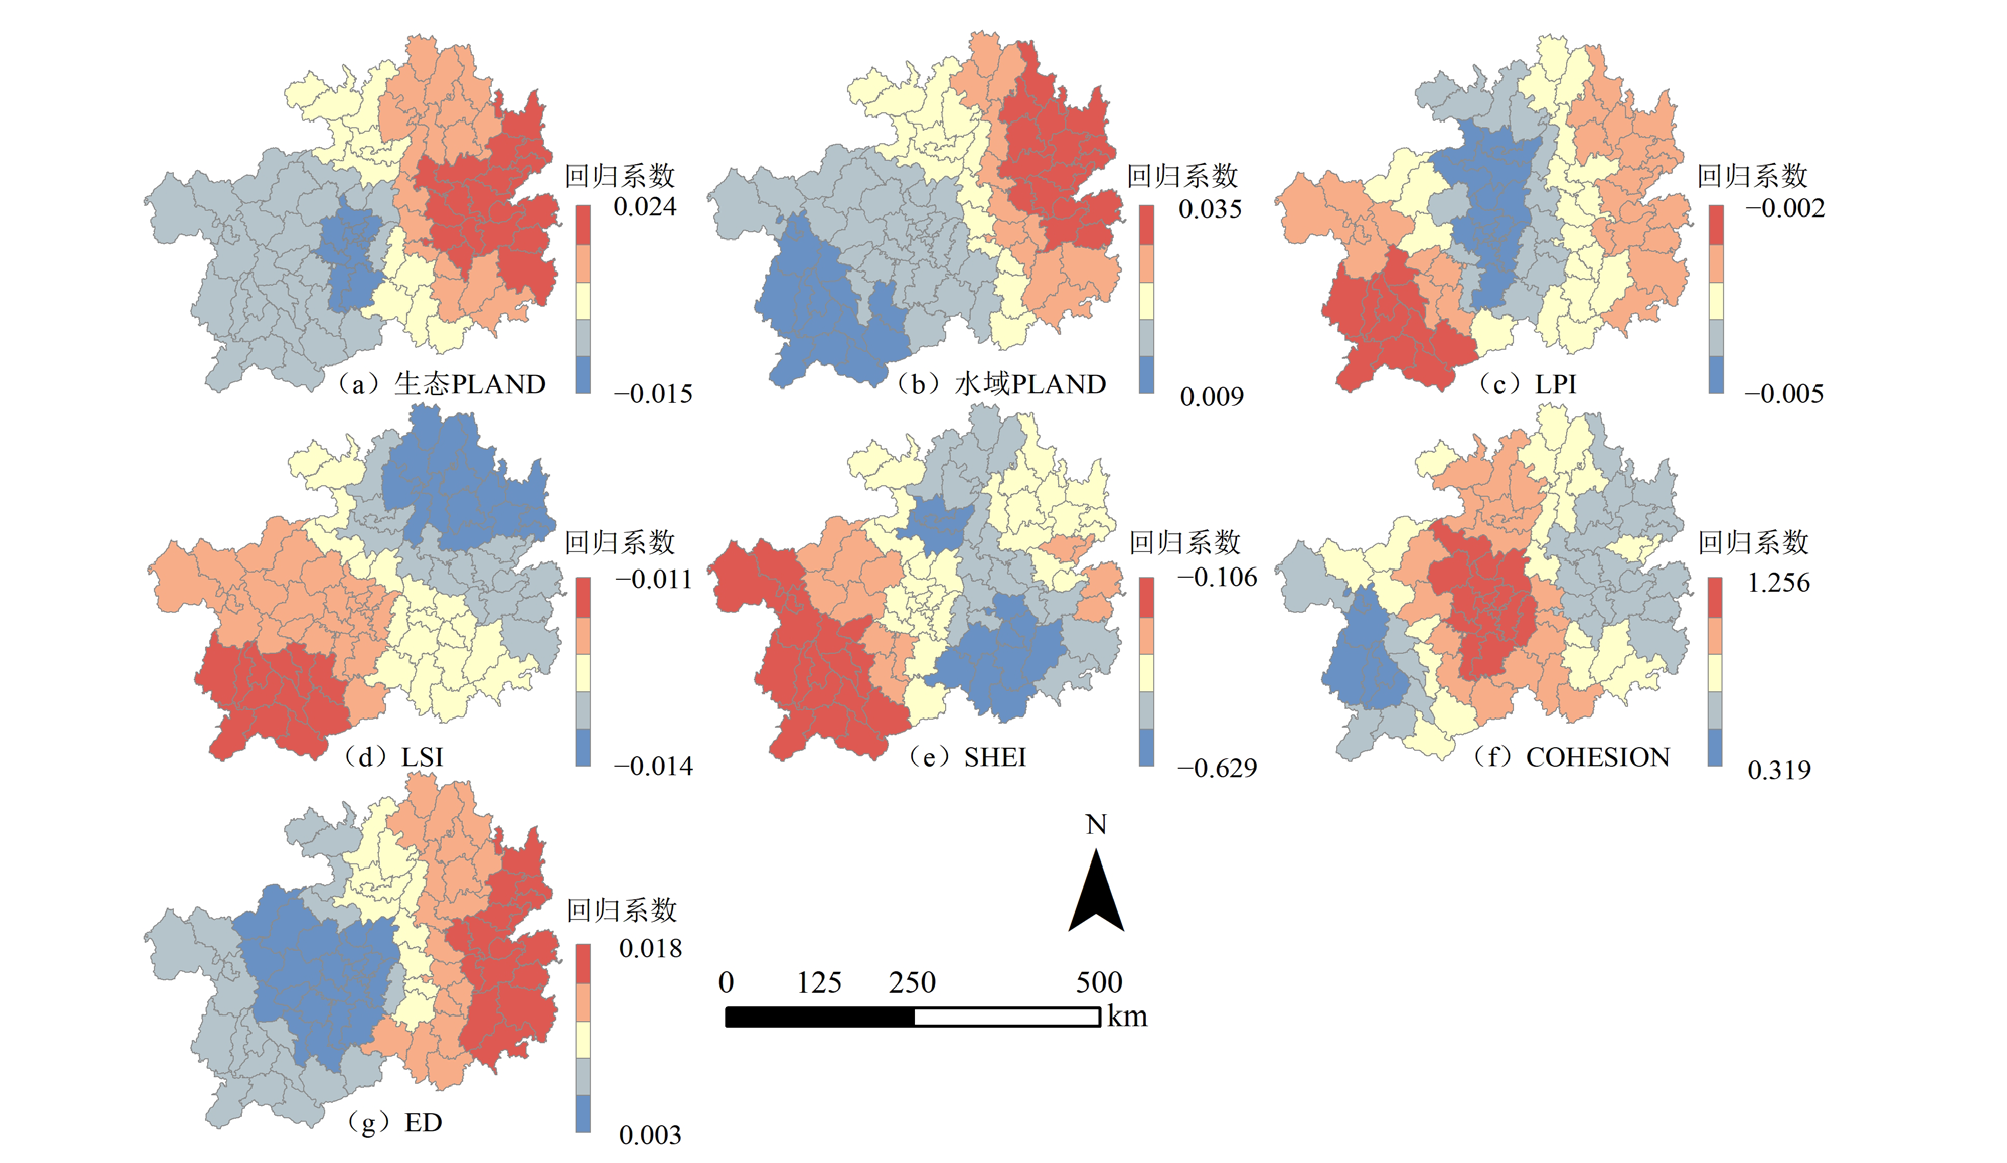
Figure 4 Spatial distribution of mean regression coefficients
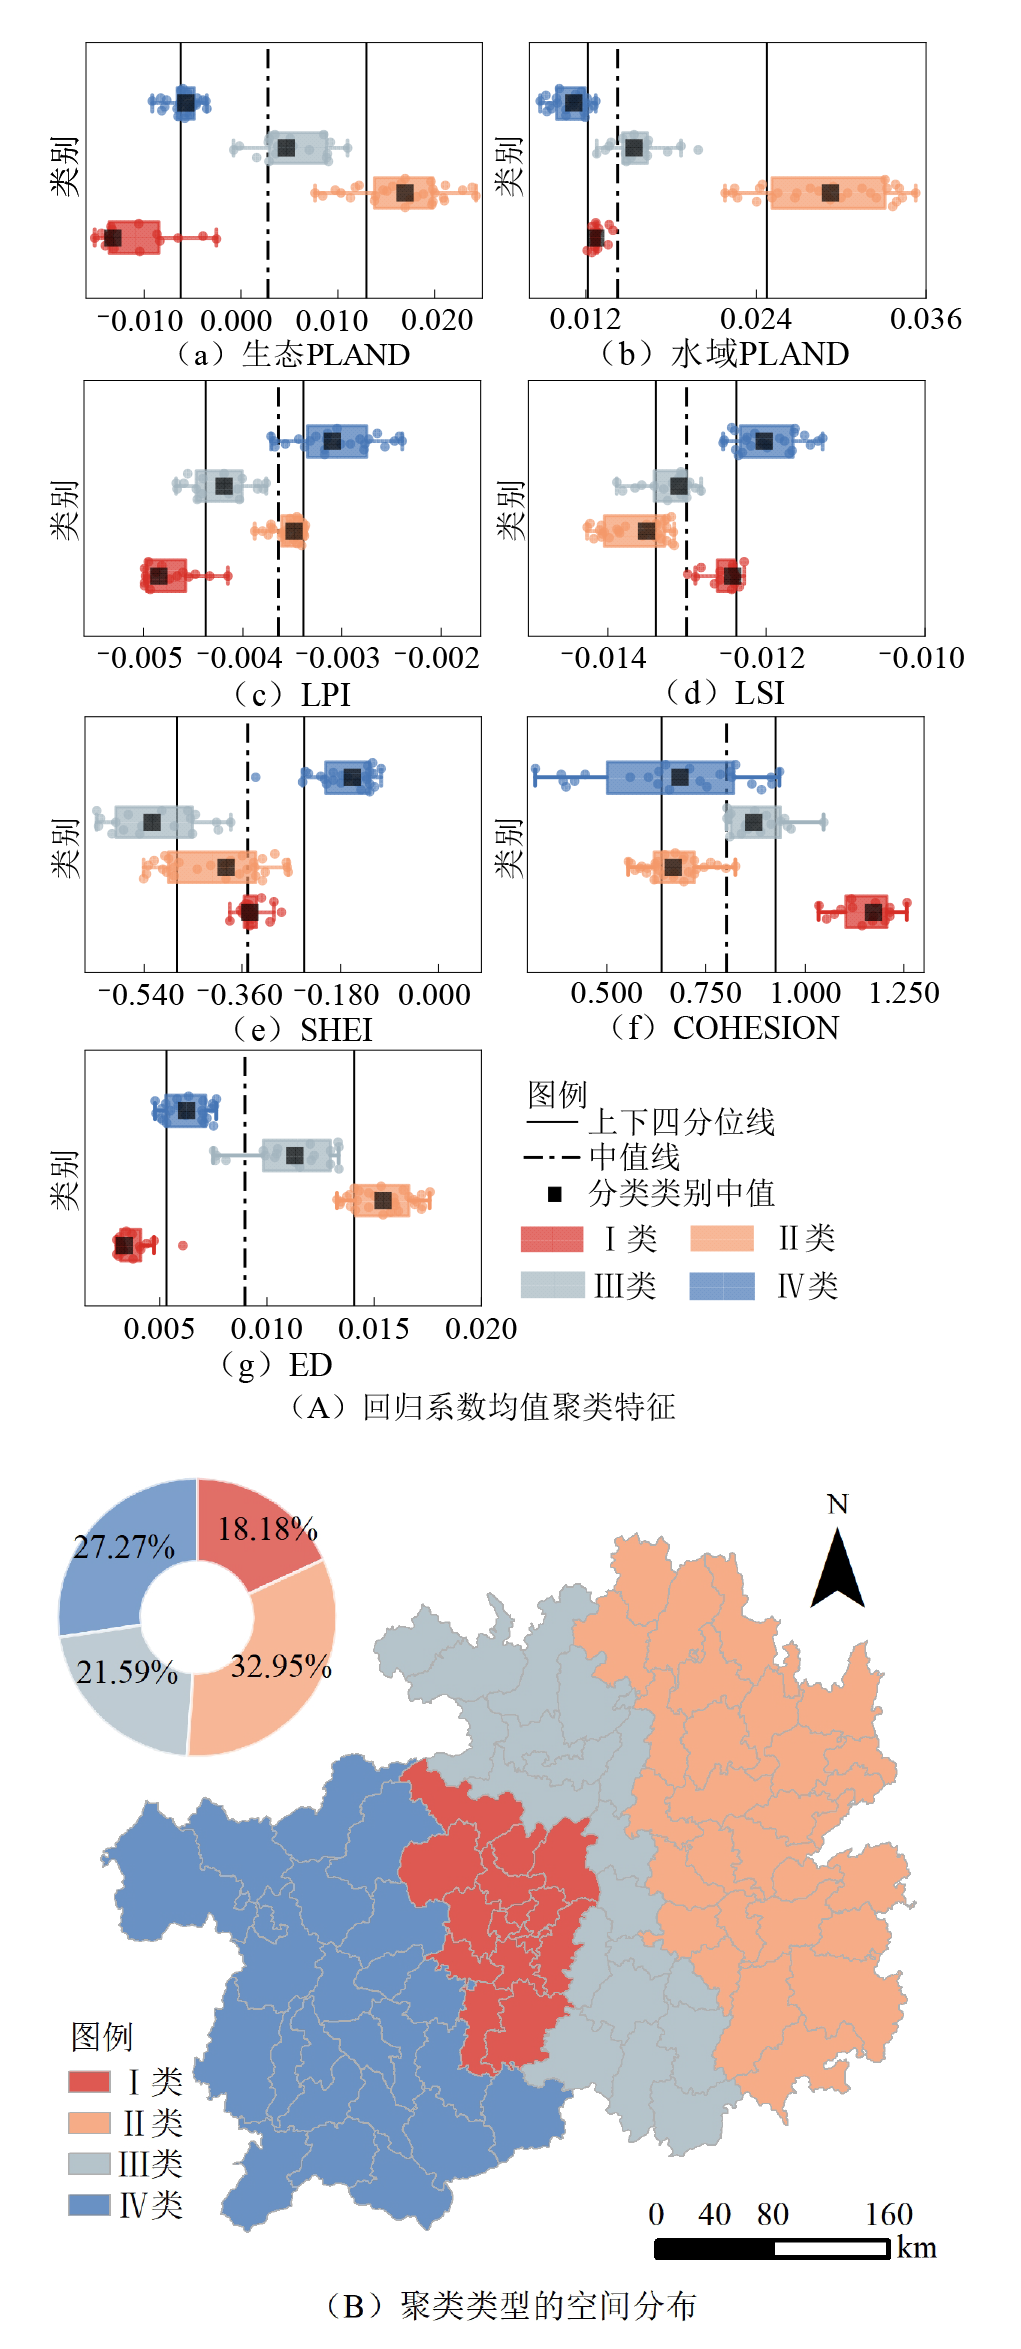
Figure 5 Two-step clustering results of regression coefficients
| 类型 | 自变量 | p值 | q值 | 排序 | 分类数 | 离散方法 |
|---|---|---|---|---|---|---|
| 面积占比 | 生态PLAND | 0.001 | 0.156** 1) | 4 | 9 | 等间隔分类 |
| 水域PLAND | 0.000 | 0.072** | 6 | 8 | 分位数分类 | |
| LPI | 0.000 | 0.177** | 3 | 10 | 自然断点分类 | |
| 形状复杂度 | LSI | 0.000 | 0.393** | 1 | 10 | 等间隔分类 |
| 多样均衡性 | SHEI | 0.000 | 0.121** | 5 | 9 | 几何间隔分类 |
| 聚集连通性 | COHESION | 0.005 | 0.208** | 2 | 7 | 自然断点分类 |
| ED | 0.000 | 0.069** | 7 | 9 | 分位数分类 |
Table 6 Results of single factor detection
| 类型 | 自变量 | p值 | q值 | 排序 | 分类数 | 离散方法 |
|---|---|---|---|---|---|---|
| 面积占比 | 生态PLAND | 0.001 | 0.156** 1) | 4 | 9 | 等间隔分类 |
| 水域PLAND | 0.000 | 0.072** | 6 | 8 | 分位数分类 | |
| LPI | 0.000 | 0.177** | 3 | 10 | 自然断点分类 | |
| 形状复杂度 | LSI | 0.000 | 0.393** | 1 | 10 | 等间隔分类 |
| 多样均衡性 | SHEI | 0.000 | 0.121** | 5 | 9 | 几何间隔分类 |
| 聚集连通性 | COHESION | 0.005 | 0.208** | 2 | 7 | 自然断点分类 |
| ED | 0.000 | 0.069** | 7 | 9 | 分位数分类 |
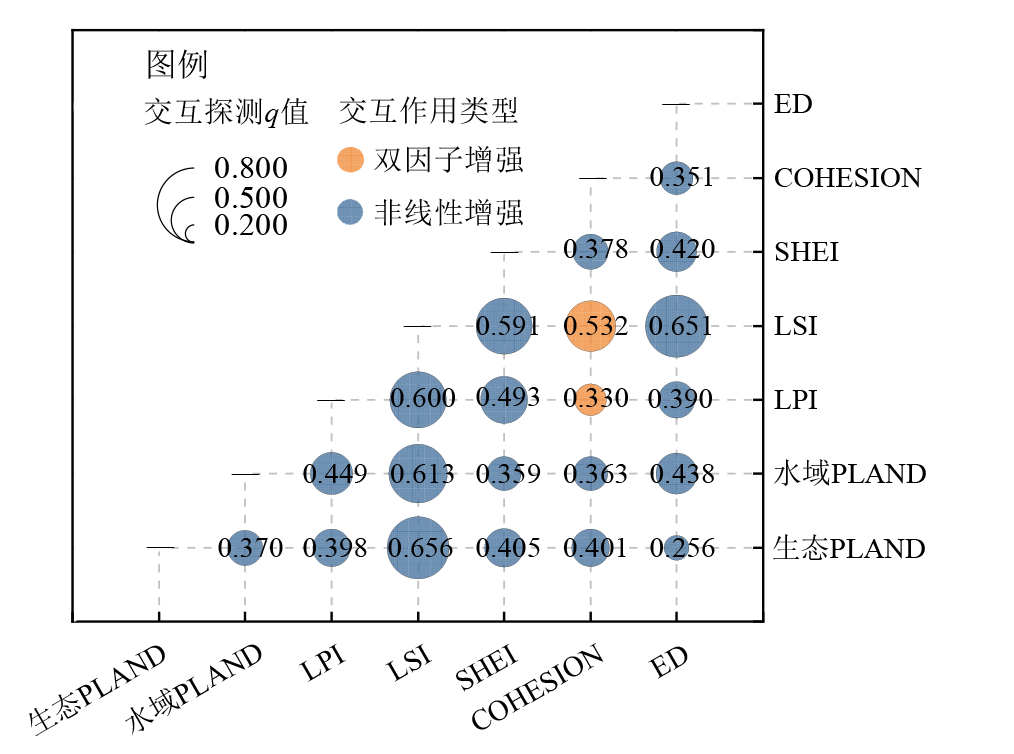
Figure 6 Results of Interaction detection
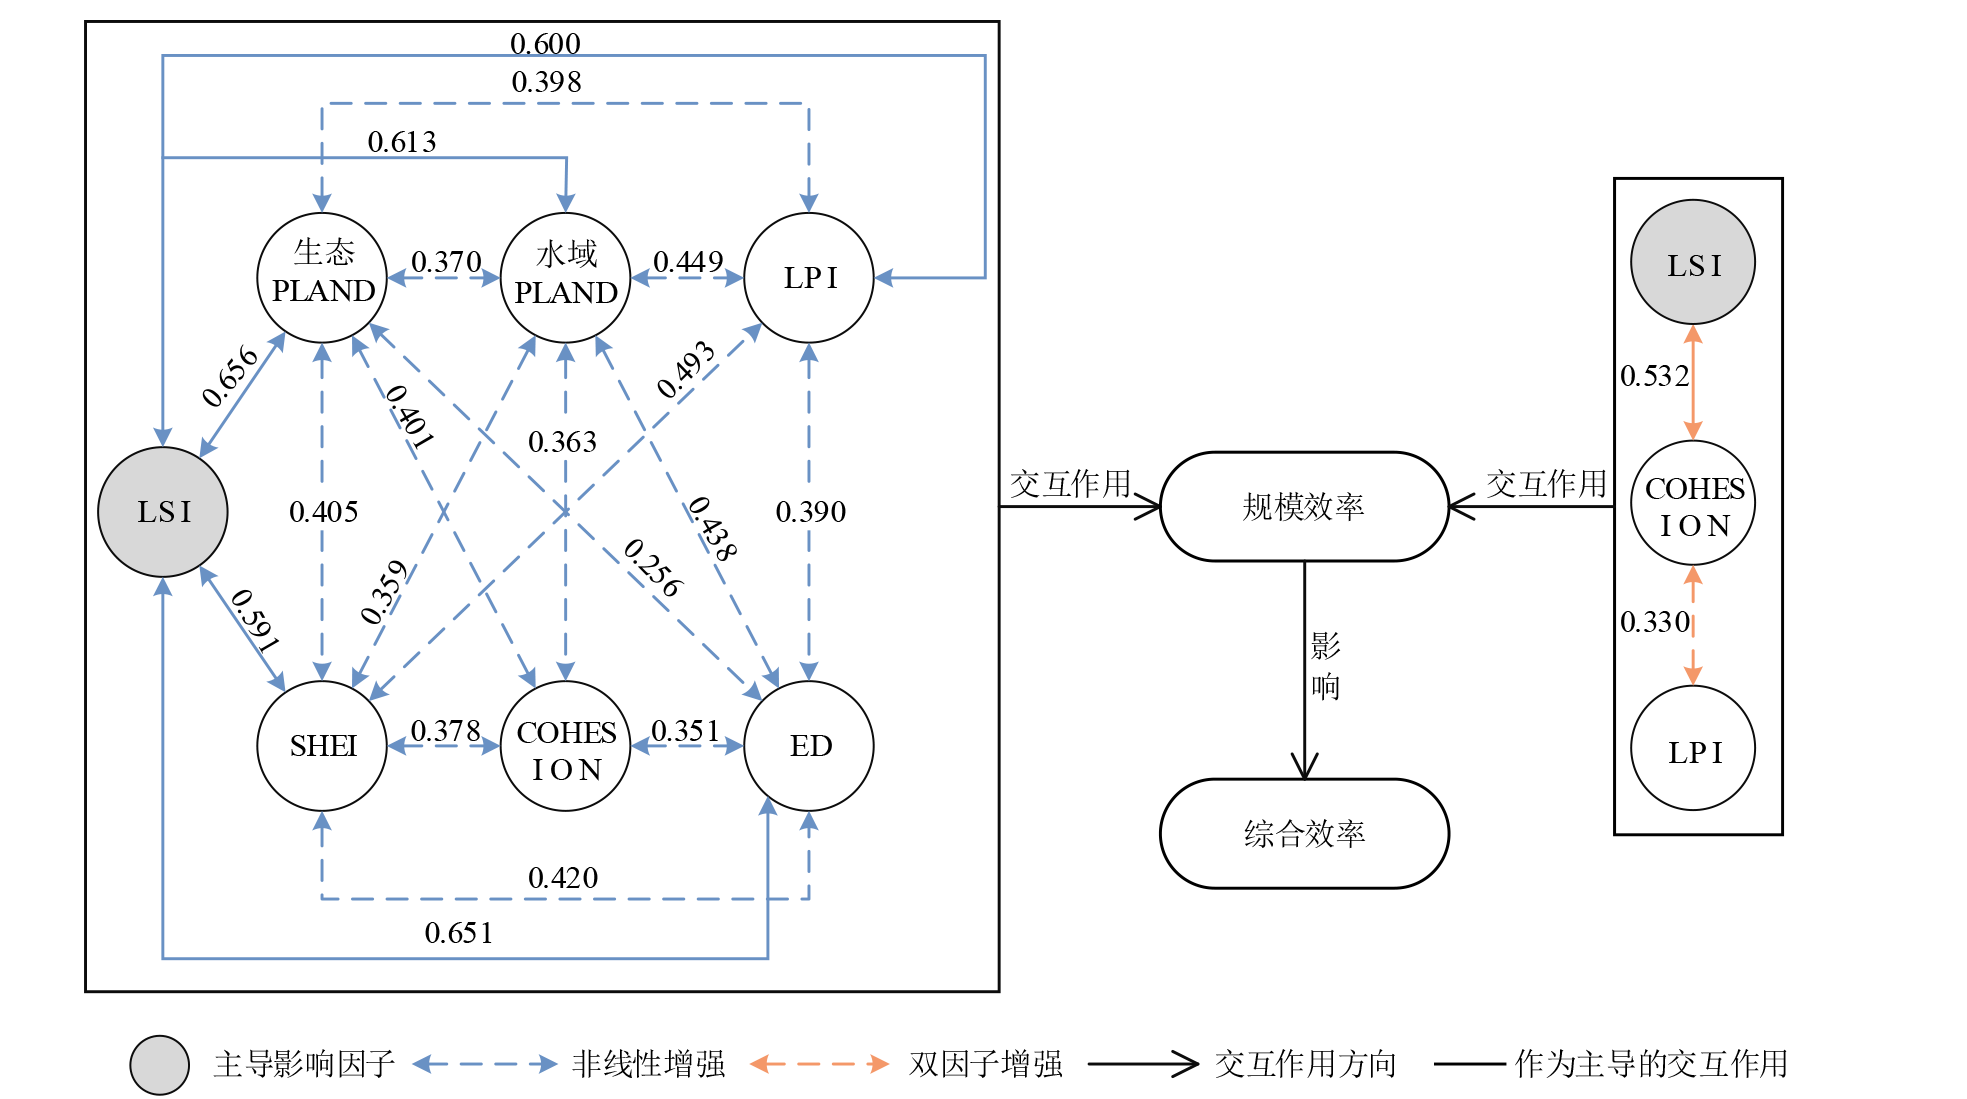
Figure 7 Quantitative expression of influencing mechanism of ecological space use efficiency
| [1] | HUANG B, WU B, BARRY M, 2010. Geographically and temporally weighted regression for modeling spatio-temporal variation in house prices[J]. International Journal of Geographical Information Science, 24(3): 383-401. |
| [2] | LIU W, ZHAN J Y, ZHAO F, et al., 2021. Exploring the coupling relationship between urbanization and energy eco-efficiency: A case study of 281 prefecture-level cities in China[J]. Sustainable Cities and Society, 64: 102563. |
| [3] |
SHI J Y, HE Y F, 2021. Evolution characteristics of urban land use efficiency under environmental constraints in China[J]. Journal of Resources and Ecology, 12(2): 143-154.
DOI |
| [4] | SIVAM A, 2002. Constraints affecting the efficiency of the urban residential land market in developing countries: A case study of India[J]. Habitat International, 26(4): 523-537. |
| [5] | SONG Y Z, WANG J F, GE Y, et al., 2020. An optimal parameters-based geographical detector model enhances geographic characteristics of explanatory variables for spatial heterogeneity analysis: Cases with different types of spatial data[J]. GIScience & Remote Sensing, 57(5): 593-610. |
| [6] | WAGNER H H, FORTIN M J, 2005. Spatial analysis of landscapes: Concepts and statistics[J]. Ecology, 86(8): 1975-1987. |
| [7] | WU C, REN F, HU W, et al., 2019. Multiscale geographically and temporally weighted regression: Exploring the spatiotemporal determinants of housing prices[J]. International Journal of Geographical Information Science, 33(3): 489-511. |
| [8] | XU D, YANG F, YU L, et al., 2021. Quantization of the coupling mechanism between eco-environmental quality and urbanization from multisource remote sensing data[J]. Journal of Cleaner Production, 321: 128948. |
| [9] | 陈德静, 王晓青, 濮励杰, 等, 2023. 城市土地利用效率时空演化及其与经济增长脱钩关系研究——以长三角城市群为例[J]. 长江流域资源与环境, 32(10): 2018-2031. |
| CHEN D J, WANG X Q, PU L J, et al., 2023. Spatiotemporal evolution of urban land use efficiency and its decoupling relationship with economic growth: A case study of Yangtze River delta urban agglomeration[J]. Resources and Environment in the Yangtze Basin, 32(10): 2018-2031. | |
| [10] | 费建波, 夏建国, 胡佳, 等, 2019. 生态空间与生态用地国内研究进展[J]. 中国生态农业学报(中英文), 27(11): 1626-1636. |
| FEI J B, XIA J G, HU J, et al., 2019. Research progress of ecological space and ecological land in China[J]. Chinese Journal of Eco-Agriculture, 27(11): 1626-1636. | |
| [11] |
古佳玮, 郭彩霞, 朱铧楠, 等, 2024. 广东丰溪省级自然保护区景观格局变化及其驱动力研究[J]. 生态环境学报, 33(2): 222-230.
DOI |
| GU J W, GUO C X, ZHU H N, et al., 2024. Landscape pattern evolution and driving forces analysis of the Fengxi provincial nature reserve in Guangdong Province[J]. Ecology and Environmental Sciences, 33(2): 222-230. | |
| [12] | 洪歌, 吴雪飞, 蔡锐鸿, 2023. 最佳网格分析尺度下城市绿色基础设施的景观格局对碳汇绩效的影响研究[J]. 中国园林, 39(3): 138-144. |
| HONG G, WU X F, CAI R H, 2023. Influence of urban green infrastructure landscape pattern on carbon sequestration performance at the optimal grid unit[J]. Chinese Landscape Architecture, 39(3): 138-144. | |
| [13] |
李珊, 温榕冰, 李建军, 等, 2023. 中国五大城市群用地景观格局对碳排放绩效的影响[J]. 经济地理, 43(12): 91-102.
DOI |
|
LI S, WEN R B, LI J J, et al., 2023. Impact of land use landscape pattern on carbon emission performance in five major urban agglomerations in China[J]. Economic Geography, 43(12): 91-102.
DOI |
|
| [14] | 梁归, 方凤满, 李俊峰, 2023. 珠三角城市群生态效率时空演变及驱动因素[J]. 生态学杂志, 42(8): 1973-1981. |
| LIANG G, FANG F M, LI J F, 2023. Spatial and temporal evolution and drivers of eco-efficiency in the Pearl River delta urban agglomeration[J]. China Journal of Ecology, 42(8): 1973-1981. | |
| [15] | 路超, 齐伟, 李乐, 等, 2012. 二维与三维景观格局指数在山区县域景观格局分析中的应用[J]. 应用生态学报, 23(5): 1351-1358. |
| LU C, QI W, LI L, et al., 2012. Applications of 2D and 3D landscape patter indices in landscape pattern analysis of mountainous area at county level[J]. Chinese Journal of Applied Ecology, 23(5): 1351-1358. | |
| [16] | 罗雅文, 周燕, 禹佳宁, 等, 2024. 梁子湖流域生态系统服务簇时空演变及其驱动研究[J]. 生态学报, 44(21): 1-19. |
| LUO Y W, ZHOU Y, YU J N, et al., 2024. Spatio-temporal changes and driving factors of ecosystem service bundles: A case study of Liangzi Lake basin[J]. Acta Ecologica Sinica, 44(21): 1-19. | |
| [17] | 马才学, 杨蓉萱, 柯新利, 等, 2022. 城市扩张背景下生态用地格局与生态效率的多尺度关联分析[J]. 生态科学, 41(5): 1-10. |
| MA C X, YANG R X, KE X L, et al., 2022. Multi-scale correlation analysis of ecological land use pattern and ecological efficiency under urban expansion[J]. Ecological Science, 41(5): 1-10. | |
| [18] | 马慧君, 杨肖丽, 高甜, 2023. 我国中部地区水资源利用效率评价及归因分析[J]. 中国环境科学, 43(5): 2662-2672. |
| MA H J, YANG X L, GAO T, 2023. Evaluation and attribution of water resource utilization efficiency in the central China[J]. China Land Science, 43(5): 2662-2672. | |
| [19] | 马林燕, 张仁慧, 潘子纯, 等, 2022. 中国省际耕地利用生态效率时空格局演变及影响因素分析——基于2000-2019年面板数据[J]. 中国土地科学, 36(3): 74-85. |
| MA L Y, ZHANG R H, PAN Z C, et al., 2022. Analysis of the evolution and influencing factors of temporal and spatial pattern of eco-efficiency of cultivated land use among provinces in China: Based on panel data from 2000 to 2019[J]. China Land Science, 36(3): 74-85. | |
| [20] |
彭薇, 熊科, 2018. 环境压力视角的广东省市域生态效率综合评价[J]. 经济地理, 38(8): 179-186.
DOI |
|
PENG W, XIONG K, 2018. Ecological efficiency evaluation and spatial evolution of Guangdong Province from the perspective of environmental pressure[J]. Economic Geography, 38(8): 179-186.
DOI |
|
| [21] |
王劲峰, 徐成东, 2017. 地理探测器: 原理与展望[J]. 地理学报, 72(1): 116-134.
DOI |
|
WANG J F, XU C D, 2017. Geodetector: Principle and prospective[J]. Acta Geographica Sinica, 72(1): 116-134.
DOI |
|
| [22] | 魏建飞, 高威, 李强, 等, 2023. 长江经济带国土空间效率差异演进及驱动机理研究[J]. 中国土地科学, 37(5): 101-112. |
| WEI J F, GAO W, LI Q, et al., 2023. Analysis on spatial differences and driving mechanisms of territorial space efficiency in the Yangtze River economic belt[J]. China Land Science, 37(5): 101-112. | |
| [23] | 谢高地, 张彩霞, 张雷明, 等, 2015. 基于单位面积价值当量因子的生态系统服务价值化方法改进[J]. 自然资源学报, 30(8): 1243-1254. |
|
XIE G D, ZHANG C X, ZHANG L M, et al., 2015. Improvement of the evaluation method for ecosystem service value based on per unit area[J]. Journal of Natural Resources, 30(8): 1243-1254.
DOI |
|
| [24] | 谢梦, 吴伟成, 2024. 赣东北土地利用及景观格局变化对生态系统服务价值的影响[J]. 水土保持研究, 31(3): 331-341. |
| XIE M, WU W C, 2024. Impacts of change in land use and landscape pattern on ecosystem service value in northeast of Jiangxi Province[J]. Research of Soil and Water Conservation, 31(3): 331-341. | |
| [25] | 杨斌, 2021. 生态文明背景下国土空间利用效率研究——以长三角城市群为例[D]. 武汉: 中国地质大学. |
| YANG B, 2021. Study on land space use efficiency in the context of ecological civilization: A case study of the urban agglomeration in the middle reaches of the Yangtze River, China[D]. Wuhan: China University of Geosciences. | |
| [26] | 杨昊彧, 曾坚, 田康, 2023. 人群聚集与用地构成关系下的职住平衡研究——以贵阳市主城区为例[J]. 南方建筑 (5): 27-36. |
| YANG H Y, ZENG J, TIAN K, 2023. Jobs-housing balance under the relation between population aggregation and land-use structure: A case study based on central urban area in Guiyang City[J]. South Architecture (5): 27-36. | |
| [27] |
叶健, 胡鑫, 徐鸿蒙, 等, 2021. 多尺度GTWR城市住宅价格建模与分析[J]. 测绘学报, 50(9): 1266-1274.
DOI |
|
YE J, HU X, XU H M, et al., 2021. Modeling and analysis of urban housing price models based on multiscale geographically and temporally weighted regression[J]. Acta Geodaetica et Cartographica Sinica, 50(9): 1266-1274.
DOI |
|
| [28] | 岳文泽, 王田雨, 甄延临, 2020. “三区三线” 为核心的统一国土空间用途管制分区[J]. 中国土地科学, 34(5): 52-59, 68. |
| YUE W Z, WANG T Y, ZHEN Y L, 2020. Unified zoning of territorial space use control derived from the core concept of “three types of spatial zones and alert-lines”[J]. China Land Science, 34(5): 52-59, 68. | |
| [29] | 詹琉璐, 杨建州, 2024. 我国森林生态产品价值实现效率研究——基于投入产出分析框架[J]. 经济问题 (8): 34-42. |
| ZHAN L L, YANG J Z, 2024. The research on the efficiency of realizing the value of forest ecological products in China: Based on the input-output analysis framework[J]. On Economic Problems (8): 34-42. | |
| [30] | 张乐, 雷金睿, 陈宗铸, 等, 2025. 海南岛三大流域景观生态风险时空演变及其驱动因素探测[J]. 生态学报, 45(4): 1646-1658. |
| ZHANG L, LEI J R, CHEN Z Z, et al., 2025. Spatiotemporal evolution characteristics and inueneing factors of landeape ecological risks in the three major basins of Hainan Island, China[J]. Acta Ecologica Sinica, 45(4): 1646-1658. | |
| [31] | 张紫怡, 曹妍, 张立亭, 等, 2024. 赣州市生境质量和景观格局间时空非平稳性关联[J]. 农业工程学报, 40(6): 347-356. |
| ZHANG Z Y, CAO Y, ZHANG L T, et al., 2024. Spatial and temporal non-stationary relationship between habitat quality and landscape pattern in Ganzhou City of China[J]. Transactions of the Chinese Society of Agricultural Engineering, 40(6): 347-356. | |
| [32] |
赵兰兰, 李先东, 夏咏, 2023. 乡村振兴视阈下草地畜牧业生态效率评价及影响因素研究——基于北疆纯牧区、半农半牧区案例的分析[J]. 草地学报, 31(10): 3074-3084.
DOI |
| ZHAO L L, LI X D, XIA Y, 2023. Evaluation of eco-efficiency of grassland animal husbandry in the light of rural revitalization and the influencing factors: A case of purely pastoral, semi-agricultural and semi-pastoral areas in the northern territory[J]. Acta Agrestia Sinica, 31(10): 3074-3084. |
| [1] | LIU Honglin, ZHAO Fangkai, YANG Lei, SHEN Linjun, YANG Kaifeng, LI Min, CHEN Liding. Study on Heavy Metal Pollution in Urban Park Soil and Influencing Factors: A Case Study of Ningbo City [J]. Ecology and Environmental Sciences, 2025, 34(5): 773-783. |
| [2] | ZHANG Renfei, XIAO Meng, LIU Zhicheng. Spatio-temporal Heterogeneity and Driving Factors of Landscape Fragmentation in Beijing-Tianjin-Hebei Region [J]. Ecology and Environmental Sciences, 2025, 34(3): 461-473. |
| [3] | GU Jiawei, GUO Caixia, ZHU Huanan, TAN Yukun, CHEN Hongyue. Landscape Pattern Evolution and Driving Forces Analysis of the Fengxi Provincial Nature Reserve in Guangdong Province [J]. Ecology and Environmental Sciences, 2024, 33(2): 222-230. |
| [4] | ZHANG Junwei, XIA Shengjie, CHEN Huiru, LIU Yanhong. Influence of Landscape Pattern Evolution on Thermal Environment of Urban Agglomerations in Central Shanxi Province [J]. Ecology and Environmental Sciences, 2023, 32(5): 943-955. |
| [5] | WANG Chenxi, ZHANG Qiongrui, ZHANG Ruoqi, SUN Xuechao, XU Songjun. Effects of Landscape Pattern on Water Quality Purification Service in the Pearl River Basin in Guangdong Province [J]. Ecology and Environmental Sciences, 2022, 31(7): 1425-1433. |
| [6] | XUAN Jin, LI Zuchan, ZOU Cheng, QIN Zibo, WU Yahua, HUANG Liujing. Multi-scale Effects of Central Bar Landscape Class and Pattern on Plant Diversity in Minjiang River: The Case of Minjiang River Basin (Fuzhou Section) Planning [J]. Ecology and Environmental Sciences, 2022, 31(12): 2320-2330. |
| [7] | BIAN Zhenxing, ZHANG Yufei, GUO Xiaoyu, LIN Lin, YU Miao. Effects of Agricultural Landscape Patterns on the Food Web of Pests and Predatory Natural Enemies in Low Mountain and Hilly Areas [J]. Ecology and Environmental Sciences, 2022, 31(1): 79-88. |
| [8] | DONG Xin, LANG Jiayu, CHUYUAN Mengran, ZHAO Shanshan, ZHANG Jindong, BAI Wenke. The Seasonal Characteristics of Home Range and Habitat Utilization of Sichuan Golden Monkeys (Rhinopithecus roxellana) [J]. Ecology and Environmental Sciences, 2021, 30(7): 1342-1352. |
| [9] | HU Lin, LI Siyue. Scale Effects of Land Use Structure and Landscape Pattern on Water Quality in the Longchuan River Basin [J]. Ecology and Environmental Sciences, 2021, 30(7): 1470-1481. |
| [10] | LEI Jinrui, CHEN Zongzhu, CHEN Yiqing, CHEN Xiaohua, LI Yuanling, WU Tingtian. Landscape Pattern Changes and Driving Factors Analysis of Wetland in Hainan Island during 1990-2018 [J]. Ecology and Environmental Sciences, 2020, 29(1): 59-70. |
| Viewed | ||||||
|
Full text |
|
|||||
|
Abstract |
|
|||||
Copyright © 2021 Editorial Office of ACTA PETROLEI SINICA
Address:No. 6 Liupukang Street, Xicheng District, Beijing, P.R.China, 510650
Tel: 86-010-62067128, 86-010-62067137, 86-010-62067139
Fax: 86-10-62067130
Email: syxb@cnpc.com.cn
Support byBeijing Magtech Co.ltd, E-mail:support@magtech.com.cn