Ecology and Environment ›› 2024, Vol. 33 ›› Issue (10): 1624-1633.DOI: 10.16258/j.cnki.1674-5906.2024.10.014
• Research Article [Environmental Science] • Previous Articles Next Articles
HU Yingying1,3( ), LUO Hongxia1,*(), DAI Shengpei2,3, YU Xuan1, DENG Chunmei1, LI Hailiang1, LIANG Weihong1, ZHENG Qian1
Received:2024-05-21
Online:2024-10-18
Published:2024-11-15
Contact:
LUO Hongxia
胡盈盈1,3(), 罗红霞1,*(), 戴声佩2,3, 禹萱1, 邓春梅1, 李海亮1, 梁伟红1, 郑倩1
通讯作者:
罗红霞
作者简介:胡盈盈(1992年生),女,助理研究员,主要从事资源与环境遥感监测。E-mail: hyy1992@catas.cn
基金资助:CLC Number:
HU Yingying, LUO Hongxia, DAI Shengpei, YU Xuan, DENG Chunmei, LI Hailiang, LIANG Weihong, ZHENG Qian. Evaluation of Ecological Environment Quality and Analysis of Driving Mechanism in Wuzhishan City of Hainan Island Based on Remote Sensing Ecological Indices[J]. Ecology and Environment, 2024, 33(10): 1624-1633.
胡盈盈, 罗红霞, 戴声佩, 禹萱, 邓春梅, 李海亮, 梁伟红, 郑倩. 基于遥感生态指数的海南五指山市生态环境质量评价及成因分析[J]. 生态环境学报, 2024, 33(10): 1624-1633.

Figure 1 Study area overview
| 数据类型 | 空间分辨率 | 时间范围 | 来源 |
|---|---|---|---|
| Landsat 7、8 | 30 m | 2001、2005、2010、 2015、2021年 | 地理空间数据云 |
| dem (ASTER GDEM V3) | 30 m | ‒ | 地理空间数据云 |
| pre、tem | ‒ | 2021年 | 海南省气候中心 |
| plant、pop、gdp | ‒ | 2021年 | 五指山统计年鉴 |
Table 1 Information about data
| 数据类型 | 空间分辨率 | 时间范围 | 来源 |
|---|---|---|---|
| Landsat 7、8 | 30 m | 2001、2005、2010、 2015、2021年 | 地理空间数据云 |
| dem (ASTER GDEM V3) | 30 m | ‒ | 地理空间数据云 |
| pre、tem | ‒ | 2021年 | 海南省气候中心 |
| plant、pop、gdp | ‒ | 2021年 | 五指山统计年鉴 |
| 主成分 | 2001年 | 2005年 | 2010年 | 2015年 | 2021年 | |||||||||
|---|---|---|---|---|---|---|---|---|---|---|---|---|---|---|
| 特征值 | 贡献率/% | 特征值 | 贡献率/% | 特征值 | 贡献率/% | 特征值 | 贡献率/% | 特征值 | 贡献率/% | |||||
| PC1 | 0.0211 | 78.77 | 0.0195 | 87.75 | 0.0120 | 76.49 | 0.0110 | 89.38 | 0.0218 | 76.54 | ||||
| PC2 | 0.0032 | 90.85 | 0.0020 | 96.94 | 0.0024 | 91.56 | 0.0011 | 98.15 | 0.0048 | 93.26 | ||||
| PC3 | 0.0024 | 100.00 | 0.0007 | 99.99 | 0.0013 | 99.99 | 0.0002 | 100.00 | 0.0017 | 99.39 | ||||
| PC4 | 0.0000 | 100.00 | 0.0000 | 100.00 | 0.0000 | 100.00 | 0.0000 | 100.00 | 0.0002 | 100.00 | ||||
Table 2 Results of principal component analysis of RSEI
| 主成分 | 2001年 | 2005年 | 2010年 | 2015年 | 2021年 | |||||||||
|---|---|---|---|---|---|---|---|---|---|---|---|---|---|---|
| 特征值 | 贡献率/% | 特征值 | 贡献率/% | 特征值 | 贡献率/% | 特征值 | 贡献率/% | 特征值 | 贡献率/% | |||||
| PC1 | 0.0211 | 78.77 | 0.0195 | 87.75 | 0.0120 | 76.49 | 0.0110 | 89.38 | 0.0218 | 76.54 | ||||
| PC2 | 0.0032 | 90.85 | 0.0020 | 96.94 | 0.0024 | 91.56 | 0.0011 | 98.15 | 0.0048 | 93.26 | ||||
| PC3 | 0.0024 | 100.00 | 0.0007 | 99.99 | 0.0013 | 99.99 | 0.0002 | 100.00 | 0.0017 | 99.39 | ||||
| PC4 | 0.0000 | 100.00 | 0.0000 | 100.00 | 0.0000 | 100.00 | 0.0000 | 100.00 | 0.0002 | 100.00 | ||||
| 年份 | 2001 | 2005 | 2010 | 2015 | 2021 |
|---|---|---|---|---|---|
| RSEI均值 | 0.579 | 0.601 | 0.550 | 0.673 | 0.682 |
Table 3 Average RSEI in Wuzhishan City from 2001 to 2021
| 年份 | 2001 | 2005 | 2010 | 2015 | 2021 |
|---|---|---|---|---|---|
| RSEI均值 | 0.579 | 0.601 | 0.550 | 0.673 | 0.682 |

Figure 2 Spatial distribution of RSEI in Wuzhishan City form 2001-2021
| RSEI等级 | 2001年 | 2005年 | 2010年 | 2015年 | 2021年 | |||||||||
|---|---|---|---|---|---|---|---|---|---|---|---|---|---|---|
| 面积/km2 | 占比/% | 面积/km2 | 占比/% | 面积/km2 | 占比/% | 面积/km2 | 占比/% | 面积/km2 | 占比/% | |||||
| 差 | 3.02 | 0.26 | 2.23 | 0.20 | 0.10 | 0.01 | 0.39 | 0.03 | 1.14 | 0.10 | ||||
| 较差 | 71.21 | 6.25 | 71.92 | 6.30 | 40.44 | 3.55 | 8.42 | 0.74 | 25.26 | 2.22 | ||||
| 一般 | 511.00 | 44.82 | 410.35 | 35.95 | 783.99 | 68.81 | 206.74 | 18.13 | 130.01 | 11.42 | ||||
| 良 | 549.74 | 48.22 | 642.92 | 56.32 | 314.63 | 27.61 | 875.12 | 76.74 | 977.48 | 85.88 | ||||
| 优 | 5.05 | 0.44 | 14.17 | 1.24 | 0.22 | 0.02 | 49.62 | 4.35 | 4.30 | 0.38 | ||||
Table 4 Statistics of different grades of RSEI in the study area from 2001 to 2021
| RSEI等级 | 2001年 | 2005年 | 2010年 | 2015年 | 2021年 | |||||||||
|---|---|---|---|---|---|---|---|---|---|---|---|---|---|---|
| 面积/km2 | 占比/% | 面积/km2 | 占比/% | 面积/km2 | 占比/% | 面积/km2 | 占比/% | 面积/km2 | 占比/% | |||||
| 差 | 3.02 | 0.26 | 2.23 | 0.20 | 0.10 | 0.01 | 0.39 | 0.03 | 1.14 | 0.10 | ||||
| 较差 | 71.21 | 6.25 | 71.92 | 6.30 | 40.44 | 3.55 | 8.42 | 0.74 | 25.26 | 2.22 | ||||
| 一般 | 511.00 | 44.82 | 410.35 | 35.95 | 783.99 | 68.81 | 206.74 | 18.13 | 130.01 | 11.42 | ||||
| 良 | 549.74 | 48.22 | 642.92 | 56.32 | 314.63 | 27.61 | 875.12 | 76.74 | 977.48 | 85.88 | ||||
| 优 | 5.05 | 0.44 | 14.17 | 1.24 | 0.22 | 0.02 | 49.62 | 4.35 | 4.30 | 0.38 | ||||

Figure 3 Trends in spatial and temporal evolution of RSEI in the study area
| RSEI变化 趋势 | 2001-2021年变化趋势 | 2001-2021年显著变化趋势 | |||
|---|---|---|---|---|---|
| 面积/km2 | 占比/% | 面积/km2 | 占比/% | ||
| 退化 | 84.26 | 7.42 | 0.14 | 0.01 | |
| 不变 | 0.0009 | 0.0001 | 0.0009 | 0.0001 | |
| 改善 | 1050.60 | 92.58 | 62.25 | 5.49 | |
Table 5 Statistics of trends of RSEI in the study area from 2001 to 2021
| RSEI变化 趋势 | 2001-2021年变化趋势 | 2001-2021年显著变化趋势 | |||
|---|---|---|---|---|---|
| 面积/km2 | 占比/% | 面积/km2 | 占比/% | ||
| 退化 | 84.26 | 7.42 | 0.14 | 0.01 | |
| 不变 | 0.0009 | 0.0001 | 0.0009 | 0.0001 | |
| 改善 | 1050.60 | 92.58 | 62.25 | 5.49 | |
| 变量 | dem | tem | gdp | plant | pre | pop |
|---|---|---|---|---|---|---|
| q value | 0.492 | 0.128 | 0.102 | 0.079 | 0.0774 | 0.0362 |
| sig值 | 5.98×10⁻¹⁰ | 1.55×10⁻⁴ | 2.19×10⁻¹⁰ | 0.0203 | 0.705 | 1.17×10⁻⁵ |
Table 6 Results of driving factors q interaction
| 变量 | dem | tem | gdp | plant | pre | pop |
|---|---|---|---|---|---|---|
| q value | 0.492 | 0.128 | 0.102 | 0.079 | 0.0774 | 0.0362 |
| sig值 | 5.98×10⁻¹⁰ | 1.55×10⁻⁴ | 2.19×10⁻¹⁰ | 0.0203 | 0.705 | 1.17×10⁻⁵ |
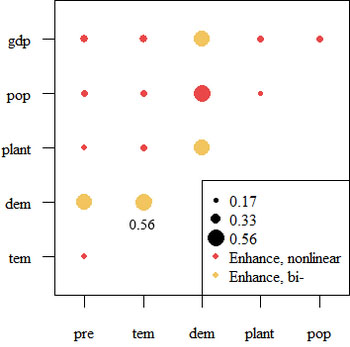
Figure 4 Interactive detection results of driving factors

Figure 5 Field verification map of ecological environment quality in Wuzhishan
| [1] | GOCIC M, TRAJKOVI S, 2013. Analysis of changes in meteorological variables using Mann-Kendall and Sen’s slope estimator statistical tests in Serbia[J]. Global and Planetary Change, 100: 172-182. |
| [2] | HIRSCH R M, SLACK J R, 1984. A nonparametric trend test for seasonal data with serial dependence[J]. Water Resources Research, 20(6): 727-732. |
| [3] | SONG Y Z, WANG J F, GE Y, et al., 2020. An optimal parameters-based geographical detector model enhances geographic characteristics of explanatory variables for spatial heterogeneity analysis: cases with different types of spatial data[J]. GIScience & Remote Sensing, 57(5): 593-610. |
| [4] | YUAN B D, FU L N, ZOU Y A, et al., 2021. Spatiotemporal change detection of ecological quality and the associated affecting factors in Dongting Lake Basin, Based on RSEI[J]. Journal of Cleaner Production, 302: 126995. |
| [5] | ZHU D Y, CHEN T, WANG Z W, et al., 2021. Detecting ecological spatial-temporal changes by remote sensing ecological index with local adaptability[J]. Journal of Environmental Management, 299: 113655. |
| [6] | 安树青, 朱学雷, 王峥峰, 等, 1999. 海南五指山热带山地雨林植物物种多样性研究[J]. 生态学报, 19(6): 803-809. |
| AN S Q, ZUH X L, WANG Z F, et al., 1999. The plant species diversity in a tropical montane rain forest on Wuzhi Mountain, Hainan[J]. Acta Ecologica Sinica, 19(6): 803-809. | |
| [7] | 陈宜欣, 宁晓刚, 张翰超, 等, 2024. 遥感生态指数 (RSEI) 模型及应用综述[J]. 自然资源遥感, 36(3): 28-40. |
| CHEN Y X, NING X G, ZHANG H C, et al., 2024. Overview of remote sensing ecological index (RSEI) model and its applications[J]. Remote Sensing for Natural Resources, 36(3): 28-40. | |
| [8] | 段四波, 茹晨, 李召良, 等, 2021. Landsat卫星热红外数据地表温度遥感反演研究进展[J]. 遥感学报, 25(8): 1591-1617. |
| DUAN S B, RU C, LI Z L, et al., 2021. Reviews of methods for land surface temperature retrieval from Landsat thermal infrared data[J]. National Remote Sensing Bulletin, 25(8): 1591-1617. | |
| [9] | 付杰, 王萍, 张清, 等, 2021. 基于改进遥感生态指数的海南岛生态环境质量动态变化[J]. 农业资源与环境学报, 38(6): 1102-1111. |
| FU J, WANG P, ZHANG Q, et al., 2021. Dynamic monitoring of ecological environment quality of Hainan Island based on improved remote sensing ecological index[J]. Journal of Agricultural Resources and Environment, 38(6): 1102-1111. | |
| [10] | 傅楷翔, 贾国栋, 余新晓, 等, 2024. 基于改进遥感生态指数的新疆吐鲁番-哈密地区生态环境质量评价及驱动机制分析[J]. 生态学报, 44(9): 3911-3923. |
| FU K X, JIA G D, XU X X, et al., 2024. Evaluation of ecological environment quality and analysis of driving mechanism in Tulufan-Hami region of Xinjiang based on improved remote sensing ecological indices[J]. Acta Ecologica Sinica, 44(9): 3911-3923. | |
| [11] | 谷树忠, 胡咏君, 周洪, 2013. 生态文明建设的科学内涵与基本路径[J]. 资源科学, 35(1): 2-13. |
| GU S Z, HU Y J, ZHOU H, 2013. Ecological civilization construction: Scientific connotation and basic paths[J]. Resources Science, 35(1): 2-13. | |
| [12] | 胡珂, 韩念龙, 于淼, 等, 2023. 基于遥感生态指数的三亚市土地利用变化模拟[J]. 中国水土保持科学, 21(1): 101-109. |
| HU K, HAN N L, YU M, et al., 2023. Land use change simulation in Sanyan city based on remote sensing ecological index[J]. Science of Soil and Water Conservation, 21(1): 101-109. | |
| [13] | 李光伟, 邢峰华, 敖杰, 等, 2022. 海南岛30年空中云水资源时空特征分析[J]. 热带生物学报, 13(4): 331-338. |
| LI G W, XING F H, AO J, et al., 2022. Temporal and spatial characteristics of cloud water resources in Hainan island over the past 30 years[J]. Journal of Tropical Biology, 13(4): 331-338. | |
| [14] | 李佳灵, 周铜磊, 黄翔, 等, 2019. 海南五指山国家级自然保护区鸟兽多样性研究[J]. 野生动物学报, 40(4): 924-932. |
| LI J L, ZHOU T L, HUANG X, et al., 2019. Bird and mammal diversity in Wuzhishan national nature reserve, Hainan[J]. Chinese Journal of Wildlife, 40(4): 924-932. | |
| [15] | 李妍, 张国钦, 吝涛, 等, 2022. 乡镇遥感生态指数时空变化及影响因子研究——以天津市蓟州区为例[J]. 生态学报, 42(2): 474-486. |
| LI Y, ZHANG G Q, LIN T, et al., 2022. The spatiotemporal changes of remote sensing ecological index in towns and the influencing factors: A case of Jinzhou District, Tianjin[J]. Acta Ecologica Sinica, 42(2): 474-486. | |
| [16] | 林中立, 徐涵秋, 2019. 基于遥感的海岛型城市发展生态效应分析——以厦门岛为例[J]. 福州大学学报(自然科学版), 47(5): 610-616. |
| LIN Z L, XU H Q, 2019. Ecological response analysis for urban development in an island city based on remote sensing: a case study in Xiamen Island, Southeastern China[J]. Journal of Fuzhou University (Natural Science Edition), 47(5): 610-616. | |
| [17] |
刘强, 杨众养, 陈毅青, 等, 2021. 基于CA-Markov多情景模拟的海南岛土地利用变化及其生态环境效应[J]. 生态环境学报, 30(7): 1522-1531.
DOI |
| LIU Q, YANG Z Y, CHEN Y Q, et al., 2021. Multi-scenario simulation of land use change and its eco-environmental effect in Hainan Island based on ca-markov model[J]. Ecology and Environmental Sciences, 30(7): 1522-1531. | |
| [18] | 宋静, 王会肖, 王飞, 2013. 生态环境质量评价研究进展及方法评述[J]. 环境科学与技术, 36(S2): 448-453. |
| SONG J, WANG H X, WANG F, 2013. Research progress of ecological environment quality assessment and methods review[J]. Environmental Science & Technology, 36(S2): 448-453. | |
| [19] | 孙玉军, 王效科, 王如松, 1999. 五指山保护区生态环境质量评价研究[J]. 生态学报, 19(3): 365-370. |
| SUN Y J, WANG X K, WANG R S, 1999. The characteristics of eco-environmental quality in five-finger mountain nature reserve[J]. Acta Ecologica Sinica, 19(3): 365-370. | |
| [20] |
王剑, 管瑶, 贺兴宏, 等, 2024. 2000-2021年图木舒克市生态环境质量动态监测与评价[J]. 干旱区地理, 47(3): 465-473.
DOI |
|
WANG J, GUAN Y, HE X H, et al., 2024. Dynamic monitoring and evaluation of ecological environment quality in Tumshuk City from 2000 to 2021[J]. Arid Land Geography, 47(3): 465-473.
DOI |
|
| [21] |
王劲峰, 徐成东, 2017. 地理探测器: 原理与展望[J]. 地理学报, 72(1): 116-134.
DOI |
|
WANG J F, XU C D, 2017. Geodetector: Principle and prospective[J]. Acta Geographica Sinica, 72(1): 116-134.
DOI |
|
| [22] | 王永祥, 徐园园, 杨佳嘉, 等, 2023. 基于Landsat的重庆市生态环境质量动态监测及其时空格局演变分析[J]. 生态学报, 43(15): 6278-6292. |
| WANG Y X, XU Y Y, YANG J J, et al., 2023. Dynamic monitoring and spatio-temporal pattern evolution analysis of ecoenvironmental quality in Chongqing based on remote sensing[J]. Acta Ecologica Sinica, 43(15): 6278-6292. | |
| [23] | 魏伟, 曾诗瑶, 尹力, 等, 2024. 近40年海南岛国土空间格局演化的生态效应及其影响因素[J]. 生态学报, 44(12): 5083-5101. |
| WEI W, ZENG S Y, YIN L, et al., 2024. Ecological Effects and Influencing Factors of the Evolution of Hainan Island’s territorial spatial pattern over the past 40 years[J]. Acta Ecologica Sinica, 44(12): 5083-5101. | |
| [24] | 袁璨, 2015. 海南省五指山市生态环境脆弱性研究[D]. 长沙: 中南林业科技大学:46. |
| YUAN C, 2015. The ecological environment vulnerability research in Wuzhishan city of Hainan province[D]. Changsha: Central South University of Forestry and Technology:46. | |
| [25] |
徐涵秋, 邓文慧, 2022. MRSEI指数的合理性分析及其与RSEI指数的区别[J]. 遥感技术与应用, 37(1): 1-7.
DOI |
| XU H Q, DENG W H, 2022. Analysis of MRSEI and its difference with RSEI[J]. Remote Sensing Technology and Application, 37(1): 1-7. | |
| [26] | 徐涵秋, 2005. 利用改进的归一化差异水体指数 (MNDWI) 提取水体信息的研究[J]. 遥感学报, 9(5): 589-595. |
| XU H Q, 2005. A study on information extraction of water body with the modified normalized difference water index (MNDWI)[J]. Journal of Remote Sensing, 9(5): 589-595. | |
| [27] | 徐涵秋, 2013. 区域生态环境变化的遥感评价指数[J]. 中国环境科学, 33(5): 889-897. |
| XU H Q, 2013. A remote sensing index for assessment of regional ecological changes[J]. China Environmental Science, 33(5): 889-897. | |
| [28] | 姚尧, 王世新, 周艺, 等, 2012. 生态环境状况指数模型在全国生态环境质量评价中的应用[J]. 遥感信息, 27(3): 93-98. |
| YAO Y, WANG S X, ZHOU Y, et al., 2012. The application of ecological environment index model on the national evaluation of ecological environment quality[J]. Remote Sensing Information, 27(3): 93-98. | |
| [29] | 叶亚平, 刘鲁君, 2000. 中国省域生态环境质量评价指标体系研究[J]. 环境科学研究, 13(3): 33-36. |
| YE Y P, LIU L J, 2000. A preliminary study on assessment indicator system of provincial eco-environmental quality in China[J]. Research of Environmental Sciences, 13(3): 33-36. | |
| [30] | 左璐, 孙雷刚, 徐全洪, 等, 2021. 区域生态环境评价研究综述[J]. 云南大学学报(自然科学版), 43(4): 806-817. |
| ZUO L, SUN L G, XU Q H, et al., 2021. A review of the studies on regional ecological environment evaluation[J]. Journal of Yunnan University (Natural Sciences Edition), 43(4): 806-817. | |
| [31] | 张利利, 佘济云, 李锐, 等, 2016. 1998-2010年五指山市土地利用景观格局变化分析[J]. 西北林学院学报, 31(1): 221-225, 249. |
| ZHANG L L, SHE J Y, LI R, et al., 2016. Changes of land use and landscape pattern in Wuzhishan during 1998-2010[J]. Journal of Northwest Forestry University, 31(1): 221-225, 249. |
| [1] | WU Chenyu, XU Fanfan, WEI Shibo, FAN Jingjing, LIU Guanpeng, WANG Kun. Study on Response of Surface Vegetation Cover to Climate Change in Weihe River Basin [J]. Ecology and Environment, 2023, 32(5): 835-844. |
| Viewed | ||||||||||||||||||||||||||||||||||||||||||||||||||
|
Full text 82
|
|
|||||||||||||||||||||||||||||||||||||||||||||||||
|
Abstract 146
|
|
|||||||||||||||||||||||||||||||||||||||||||||||||
Copyright © 2021 Editorial Office of ACTA PETROLEI SINICA
Address:No. 6 Liupukang Street, Xicheng District, Beijing, P.R.China, 510650
Tel: 86-010-62067128, 86-010-62067137, 86-010-62067139
Fax: 86-10-62067130
Email: syxb@cnpc.com.cn
Support byBeijing Magtech Co.ltd, E-mail:support@magtech.com.cn