Ecology and Environment ›› 2023, Vol. 32 ›› Issue (5): 920-932.DOI: 10.16258/j.cnki.1674-5906.2023.05.010
• Research Articles • Previous Articles Next Articles
GE Yuankai1,2( ), ZHAO Longlong1,*(), CHEN Jinsong1, REN Yanni1, LI Hongzhong1
Received:2022-12-28
Online:2023-05-18
Published:2023-08-09
Contact:
ZHAO Longlong
葛元凯1,2(), 赵龙龙1,*(), 陈劲松1, 任彦霓1, 李洪忠1
通讯作者:
赵龙龙
作者简介:葛元凯(1999年生),男,硕士研究生,研究方向为摄影测量与遥感。E-mail: 212004020008@home.hpu.edu.cn
基金资助:CLC Number:
GE Yuankai, ZHAO Longlong, CHEN Jinsong, REN Yanni, LI Hongzhong. Spatio-temporal Evolution Trend of Meteorological Drought and Identification of Drought Events in Southwest China from 1983 to 2020[J]. Ecology and Environment, 2023, 32(5): 920-932.
葛元凯, 赵龙龙, 陈劲松, 任彦霓, 李洪忠. 1983-2020年西南地区气象干旱时空演变趋势及干旱事件识别[J]. 生态环境学报, 2023, 32(5): 920-932.
Add to citation manager EndNote|Ris|BibTeX
URL: https://www.jeesci.com/EN/10.16258/j.cnki.1674-5906.2023.05.010
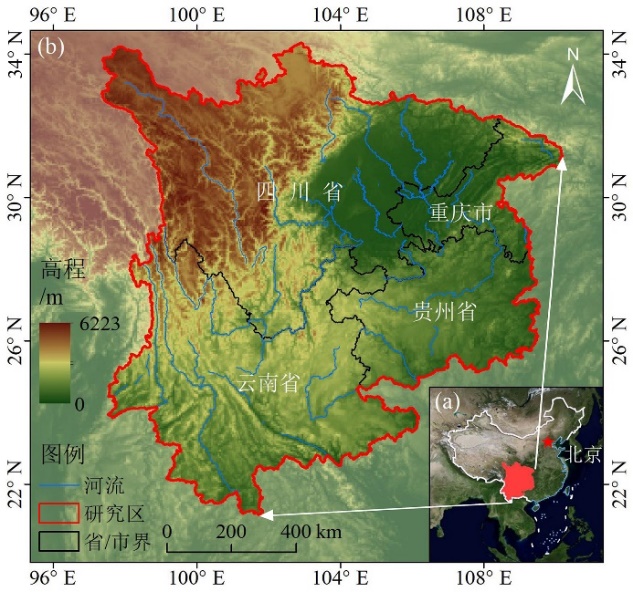
Figure 1 Geographic location of the study area
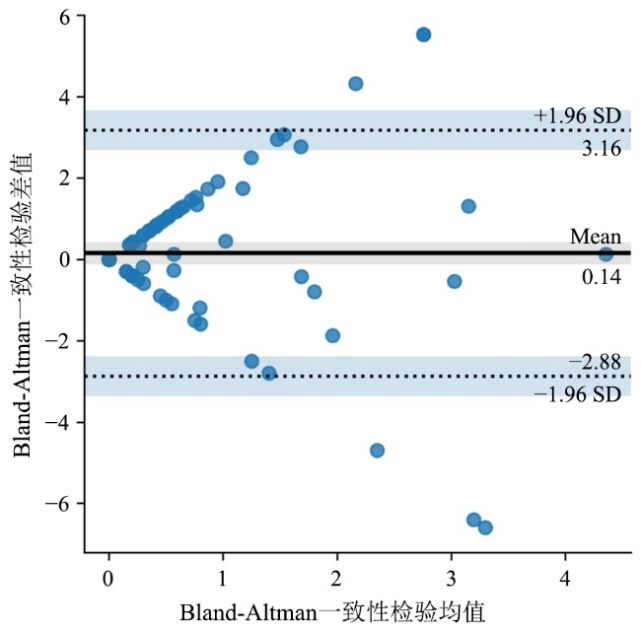
Figure 2 Consistency test of precipitation data
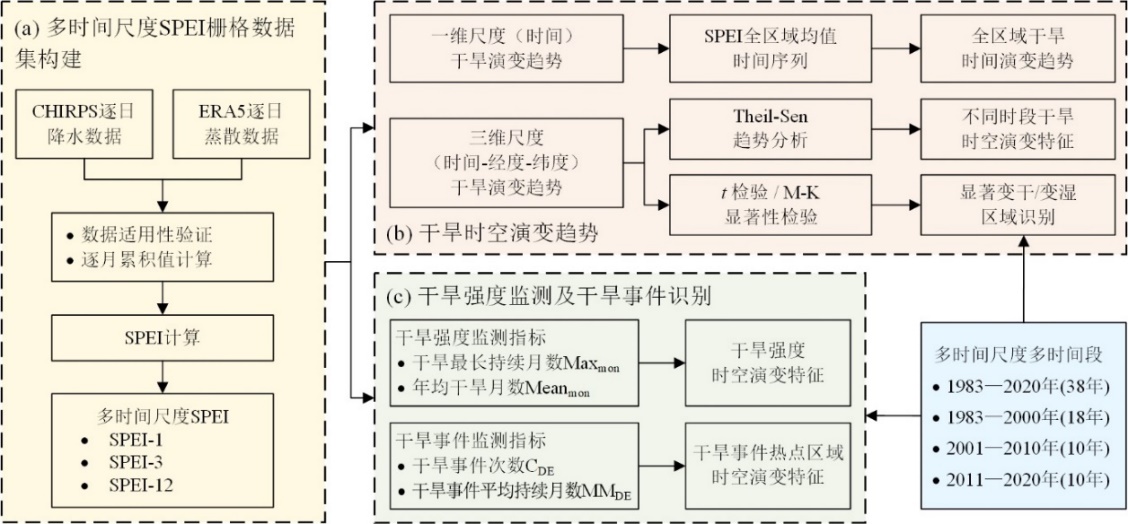
Figure 3 Technology roadmap
| 干湿等级 | SPEI值 |
|---|---|
| 极度干旱 | <-2.00 |
| 严重干旱 | -2.00--1.50 |
| 中等干旱 | -1.50--1.00 |
| 轻度干旱 | -1.00--0.50 |
| 正常或湿润 | >-0.50 |
Table 1 Dry and wet grade division of SPEI
| 干湿等级 | SPEI值 |
|---|---|
| 极度干旱 | <-2.00 |
| 严重干旱 | -2.00--1.50 |
| 中等干旱 | -1.50--1.00 |
| 轻度干旱 | -1.00--0.50 |
| 正常或湿润 | >-0.50 |
| P | 显著性 |
|---|---|
| <0.01 | 极显著 |
| <0.05 | 显著 |
| ≥0.05 | 不显著 |
Table 2 T-test significance test criteria
| P | 显著性 |
|---|---|
| <0.01 | 极显著 |
| <0.05 | 显著 |
| ≥0.05 | 不显著 |
| |Z| | α | 显著性 |
|---|---|---|
| ≥2.58 | ≤0.01 | 极显著 |
| ≥1.96 | ≤0.05 | 显著 |
| <1.96 | >0.05 | 不显著 |
Table 3 Mann-Kendall significance test criteria
| |Z| | α | 显著性 |
|---|---|---|
| ≥2.58 | ≤0.01 | 极显著 |
| ≥1.96 | ≤0.05 | 显著 |
| <1.96 | >0.05 | 不显著 |
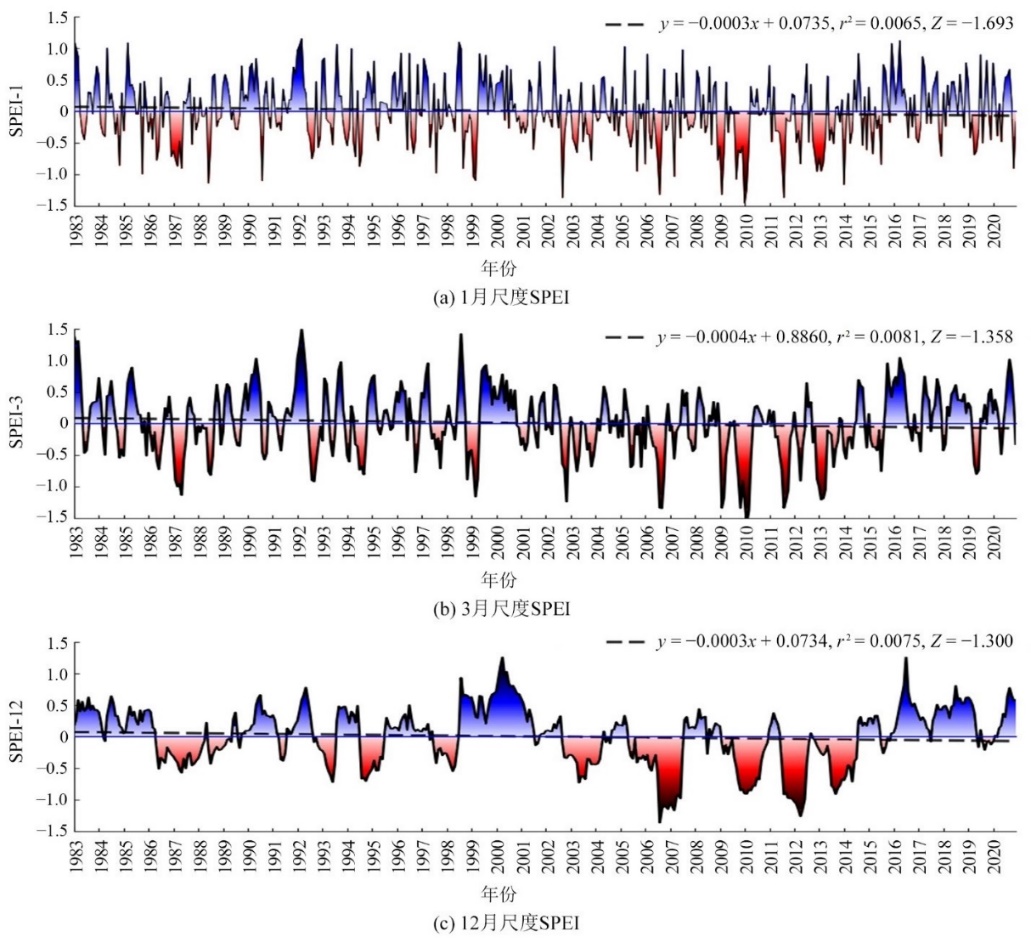
Figure 4 Multi-scale SPEI time series
| SPEI | P | 显著性 |
|---|---|---|
| SPEI-1 | 0.842 | 不显著 |
| SPEI-3 | 0.694 | 不显著 |
| SPEI-12 | 0.814 | 不显著 |
Table 4 The T-test results
| SPEI | P | 显著性 |
|---|---|---|
| SPEI-1 | 0.842 | 不显著 |
| SPEI-3 | 0.694 | 不显著 |
| SPEI-12 | 0.814 | 不显著 |
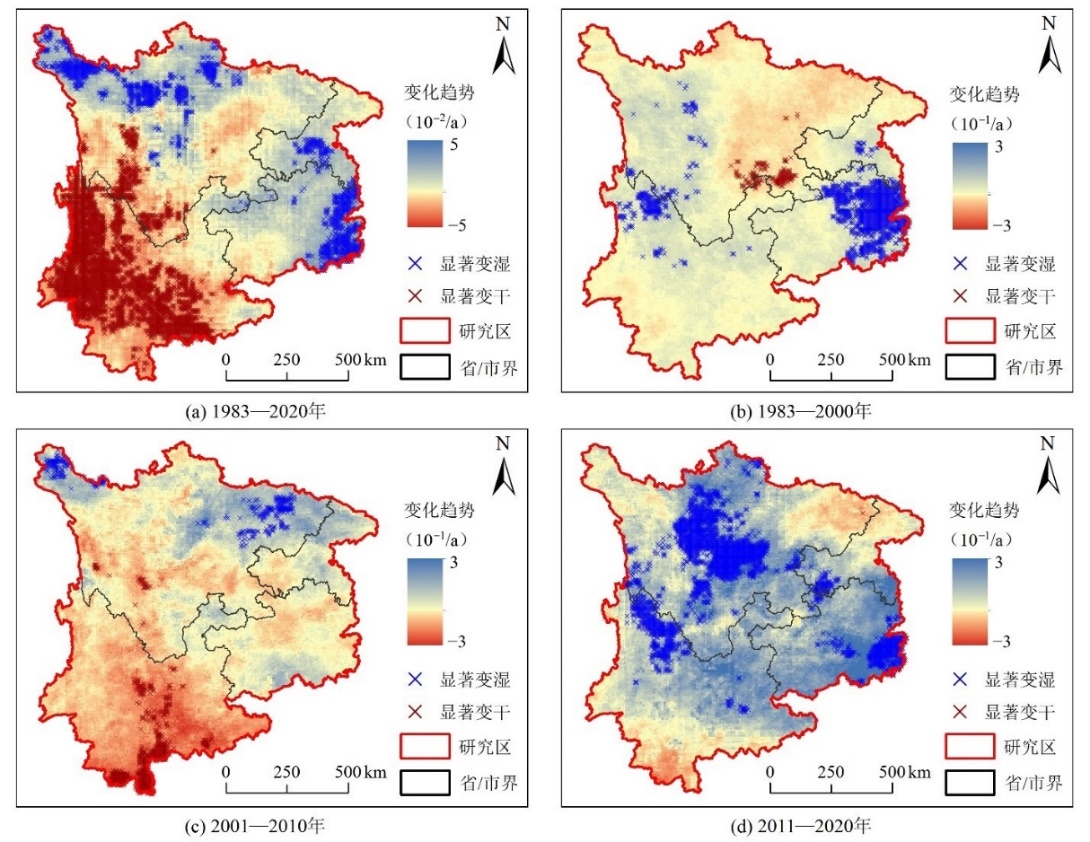
Figure 5 Spatio-temporal evolution characteristics of SPEI-12 in different time periods
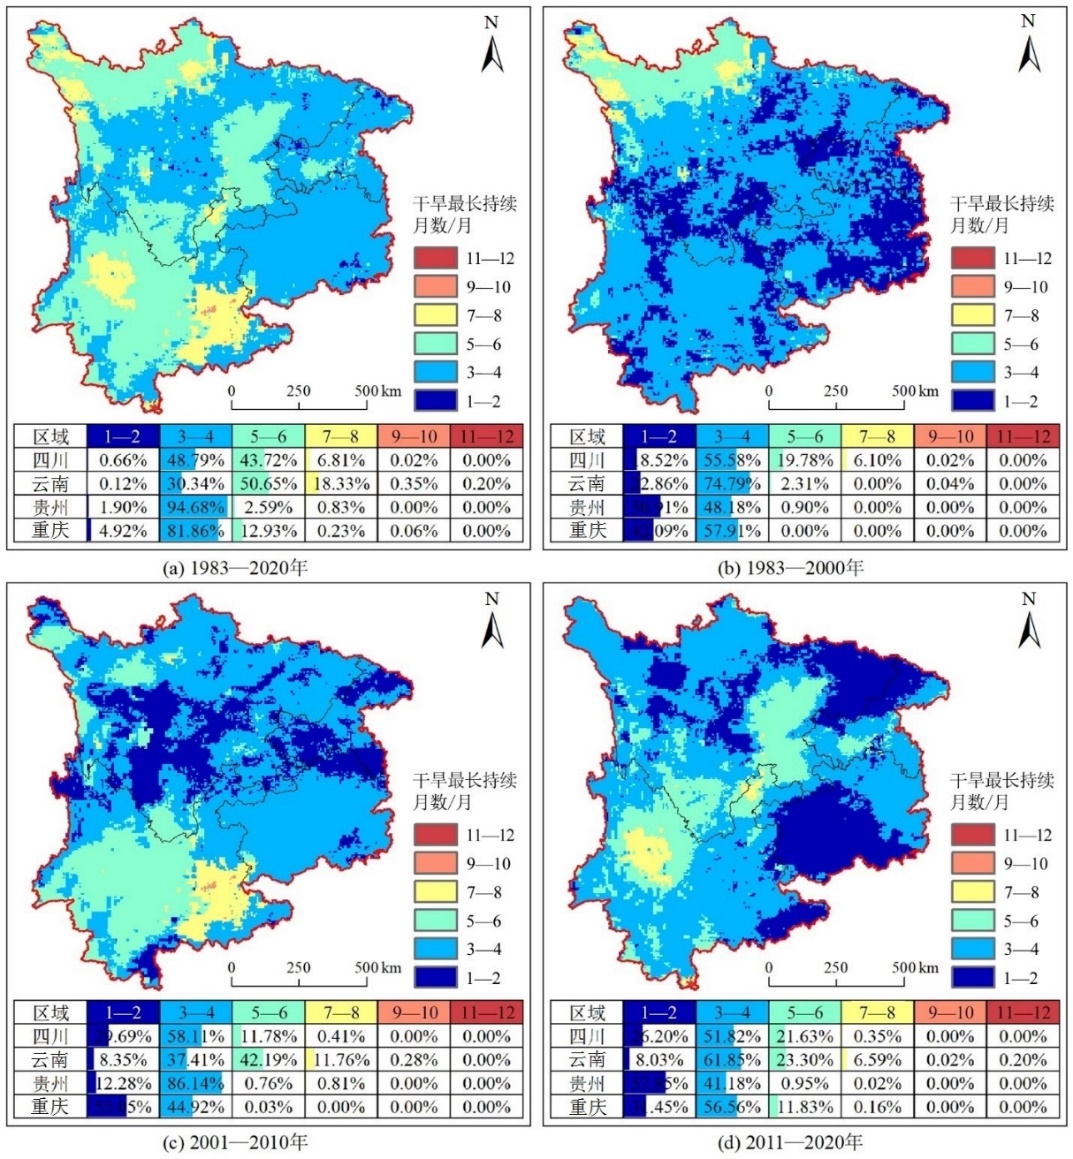
Figure 6 Spatial distribution maps of the Maxmon indicator in different time periods and the area proportion in each region
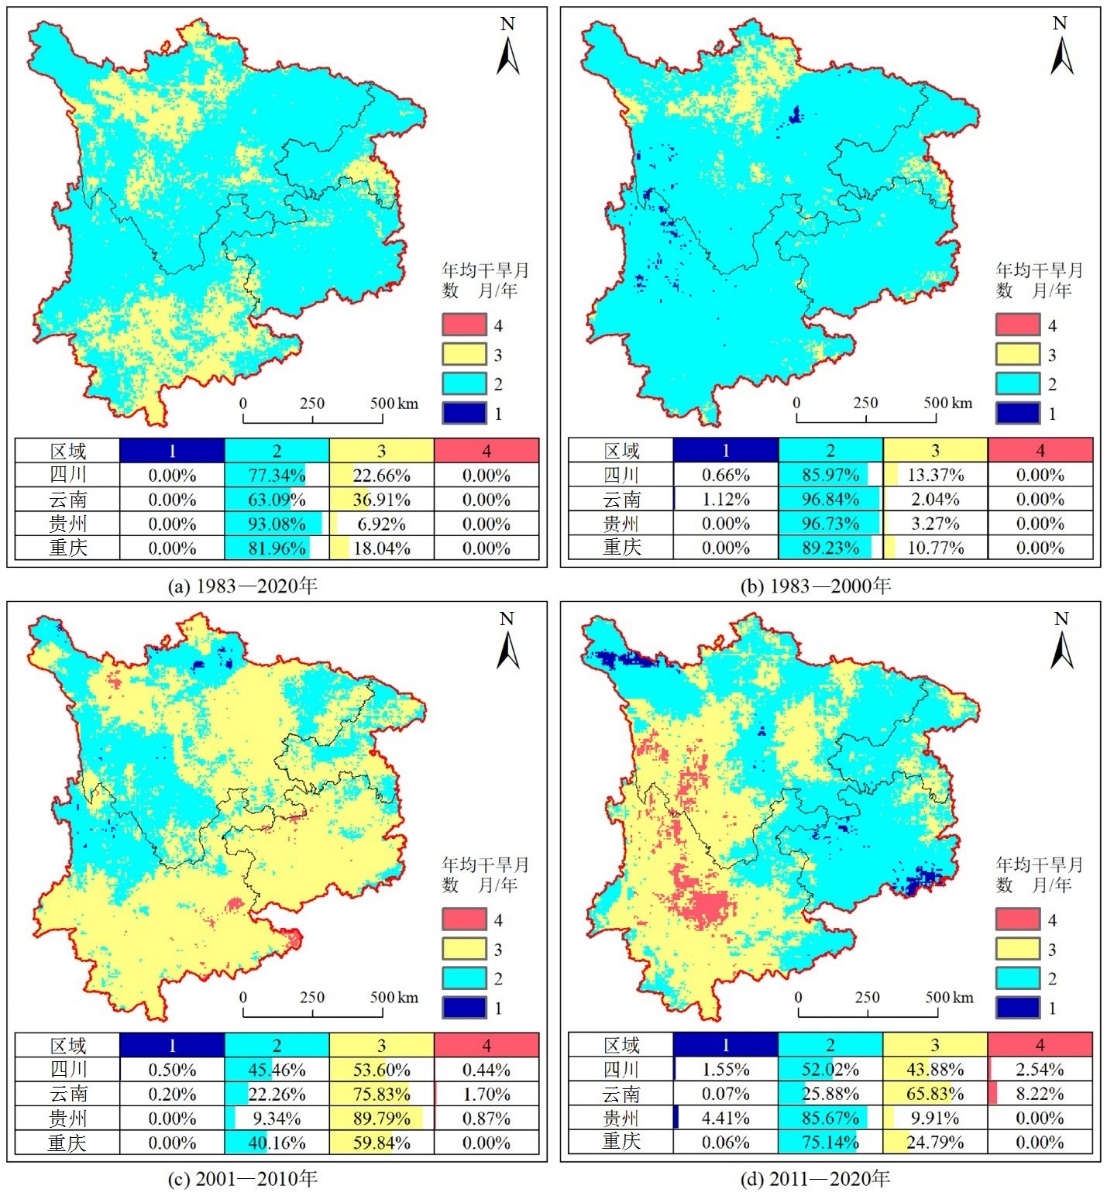
Figure 7 Spatial distribution maps of the Meanmon indicator in different periods and the area proportion in each region

Figure 8 Spatial distribution maps of the CDE indicator in different time periods and the area proportion in each region

Figure 9 Spatial distribution maps of the MMDE indicator in different periods and the area proportion in each region
| 区域 | 不同时段下MMDE均值(月/次) | |||
|---|---|---|---|---|
| 1983-2020 | 1983-2000 | 2001-2010 | 2011-2020 | |
| 重庆市 | 3.46 | 3.07 | 3.13 | 3.86 |
| 云南省 | 3.80 | 3.26 | 4.70 | 3.41 |
| 四川省 | 3.66 | 3.69 | 3.56 | 3.83 |
| 贵州省 | 3.23 | 3.15 | 3.16 | 3.47 |
| 研究区 | 3.63 | 3.45 | 3.93 | 3.67 |
Table 5 Regional mean MMDE in different periods of the study area
| 区域 | 不同时段下MMDE均值(月/次) | |||
|---|---|---|---|---|
| 1983-2020 | 1983-2000 | 2001-2010 | 2011-2020 | |
| 重庆市 | 3.46 | 3.07 | 3.13 | 3.86 |
| 云南省 | 3.80 | 3.26 | 4.70 | 3.41 |
| 四川省 | 3.66 | 3.69 | 3.56 | 3.83 |
| 贵州省 | 3.23 | 3.15 | 3.16 | 3.47 |
| 研究区 | 3.63 | 3.45 | 3.93 | 3.67 |
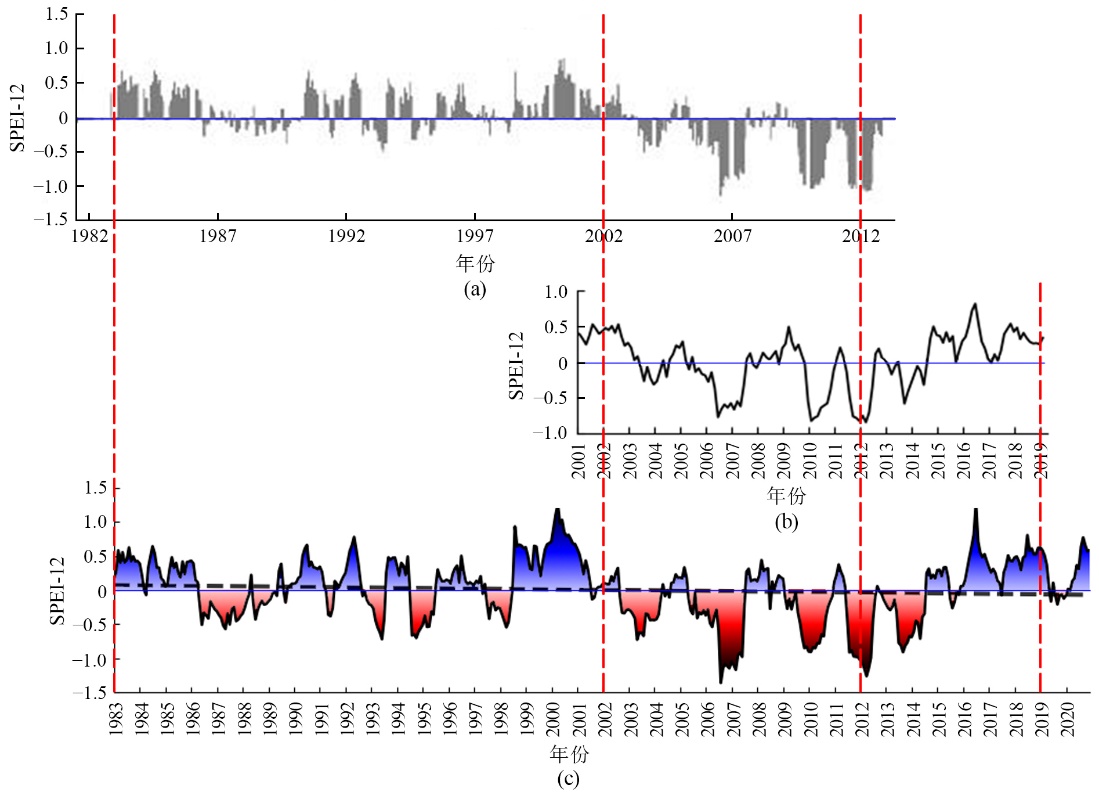
图a Reliability verification of SPEI results
| [1] | ALTMAN D G, BLAND J M, 1983. Measurement in medicine: the analysis of method comparison studies[J]. Journal of the Royal Statistical Society: Series D (The Statistician), 32(3): 307-317. |
| [2] |
BAI L, SHI C X, LI L H, et al., 2018. Accuracy of CHIRPS satellite-rainfall products over mainland China[J]. Remote Sensing, 10(3): 362.
DOI URL |
| [3] |
BLAND J M, ALTMAN D G, 1995. Comparing methods of measurement: Why plotting difference against standard method is misleading[J]. The lancet, 346(8982): 1085-1087.
DOI URL |
| [4] |
HAN L Y, ZHANG Q, MA P L, et al., 2016. The spatial distribution characteristics of a comprehensive drought risk index in southwestern China and underlying causes[J]. Theoretical and Applied Climatology, 124(3-4): 517-528.
DOI URL |
| [5] | HAN L Y, ZHANG Q, ZHANG Z C, et al., 2021. Drought area, intensity and frequency changes in China under climate warming, 1961-2014[J]. Journal of Arid Environments, 193: 104596. |
| [6] |
JIN X Y, QIANG H F, ZHAO L, et al., 2020. SPEI-based analysis of spatio-temporal variation characteristics for annual and seasonal drought in the Zoige Wetland, Southwest China from 1961 to 2016[J]. Theoretical and Applied Climatology, 139(1-2): 711-725.
DOI |
| [7] |
KIM T K, 2015. T test as a parametric statistic[J]. Korean journal of anesthesiology, 68(6): 540-546.
DOI PMID |
| [8] | MCLEOD A I, 2005. Kendall rank correlation and Mann-Kendall trend test[J]. R Package Kendall, 602: 1-10. |
| [9] |
OHLSON J A, KIM S, 2015. Linear valuation without OLS: the Theil-Sen estimation approach[J]. Review of Accounting Studies, 20(1): 395-435.
DOI URL |
| [10] | SUN G H, HU Z Y, MA Y M, et al., 2020. Analysis of local land-atmosphere coupling in rainy season over a typical underlying surface in Tibetan Plateau based on field measurements and ERA5[J]. Atmospheric research, 243: 105025. |
| [11] |
VICENTE-SERRANO S M, BEGUERÍA S, LÓPEZ-MORENO J I, 2010. A Multiscalar Drought Index Sensitive to Global Warming: The Standardized Precipitation Evapotranspiration Index[J]. Journal of Climate, 23: 1696-1718.
DOI URL |
| [12] |
WANG W, ZHU Y, XU R G, et al., 2015. Drought severity change in China during 1961-2012 indicated by SPI and SPEI[J]. Natural Hazards, 75: 2437-2451.
DOI URL |
| [13] |
ZHOU L H, YANG G J, 2006. Ecological economic problems and development patterns of the Arid Inland River Basin in Northwest China[J]. Ambio, 35(6): 316-318.
PMID |
| [14] | 白子怡, 薛亮, 张翀, 2019. 基于土壤湿度与植被覆盖变化的黄土高原生态恢复项目适宜性评价[J]. 水土保持研究, 26(4): 292-298, 379. |
| BAI Z Y, XUE L, ZHANG C, 2019. Evaluation on Suitability of Ecological Restoration Project in the Loess Plateau Based on Soil Moisture and Vegetation Cover Change[J]. Research of Soil and Water Conservation, 26(4): 292-298, 379. | |
| [15] | 蔡思扬, 左德鹏, 徐宗学, 等, 2017. 基于SPEI干旱指数的东北地区干旱时空分布特征[J]. 南水北调与水利科技, 15(5): 15-21. |
| CAI S Y, ZUO D P, XU Z X, et al., 2017. Spatial and temporal characteristics of drought in Northeast China based on SPEI[J]. South-to-North Water Transfers and Water Science & Technology, 15(5): 15-21. | |
| [16] |
韩兰英, 张强, 姚玉璧, 等, 2014. 近60年中国西南地区干旱灾害规律与成因[J]. 地理学报, 69(5): 632-639.
DOI |
| HAN L Y, ZHANG Q, YAO Y B, et al., 2014. Laws and causes of drought disasters in Southwest China in recent 60 years[J]. Acta Geographica Sinica, 69(5): 632-639. | |
| [17] | 胡光成, 周杰, 卢静, 等, 2020. 中国西南地区历年月度干旱指数(1951-2016)和8天频率土壤湿度(2007-2016)数据集[J]. 全球变化数据学报(中英文), 4(3): 248-256, 248-256. |
| HU G C, ZHOU J, LU J, et al., 2020. Data set of monthly drought Index (1951-2016) and 8-day Frequency soil moisture (2007-2016) in Southwest China[J]. Journal of Global Change Data & Discovery, 4(3): 248-256, 248-256. | |
| [18] | 黄健, 李谢辉, 王磊, 等, 2020. 基于SPEI指数的西南地区近42 a干旱时空变化分析[J]. 成都信息工程大学学报, 35(3): 359-366. |
| HUANG J, LI X H, WANG L, et al., 2020. Analysis of Spatio-temporal variation of drought in Southwest China in recent 42 years based on SPEI Index[J]. Journal of Chengdu University of Information Technology, 35(3): 359-366. | |
| [19] | 黄建平, 张国龙, 于海鹏, 等, 2020. 黄河流域近40年气候变化的时空特征[J]. 水利学报, 51(9): 1048-1058. |
| HUANG J P, ZHANG G L, YU H P, et al., 2020. Characteristics of climate change in the Yellow River basin during recent 40 years[J]. Journal of Hydraulic Engineering, 51(9): 1048-1058. | |
| [20] |
贾艳青, 张勃, 2018. 基于日SPEI的近55 a西南地区极端干旱事件时空演变特征[J]. 地理科学, 38(3): 474-483.
DOI |
|
JIA Y Q, ZHANG B, 2018. Spatial-temporal variability characteristics of extreme drought events based on daily SPEI in the southwest China in recent 55 years[J]. Scientia Geographica Sinica, 38(3): 474-483.
DOI |
|
| [21] | 姜雨彤, 郝增超, 冯思芳, 等, 2022. 长江与黄河流域复合高温干旱事件时空演变特征[J/OL]. 水资源保护, https://kns.cnki.net/kcms/detail/32.1356.TV.20220718.1138.004.html. |
| JIANG Y T, HAO Z C, FENG S F, et al., 2022. Spatiotemporal changes in compound hot-dry events in the Yangtze River and Yellow River Basin[J/OL]. Water Resources Protection, https://kns.cnki.net/kcms/detail/32.1356.TV.20220718.1138.004.html. | |
| [22] | 靖娟利, 和彩霞, 王永锋, 等, 2022. 西南地区1902-2018年干旱时空演变特征分析[J]. 水土保持研究, 29(3): 220-227. |
| JING J L, HE C X, WANG Y F, et al., 2022. Spatiotemporal evolution characteristics of meteorological drought in southwest China from 1902 to 2018[J]. Research of Soil and Water Conservation, 29(3): 220-227. | |
| [23] | 李韵婕, 任福民, 李忆平, 等, 2014. 1960-2010年中国西南地区区域性气象干旱事件的特征分析[J]. 气象学报, 72(2): 266-276. |
| LI Y J, REN F M, LI Y P, et al., 2014. A study of the characteristics of the southwestern China regional meteorological drought events during 1960-2010[J]. Acta Meteorologica Sinica, 72(2): 266-276. | |
| [24] | 李星, 2018. 基于多源遥感数据的干旱监测方法及生态系统响应研究[D]. 成都: 电子科技大学. |
| LI X, 2018. Research on drought monitoring and terrestrial ecosystem response based on multi-source remote sensing data[D]. Chengdu: University of Electronic Science and Technology of China. | |
| [25] | 吕爱民, 董延军, 贾春强, 2013. 2009-2011年云南干旱时空演变特征分析[J]. 广东水利水电 (6): 38-41. |
| LÜ A M, DONG Y J, JIA C Q, 2013. Analysis on Spatio-temporal Evolution characteristics of drought in Yunnan from 2009 to 2011[J]. Guangdong Water Resources and Hydropower (6): 38-41. | |
| [26] | 吕纯月, 管兆勇, 黄垭飞, 2021. 1961-2018年西南地区夏季干旱变化特征及其与环流异常的联系[J]. 大气科学学报, 44(4): 573-584. |
| LÜ C Y, GUAN Z Y, HUANG Y F, 2021. Variation characteristics of summer drought in Southwest China and its relationship with circulation anomalies from 1961 and 2018[J]. Transactions of Atmospheric Sciences, 44(4): 573-584. | |
| [27] | 石朋, 唐汉, 瞿思敏, 等, 2022. 西南地区气象干旱向水文干旱传播特征[J/OL]. 水资源保护, https://kns.cnki.net/kcms/detail/32.1356.TV.20220329.1815.004.html. |
| SHI P, TANG H, QU S M, et al., 2022. Propagation from meteorological drought to hydrological drought in Southwest China[J/OL]. Water Resources Protection, https://kns.cnki.net/kcms/detail/32.1356.TV.20220329.1815.004.html. | |
| [28] | 史晓亮, 吴梦月, 丁皓, 2020. SPEI和植被遥感信息监测西南地区干旱差异分析[J]. 农业机械学报, 51(12): 184-192. |
| SHI X L, WU M Y, DING H, 2020. Difference analysis of SPEI and vegetation remote sensing information in drought monitoring in southwest China[J]. Transactions of the Chinese Society for Agricultural Machinery, 51(12): 184-192. | |
| [29] | 苏布达, 孙赫敏, 李修仓, 等, 2020. 气候变化背景下中国陆地水循环时空演变[J]. 大气科学学报, 43(6): 1096-1105. |
| SU B D, SUN H M, LI X C, et al., 2020. Impact of climate change on terrestrial water cycle in China[J]. Transactions of Atmospheric Sciences, 43(6): 1096-1105. | |
| [30] | 王东, 张勃, 张调风, 等, 2013. 1960-2011年西南地区干旱时空格局分析[J]. 水土保持通报, 33(6): 152-156, 2, 333. |
| WANG D, ZHANG B, ZHANG T F, et al., 2013. Temporal and Spatial Distributions of Droughts in Southwestern China in 1960-2011[J]. Bulletin of Soil and Water Conservation, 33(6): 152-156, 2, 333. | |
| [31] |
王东, 张勃, 安美玲, 等, 2014. 基于SPEI的西南地区近53 a干旱时空特征分析[J]. 自然资源学报, 29(6): 1003-1016.
DOI |
|
WANG D, ZHANG B, AN M L, et al., 2014. Analysis of Spatio-temporal characteristics of drought in Southwest China in recent 53 years based on SPEI[J]. Journal of Natural Resources, 29(6): 1003-1016.
DOI |
|
| [32] | 万红莲, 王静, 2018. 多尺度下宝鸡地区干旱动态格局演变及其与植被覆盖的关系[J]. 生态学报, 38(19): 6941-6952. |
| WANG H L, WANG J, 2008. Study of dynamic pattern evolution of drought and its correlation with vegetation cover in Baoji area on multi-scale[J]. Acta Ecologica Sinica, 38(19): 6941-6952. | |
| [33] | 王永锋, 和彩霞, 靖娟利, 2022. 基于SPEI的西南喀斯特核心分布区干旱时空格局分析[J]. 桂林理工大学学报, 42(1): 131-140. |
| WANG Y F, HE C X, JING J L, 2022. Analysis of Spatio-temporal pattern of drought in Karst Core Distribution area of Southwest China based on SPEI[J]. Journal of Guilin University of Technology, 42(1): 131-140. | |
| [34] | 文佐, 2022. 2019年3-6月云南省高温干旱复合事件过程及机理研究[D]. 南京: 南京信息工程大学. |
| WEN Z, 2022. Study on the process and Mechanism of compound events of High temperature and drought in Yunnan Province from March to June 2019[D]. Nanjing: Nanjing University of Information Science and Technology. | |
| [35] | 吴秋洁, 2019. 近55年西南地区干旱气候特征及成因分析[D]. 成都: 成都信息工程大学. |
| WU Q J, 2019. Analysis on the characteristics and causes of drought Climate in Southwest China in recent 55 years[D]. Chengdu: Chengdu University of Information Technology. | |
| [36] | 谢清霞, 谷晓平, 万雪丽, 等, 2020. 西南地区干旱的变化特征及其与大气环流的关系[J]. 干旱区地理, 43(1): 79-86. |
| XIE Q X, GU X P, WANG X L, et al., 2020. Variation characteristics of drought in Southwest China and its relationship with Atmospheric Circulation[J]. Arid Land Geography, 43(1): 79-86. | |
| [37] | 许凯, 2015. 我国干旱变化规律及典型引黄灌区干旱预报方法研究[D]. 北京: 清华大学. |
| XU K, 2015. Drought spatio-temporal variation in China and drought forecast in a typical irrigation area of the Yellow River[D]. Beijing: Tsinghua University. | |
| [38] | 徐翔宇, 刘昀竺, 汪党献, 等, 2022. 干旱灾害风险管理的战略思考[J]. 灾害学, 37(2): 1-5. |
| XU X Y, LIU Y L, WANNG D X, et al., 2022. Strategic thinking on risk Management of drought disaster[J]. Journal of Catastrophology, 37(2): 1-5. | |
| [39] | 姚玉璧, 张强, 王劲松, 等, 2014. 中国西南干旱对气候变暖的响应特征[J]. 生态环境学报, 23(9): 1409-1417. |
| YAO Y B, ZHANG Q, WANG J S, et al., 2014. The Response of Drought to Climate Warming in Southwest in China[J]. Ecology and Environmental Sciences, 23(9): 1409-1417. | |
| [40] | 张远东, 张笑鹤, 刘世荣, 2011. 西南地区不同植被类型归一化植被指数与气候因子的相关分析[J]. 应用生态学报, 22(2): 323-330. |
| ZHANG Y D, ZHANG X H, LIU S R, 2011. Correlation analysis on normalized difference vegetation index (NDVI) of different vegetations and climatic factors in Southwest China[J]. Chinese Journal of Applied Ecology, 22(2): 323-330. | |
| [41] |
张琪, 李跃清, 2014. 近48年西南地区降水量和雨日的气候变化特征[J]. 高原气象, 33(2): 372-383.
DOI |
|
ZHANG Q, LI Y Q, 2014. Climate change characteristics of precipitation and rainy days in Southwest China in recent 48 years[J]. Plateau Meteorology, 33(2): 372-383.
DOI |
|
| [42] | 张玉静, 王春乙, 张继权, 2015. 基于SPEI指数的华北冬麦区干旱时空分布特征分析[J]. 生态学报, 35(21): 7097-7107. |
| ZHANG Y J, WANG C Y, ZHANG J Q, 2015. Analysis of the spatial and temporal characteristics of drought in the North China plain based on standardized precipitation evapotranspiration index[J]. Acta Ecologica Sinica, 35(21): 7097-7107. | |
| [43] | 张旭煜, 2022. 基于SPI和SPEI中国秋季干旱检测与归因[D]. 南京: 南京信息工程大学. |
| ZHANG X Y, 2022. Detection and Attribution of Autumn drought in China based on SPI and SPEI[D]. Nanjing: Nanjing University of Information Science and Technology. | |
| [44] | 赵兰兰, 闻童, 赵兵, 等, 2021. 西南地区近50年干旱趋势及特征分析[J]. 水文, 41(6): 91-95, 59. |
| ZHAO L L, WEN T, ZHAO B, et al., 2021. Analysis of drought trend and characteristics in Southwest China in recent 50 years[J]. Journal of China Hydrology, 41(6): 91-95, 59. |
| [1] | DONG Jiefang, DENG Chun, ZHANG Zhongwu. Spatio-temporal Evolution and Population Exposure Risk to PM2.5 in the Weihe River Basin [J]. Ecology and Environment, 2023, 32(6): 1078-1088. |
| [2] | ZHENG Qingzhou, HE Jun, LI Shenzhi, DENG Chengzhi, WU Zhipeng, HUANG Xiaolin, WU Xia. Analysis on the Differences and Influencing Factors of Human Comfort between Urban and Rural Areas in Chongqing [J]. Ecology and Environment, 2023, 32(6): 1089-1097. |
| [3] | WANG Jiayi, SUN Tingting, SHA Runyu, CHEN Tinghong, XING Ran, QIN Boqiang, SHI Wenqing. Study on the Synergic Effect of Algae Salvage on Pollution Control and Carbon Emission Reduction in Eutrophic Lakes [J]. Ecology and Environment, 2023, 32(6): 1108-1114. |
| [4] | XU Xiaoyun, RAO Zhihan, JIANG Hongbin, ZHANG Wei, CHEN Chao, YANG Yongan, HU Yanli, WEI Haichuan. Pollution Characteristics and Formation Potential for O3 and SOA of Ambient VOCs in Suining Industrial Zone in Summer [J]. Ecology and Environment, 2023, 32(5): 956-968. |
| [5] | ZHANG Junwei, XIA Shengjie, CHEN Huiru, LIU Yanhong. Influence of Landscape Pattern Evolution on Thermal Environment of Urban Agglomerations in Central Shanxi Province [J]. Ecology and Environment, 2023, 32(5): 943-955. |
| [6] | YANG Kai, YANG Jingrui, CAO Peipei, LÜ Chunhua, SUN Wenjuan, YU Lingfei, DENG Xi. Dynamic Response of Rice Plant Height, Tillering and SPAD under Elevated CO2 Concentration and Their Simulation [J]. Ecology and Environment, 2023, 32(5): 933-942. |
| [7] | HAO Lei, ZHAI Yongguang, QI Wenchao, LAN Qiongqiong. Spatial-temporal Dynamics of Vegetation Carbon Sources/sinks in Inner Mongolia from 2001 to 2020 and Its Response to Climate Change [J]. Ecology and Environment, 2023, 32(5): 825-834. |
| [8] | LI Jianhui, DANG Zheng, CHEN Lin. Spatial-temporal Characteristics of PM2.5 and Its Influencing Factors in the Yellow River Jiziwan Metropolitan Area [J]. Ecology and Environment, 2023, 32(4): 697-705. |
| [9] | LIU Ziwei, GE Jiwen, WANG Yuehuan, YANG Shiyu, YAO Dong, XIE Jinlin. Variation Pattern and Influential Factors of Methane Flux in the Dajiuhu Peatland [J]. Ecology and Environment, 2023, 32(4): 706-714. |
| [10] | WANG Jiali, FENG Jingke, YANG Yuanzheng, ZU Jiaxing, CAI Wenhua, YANG Jian. Research on Spatial Relations between Impervious Surfaces and the Urban Thermal Environment in the Central Metropolitan Area of Nanning City [J]. Ecology and Environment, 2023, 32(3): 525-534. |
| [11] | ZHANG Huaicheng, HAN Hong, WANG Zaifeng, HAN Lizhao, LIU Ke, ZHANG Guiqin, FAN Jing, WEI Xiaofeng. Micromorphology Characteristics and Chemical Composition of Urban Dust in Ji'nan [J]. Ecology and Environment, 2023, 32(3): 545-555. |
| [12] | WEN Lirong, JIANG Ming, HUANG Bo, YUAN Luan, ZHOU Yan, LU Weimei, ZHANG Ying, LIU Ming, ZHANG Liyun. Analysis of Ozone Pollution Causes and Source Analysis of VOCs in Typical Areas of Pearl River Delta: A Case Study of Zhongshan City [J]. Ecology and Environment, 2023, 32(3): 500-513. |
| [13] | WU Yarui, WANG Meijing, WANG Tao, YANG Meihuan. Effect of COVID-19 on Temporal and Spatial Distribution of NO2 Concentration and Socio-Economic Life: A Case Study of Shaanxi Province [J]. Ecology and Environment, 2023, 32(3): 514-524. |
| [14] | LI Yushi, XIA Zhiye, ZHANG Lei. Carbon Emission Prediction and Spatial Optimization of Land Use in Chengdu-Chongqing Economic Circle in 2030 Based on SSPs Multi-scenarios [J]. Ecology and Environment, 2023, 32(3): 535-544. |
| [15] | LIN Xin, DUAN Kunyu, GUO Hong, JIANG Dongsheng, JI Xiaoting, WANG Hong. The Causes of the Abnormal Increase of Ozone in Fuzhou City under Extreme High Temperature [J]. Ecology and Environment, 2023, 32(2): 320-330. |
| Viewed | ||||||
|
Full text |
|
|||||
|
Abstract |
|
|||||
Copyright © 2021 Editorial Office of ACTA PETROLEI SINICA
Address:No. 6 Liupukang Street, Xicheng District, Beijing, P.R.China, 510650
Tel: 86-010-62067128, 86-010-62067137, 86-010-62067139
Fax: 86-10-62067130
Email: syxb@cnpc.com.cn
Support byBeijing Magtech Co.ltd, E-mail:support@magtech.com.cn