Ecology and Environment ›› 2023, Vol. 32 ›› Issue (3): 500-513.DOI: 10.16258/j.cnki.1674-5906.2023.03.008
• Research Articles • Previous Articles Next Articles
WEN Lirong1,3( ), JIANG Ming1, HUANG Bo2, YUAN Luan1, ZHOU Yan1, LU Weimei2, ZHANG Ying1, LIU Ming2, ZHANG Liyun2
Received:2023-01-06
Online:2023-03-18
Published:2023-06-02
温丽容1,3(), 江明1, 黄渤2, 袁鸾1, 周炎1, 陆炜梅2, 张莹1, 刘明2, 张力昀2
作者简介:温丽容(1975年生),女,副高级工程师,硕士,研究方向为大气环境。E-mail: 105771055@qq.com
基金资助:CLC Number:
WEN Lirong, JIANG Ming, HUANG Bo, YUAN Luan, ZHOU Yan, LU Weimei, ZHANG Ying, LIU Ming, ZHANG Liyun. Analysis of Ozone Pollution Causes and Source Analysis of VOCs in Typical Areas of Pearl River Delta: A Case Study of Zhongshan City[J]. Ecology and Environment, 2023, 32(3): 500-513.
温丽容, 江明, 黄渤, 袁鸾, 周炎, 陆炜梅, 张莹, 刘明, 张力昀. 珠三角典型区域臭氧成因分析与VOCs来源解析——以中山为例[J]. 生态环境学报, 2023, 32(3): 500-513.
Add to citation manager EndNote|Ris|BibTeX
URL: https://www.jeesci.com/EN/10.16258/j.cnki.1674-5906.2023.03.008
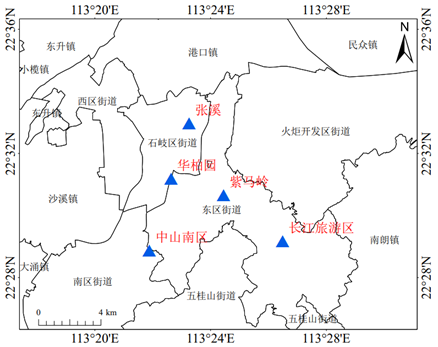
Figure 1 Existing air monitoring points in Zhongshan City
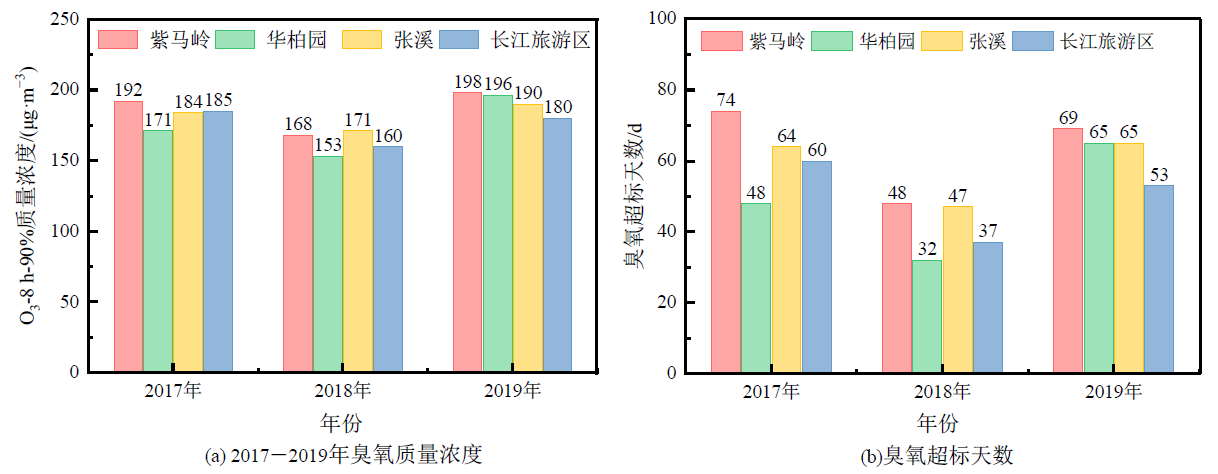
Figure 2 Comparison of ozone mass concentration and pollution days at monitoring stations in Zhongshan City from 2017 to 2019
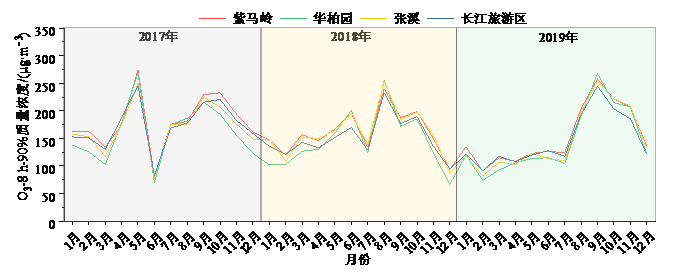
Figure 3 Comparison of monthly mass concentrations of ozone at monitoring stations in Zhongshan City from 2017 to 2019
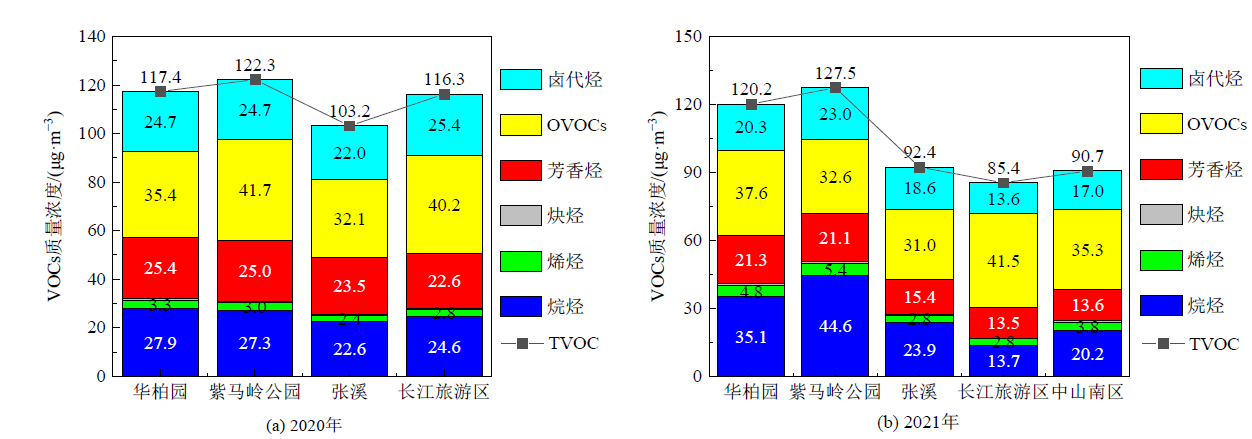
Figure 4 Comparison of mass concentrations of VOC category at Zhongshan City stations in 2020 and 2021
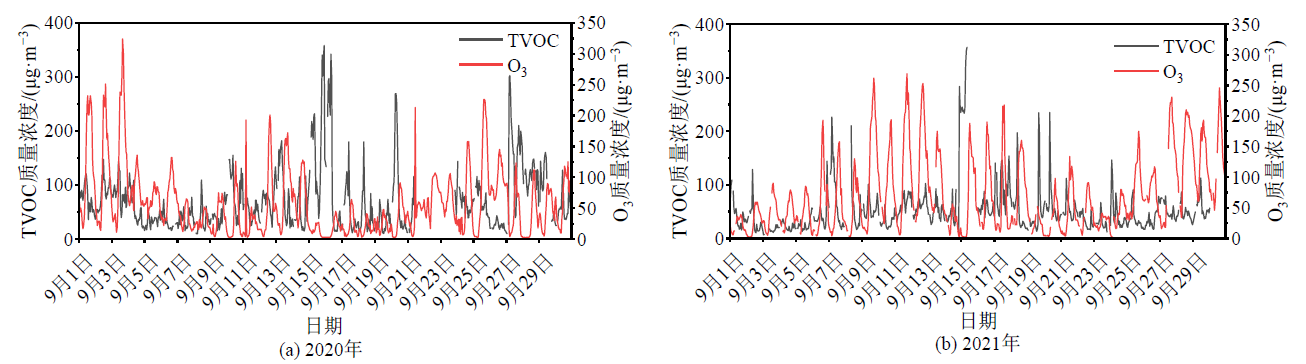
Figure 5 Change trend of total VOCs (TVOC) and O3 mass concentration monitored online in Zimaling, Zhongshan City
| 前10组分质量浓度/ (μg·m-3) | 紫马岭公园 | 长江旅游区 | 张溪 | 华柏园 |
|---|---|---|---|---|
| 乙酸乙酯 | 15.2 | 13.6 | 12.0 | 11.7 |
| 二氯甲烷 | 8.6 | 9.3 | 8.2 | 9.4 |
| 甲苯 | 8.6 | 7.7 | 7.1 | 7.8 |
| 2-丁酮 | 6.4 | 7.1 | 5.6 | 5.4 |
| 间/对-二甲苯 | 5.1 | 4.7 | 5.7 | 5.8 |
| 异戊烷 | 4.9 | 4.4 | 3.2 | 3.9 |
| 正丁烷 | 3.9 | 3.4 | 3.6 | 4.5 |
| 丙烷 | 3.2 | 3.0 | 3.0 | 3.9 |
| 丙醛 | 3.6 | 4.4 | - | 3.5 |
| 异丙醇 | - | 2.7 | 2.7 | - |
| 二氟二氯甲烷 | - | - | 2.5 | 2.7 |
| 己醛 | 3.4 | - | - | - |
| 总和 | 62.8 | 60.3 | 53.5 | 58.5 |
| 占比 | 51.0% | 51.4% | 50.9% | 49.1% |
Table 1 Mass concentrations of the top 10 components at each station in Zhongshan City in 2020
| 前10组分质量浓度/ (μg·m-3) | 紫马岭公园 | 长江旅游区 | 张溪 | 华柏园 |
|---|---|---|---|---|
| 乙酸乙酯 | 15.2 | 13.6 | 12.0 | 11.7 |
| 二氯甲烷 | 8.6 | 9.3 | 8.2 | 9.4 |
| 甲苯 | 8.6 | 7.7 | 7.1 | 7.8 |
| 2-丁酮 | 6.4 | 7.1 | 5.6 | 5.4 |
| 间/对-二甲苯 | 5.1 | 4.7 | 5.7 | 5.8 |
| 异戊烷 | 4.9 | 4.4 | 3.2 | 3.9 |
| 正丁烷 | 3.9 | 3.4 | 3.6 | 4.5 |
| 丙烷 | 3.2 | 3.0 | 3.0 | 3.9 |
| 丙醛 | 3.6 | 4.4 | - | 3.5 |
| 异丙醇 | - | 2.7 | 2.7 | - |
| 二氟二氯甲烷 | - | - | 2.5 | 2.7 |
| 己醛 | 3.4 | - | - | - |
| 总和 | 62.8 | 60.3 | 53.5 | 58.5 |
| 占比 | 51.0% | 51.4% | 50.9% | 49.1% |
| 前10组分 质量浓度/(μg·m-3) | 紫马岭公园 | 长江旅游区 | 中山 南区 | 张溪 | 华柏园 |
|---|---|---|---|---|---|
| 乙酸乙酯 | 8.5 | 12.9 | 5.2 | 6.2 | 5.7 |
| 2-丁酮 | 7.5 | 5.3 | 9.4 | 4.6 | 6.9 |
| 丙醛 | 3.6 | 7.2 | 6.5 | 6.8 | 8.2 |
| 甲苯 | 9.2 | 4.6 | 3.8 | 4.3 | 6.2 |
| 二氯甲烷 | 8.6 | 4.0 | 4.1 | 5.1 | 5.7 |
| 间/对-二甲苯 | 3.7 | 3.6 | 2.9 | 3.2 | 5.0 |
| 正丁烷 | 11.8 | - | 3.1 | 4.0 | 4.0 |
| 丙烷 | 9.4 | - | 3.7 | 3.6 | 4.3 |
| 己醛 | - | 3.8 | 3.1 | 3.0 | 3.6 |
| 异丁烷 | 8.4 | - | - | 3.1 | 3.8 |
| 正丁醛 | - | 2.9 | 3.1 | - | - |
| 异戊二烯 | 4.0 | - | - | - | - |
| 丙烯醛 | - | 2.3 | - | - | - |
| 二氟二氯甲烷 | - | 2.1 | - | - | - |
| 总和 | 74.6 | 48.8 | 44.7 | 43.7 | 53.5 |
| 占比 | 55.4% | 55.6% | 47.4% | 45.8% | 45.3% |
Table 2 Mass concentrations of the top 10 components at each station in Zhongshan City in 2021
| 前10组分 质量浓度/(μg·m-3) | 紫马岭公园 | 长江旅游区 | 中山 南区 | 张溪 | 华柏园 |
|---|---|---|---|---|---|
| 乙酸乙酯 | 8.5 | 12.9 | 5.2 | 6.2 | 5.7 |
| 2-丁酮 | 7.5 | 5.3 | 9.4 | 4.6 | 6.9 |
| 丙醛 | 3.6 | 7.2 | 6.5 | 6.8 | 8.2 |
| 甲苯 | 9.2 | 4.6 | 3.8 | 4.3 | 6.2 |
| 二氯甲烷 | 8.6 | 4.0 | 4.1 | 5.1 | 5.7 |
| 间/对-二甲苯 | 3.7 | 3.6 | 2.9 | 3.2 | 5.0 |
| 正丁烷 | 11.8 | - | 3.1 | 4.0 | 4.0 |
| 丙烷 | 9.4 | - | 3.7 | 3.6 | 4.3 |
| 己醛 | - | 3.8 | 3.1 | 3.0 | 3.6 |
| 异丁烷 | 8.4 | - | - | 3.1 | 3.8 |
| 正丁醛 | - | 2.9 | 3.1 | - | - |
| 异戊二烯 | 4.0 | - | - | - | - |
| 丙烯醛 | - | 2.3 | - | - | - |
| 二氟二氯甲烷 | - | 2.1 | - | - | - |
| 总和 | 74.6 | 48.8 | 44.7 | 43.7 | 53.5 |
| 占比 | 55.4% | 55.6% | 47.4% | 45.8% | 45.3% |
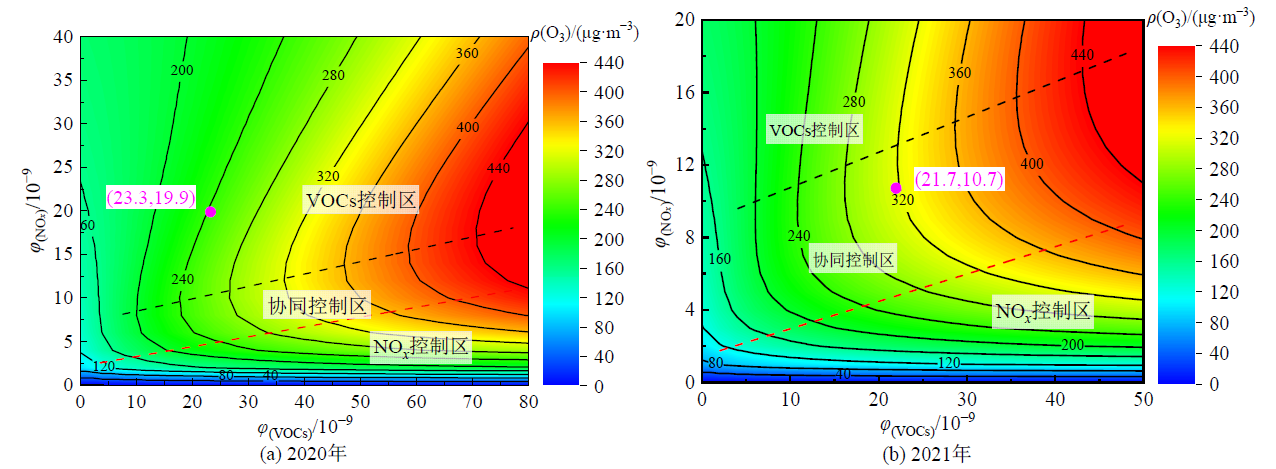
Figure 6 EKMA Curve
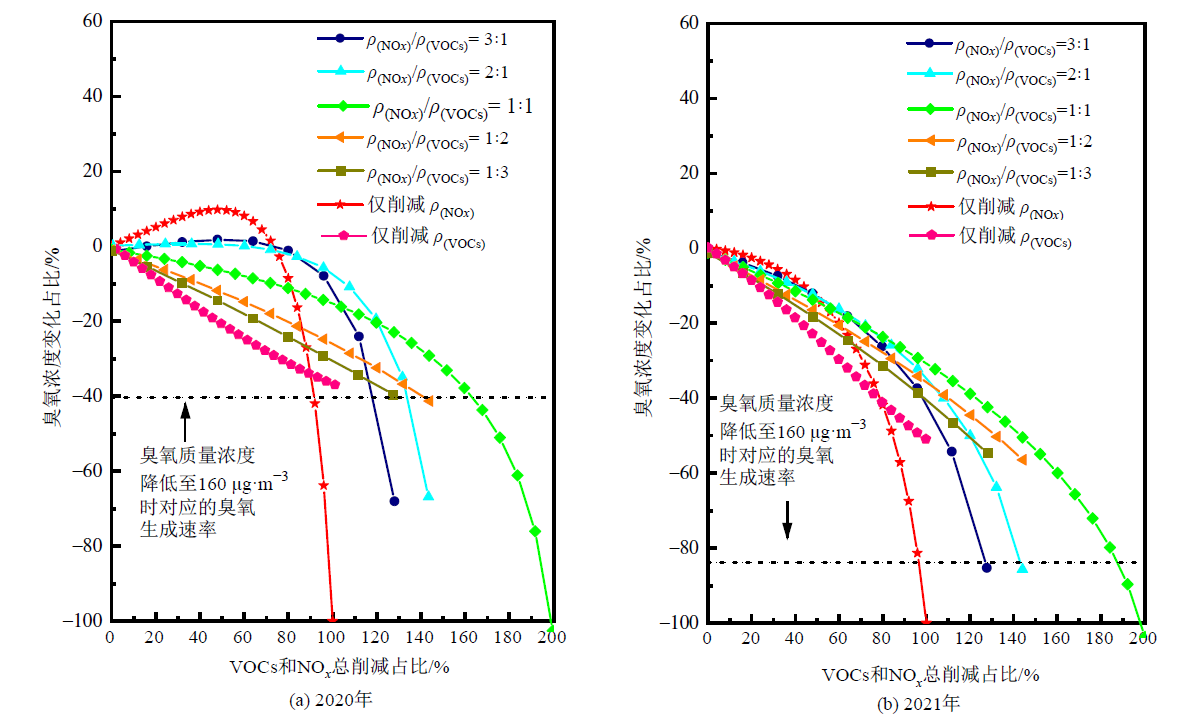
Figure 7 The impact of different reduction ratios on the change of baseline ozone concentration
| 前10组分OFP/ (μg·m-3) | 紫马岭公园 | 长江旅游区 | 张溪 | 华柏园 |
|---|---|---|---|---|
| 间/对-二甲苯 | 40.2 | 35.9 | 43.4 | 41.7 |
| 甲苯 | 33.8 | 30.1 | 27.5 | 29.2 |
| 邻-二甲苯 | 16.9 | 14.7 | 17.9 | 16.6 |
| 1, 2, 4-三甲苯 | 10.7 | 8.9 | 9.0 | 10.7 |
| 异戊二烯 | 10.5 | 8.5 | 6.3 | 8.8 |
| 乙烯 | 6.8 | 5.9 | 5.4 | 9.0 |
| 异戊烷 | 6.6 | 6.0 | 4.4 | 5.1 |
| 丙烯 | 5.7 | 5.8 | 5.4 | 7.8 |
| 乙苯 | 5.6 | 5.1 | 5.8 | 5.5 |
| 1, 3, 5-三甲苯 | 5.4 | 5.0 | 4.5 | 4.9 |
| 总和 | 142.1 | 125.9 | 129.7 | 139.1 |
| 占比 | 75.9% | 75.7% | 77.5% | 75.7% |
Table 3 Top 10 PAMS components of OFP in Zhongshan City in 2020
| 前10组分OFP/ (μg·m-3) | 紫马岭公园 | 长江旅游区 | 张溪 | 华柏园 |
|---|---|---|---|---|
| 间/对-二甲苯 | 40.2 | 35.9 | 43.4 | 41.7 |
| 甲苯 | 33.8 | 30.1 | 27.5 | 29.2 |
| 邻-二甲苯 | 16.9 | 14.7 | 17.9 | 16.6 |
| 1, 2, 4-三甲苯 | 10.7 | 8.9 | 9.0 | 10.7 |
| 异戊二烯 | 10.5 | 8.5 | 6.3 | 8.8 |
| 乙烯 | 6.8 | 5.9 | 5.4 | 9.0 |
| 异戊烷 | 6.6 | 6.0 | 4.4 | 5.1 |
| 丙烯 | 5.7 | 5.8 | 5.4 | 7.8 |
| 乙苯 | 5.6 | 5.1 | 5.8 | 5.5 |
| 1, 3, 5-三甲苯 | 5.4 | 5.0 | 4.5 | 4.9 |
| 总和 | 142.1 | 125.9 | 129.7 | 139.1 |
| 占比 | 75.9% | 75.7% | 77.5% | 75.7% |
| 前10组分OFP/(μg·m-3) | 紫马岭 公园 | 长江 旅游区 | 中山 南区 | 张溪 | 华柏园 |
|---|---|---|---|---|---|
| 异戊二烯 | 41.3 | 17.6 | 13.4 | 28.8 | 17.0 |
| 甲苯 | 35.8 | 17.7 | 16.5 | 24.2 | 14.7 |
| 间/对-二甲苯 | 27.8 | 28.3 | 24.0 | 38.2 | 21.9 |
| 邻-二甲苯 | 13.5 | 11.1 | 11.4 | 19.1 | 10.1 |
| 1, 2, 4-三甲苯 | 8.0 | 4.6 | 6.0 | 7.9 | 5.0 |
| 乙烯 | 5.8 | 4.1 | 6.7 | 8.8 | 7.6 |
| 乙苯 | - | 3.4 | 3.7 | 5.4 | 3.2 |
| 丙烯 | - | 2.4 | 3.8 | 5.1 | 4.9 |
| 正丁烷 | 12.7 | - | 4.3 | - | 3.4 |
| 异丁烷 | 9.8 | - | 3.6 | 4.5 | - |
| 异戊烷 | - | 2.3 | - | 4.6 | 3.6 |
| 1, 3, 5-三甲苯 | 3.9 | 2.4 | - | - | - |
| 丙烷 | 4.3 | - | - | - | - |
| 总和 | 163.0 | 93.7 | 93.4 | 146.6 | 91.5 |
| 占比 | 80.6% | 80.0% | 72.8% | 75.4% | 73.3% |
Table 4 Top 10 PAMS Components of OFP in Zhongshan City in 2021
| 前10组分OFP/(μg·m-3) | 紫马岭 公园 | 长江 旅游区 | 中山 南区 | 张溪 | 华柏园 |
|---|---|---|---|---|---|
| 异戊二烯 | 41.3 | 17.6 | 13.4 | 28.8 | 17.0 |
| 甲苯 | 35.8 | 17.7 | 16.5 | 24.2 | 14.7 |
| 间/对-二甲苯 | 27.8 | 28.3 | 24.0 | 38.2 | 21.9 |
| 邻-二甲苯 | 13.5 | 11.1 | 11.4 | 19.1 | 10.1 |
| 1, 2, 4-三甲苯 | 8.0 | 4.6 | 6.0 | 7.9 | 5.0 |
| 乙烯 | 5.8 | 4.1 | 6.7 | 8.8 | 7.6 |
| 乙苯 | - | 3.4 | 3.7 | 5.4 | 3.2 |
| 丙烯 | - | 2.4 | 3.8 | 5.1 | 4.9 |
| 正丁烷 | 12.7 | - | 4.3 | - | 3.4 |
| 异丁烷 | 9.8 | - | 3.6 | 4.5 | - |
| 异戊烷 | - | 2.3 | - | 4.6 | 3.6 |
| 1, 3, 5-三甲苯 | 3.9 | 2.4 | - | - | - |
| 丙烷 | 4.3 | - | - | - | - |
| 总和 | 163.0 | 93.7 | 93.4 | 146.6 | 91.5 |
| 占比 | 80.6% | 80.0% | 72.8% | 75.4% | 73.3% |
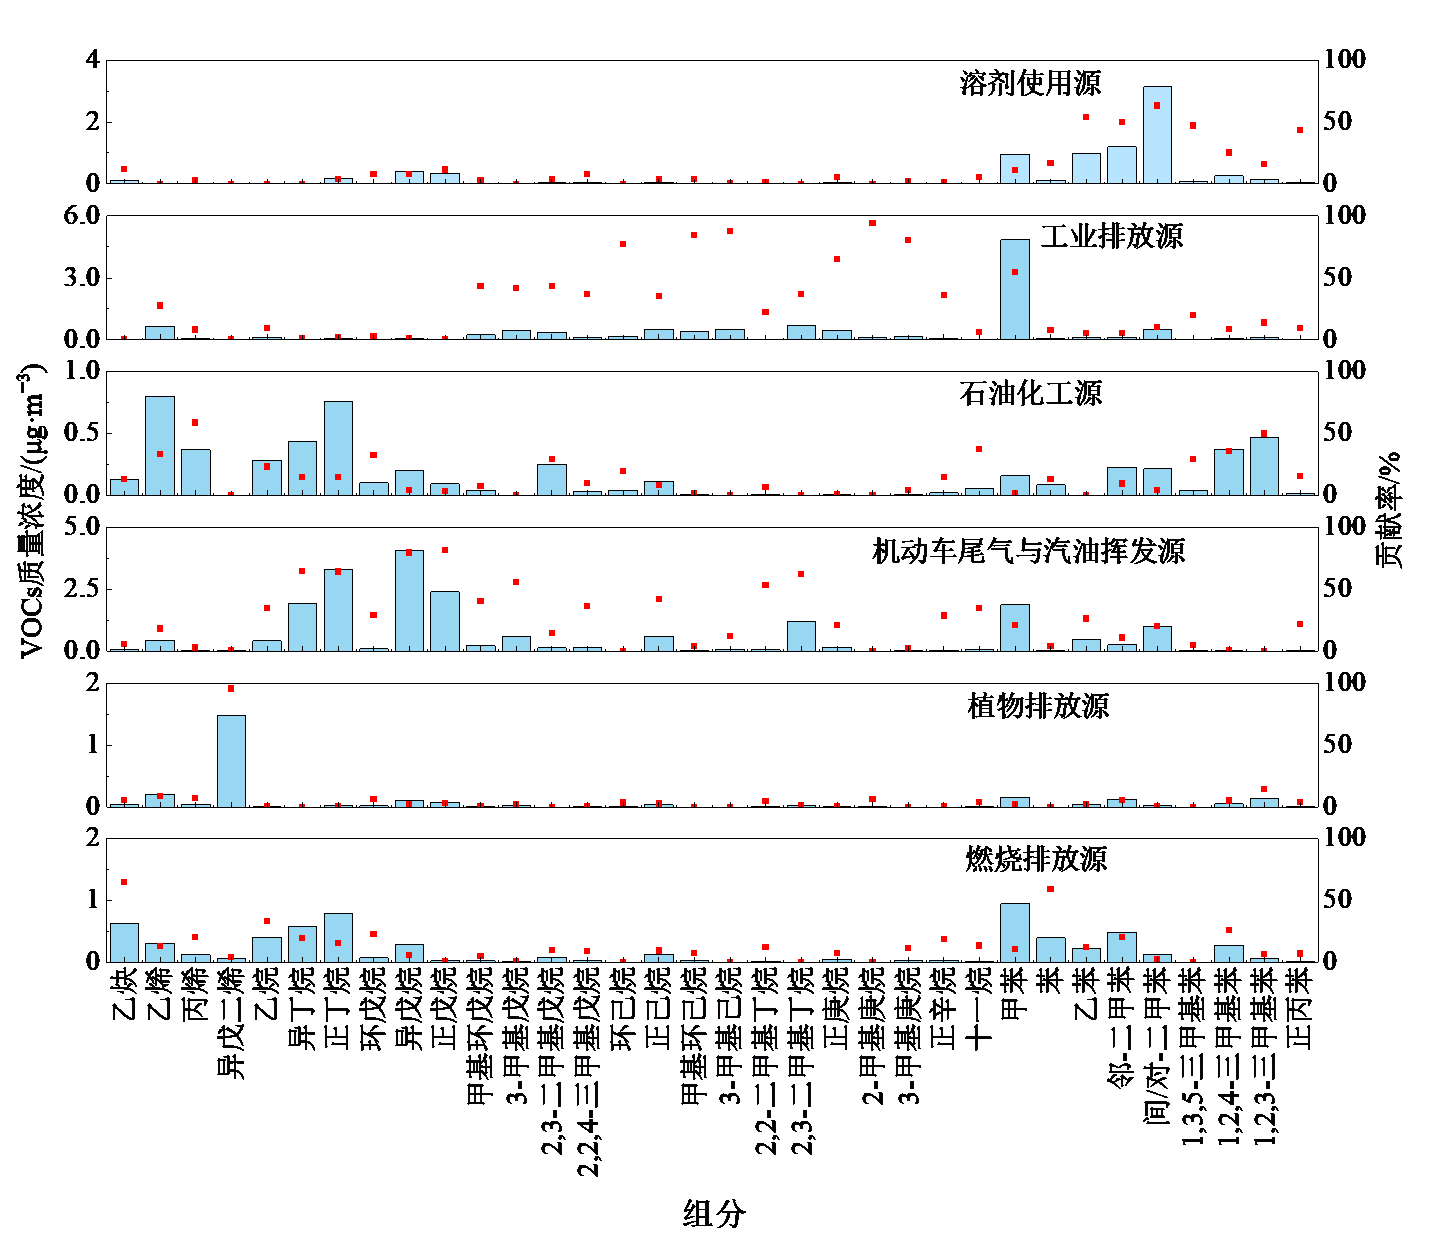
Figure 8 Quality concentration composition spectra of VOCs from various pollution sources at Zimaling Online Station in September 2020
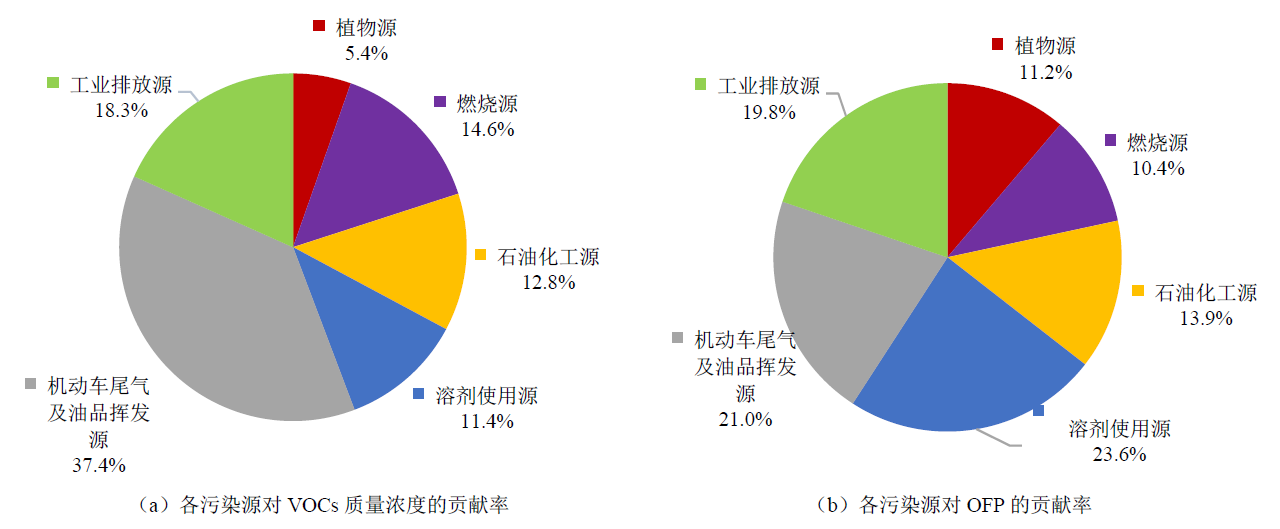
Figure 9 Contribution rate of various pollution sources to VOCs mass concentration and OFP at Zimaling Station (online in 2020)
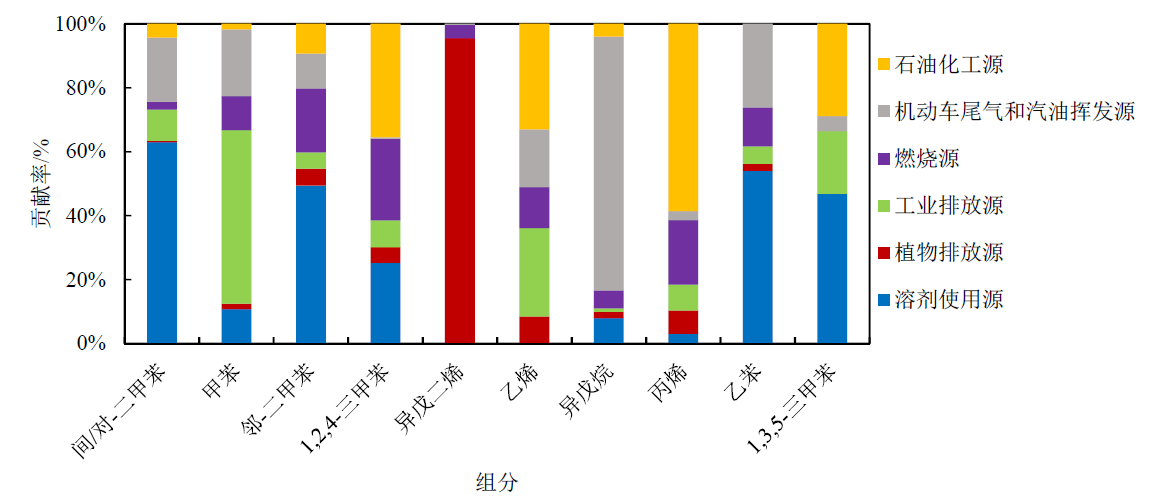
Figure 10 Proportion of each pollution source of the top 10 VOC components contributed by OFP during the monitoring period in 2020
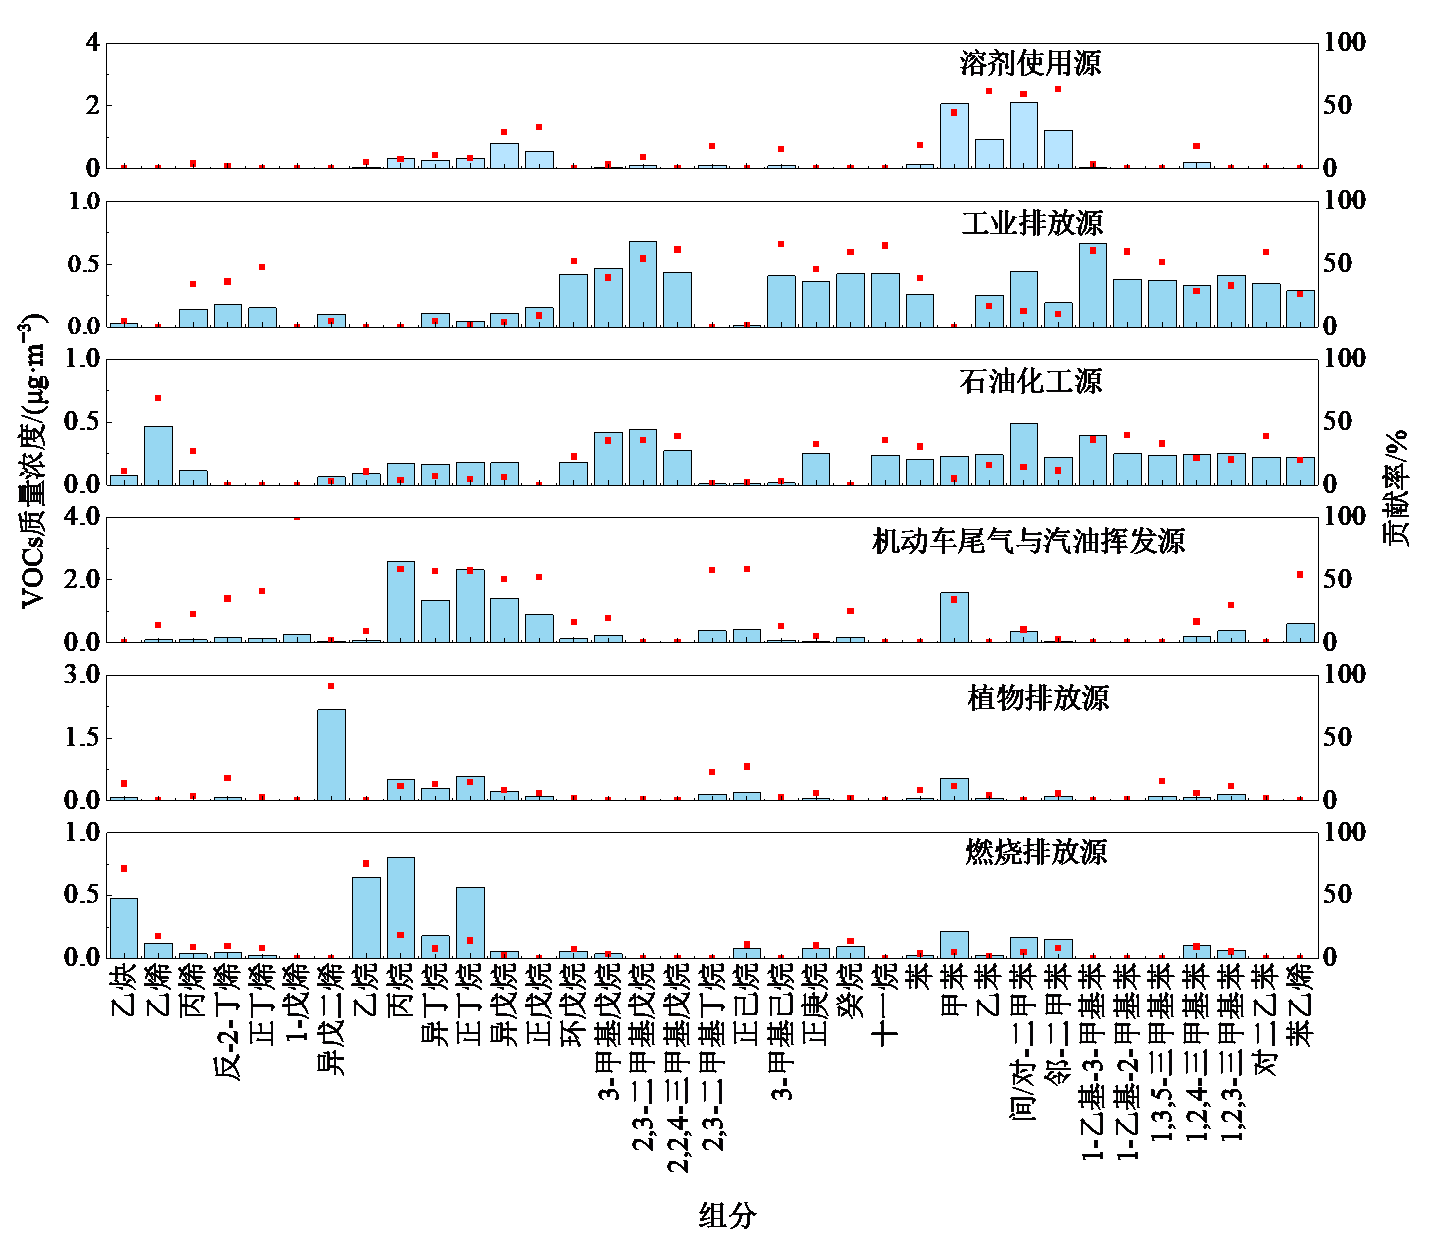
Figure 11 Quality concentration composition spectrum of VOCs from various pollution sources at Zimaling online site in September 2021
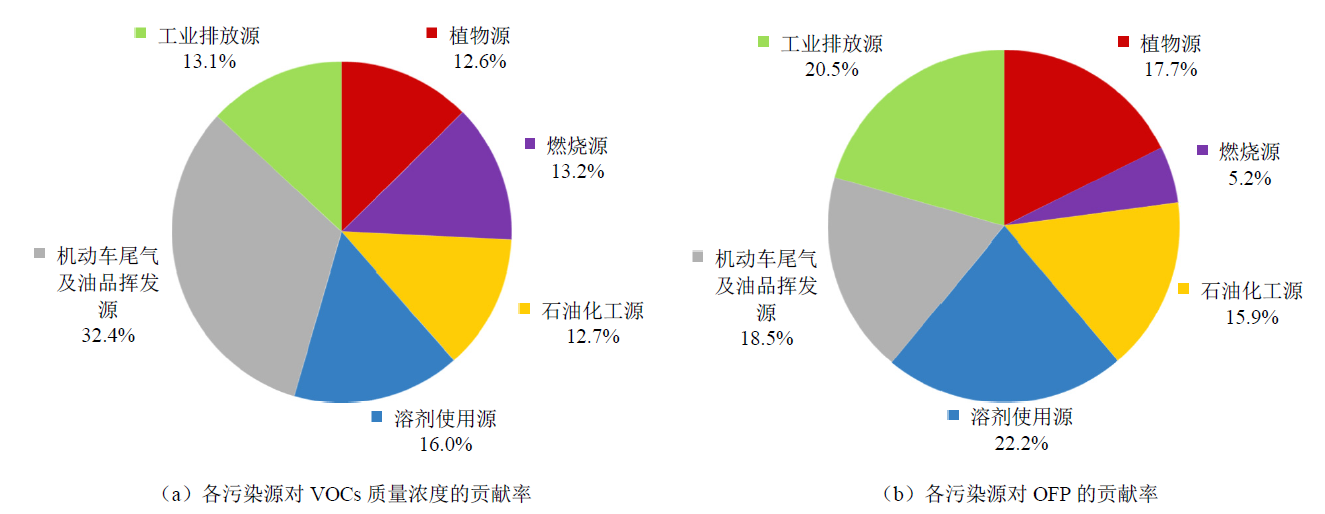
Figure 12 Proportion of contribution of various pollution sources to VOCs quality concentration and OFP at Zimaling Station (online in 2021)
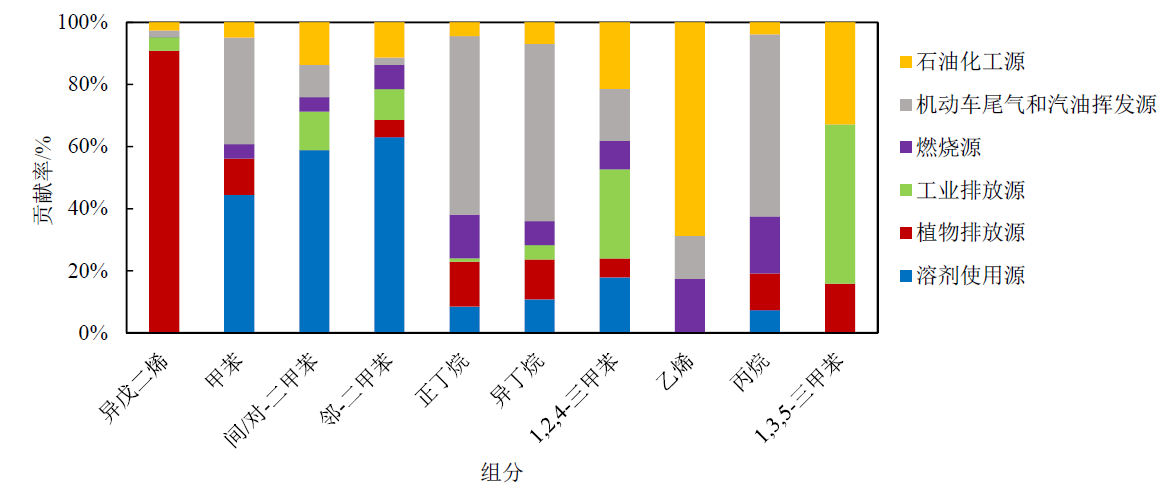
Figure 13 Proportion of each pollution source of the top 10 VOC components contributed by OFP during the monitoring period in 2021
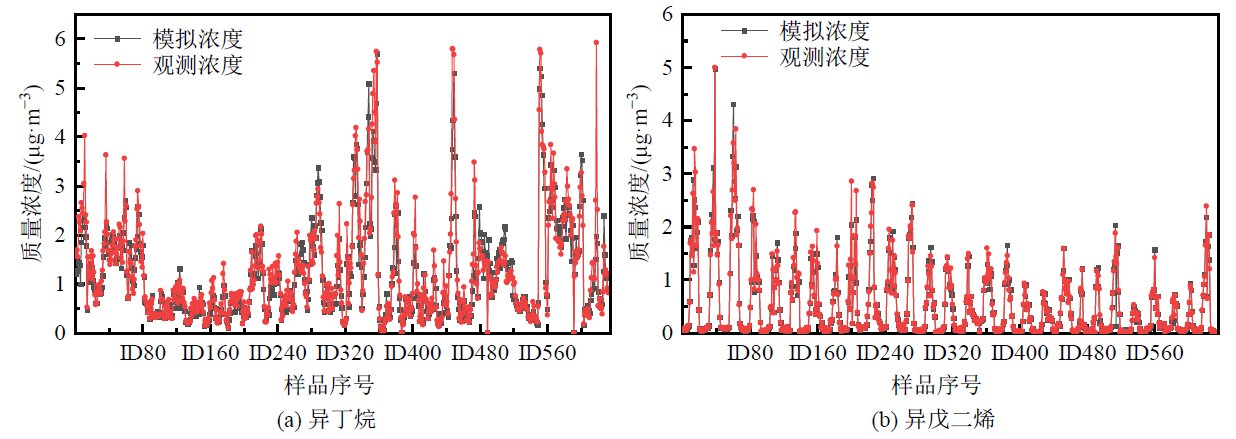
Figure 14 Time series of actual and simulated values of typical species
| 地点 | 时间 | 来源分布 | 相关文章 |
|---|---|---|---|
| 中山市 紫马岭 | 2020年9月1日-30日 | 机动车尾气及油品挥发源 (37.4%)、工业排放源 (18.3%)、燃烧源 (14.6%)、石油化工源 (12.8%)、溶剂使用源 (11.4%)、植物源 (5.4%) | 本研究 |
| 2021年9月1日-30日 | 机动车尾气及油品挥发源 (32.4%)、溶剂使用源 (16.0%)、燃烧源 (13.2%)、工业排放源 (13.1%)、石油化工源 (12.7%)、植物源 (12.6%) | ||
| 广州市 中心城区 | 2020年1月1日-9日 | 汽车尾气源 (22.4%)、溶剂使用源 (20.5%)、工业排放源 (17.9%)、生物质燃烧源 (16.5%)、油品挥发源 (13.0%)和植物源 (9.7%) | 裴成磊等, |
| 广州 磨碟沙 | 2015年10月15日- 11月10日 | 液化石油气使用 (32%)、机动车尾气 (27%)、工艺过程 (12%)、二次生成源 (9%)、化工行业 (8%)、溶剂涂料使用 (7%)和天然源 (5%) | 蒋美青等, |
| 汕头市 达濠中学 | 2019年10月7日-31日 | 机动车排放源 (38.0%)、汽油泄露与挥发源 (16.5%)、植物排放源 (5.5%)、溶剂使用源 (20.4%)、油燃烧源 (7.9%)、化工排放源 (11.7%) | 李娟等, |
| 佛山市 狮山镇 | 2021年4月1日-30日 | 溶剂使用源 (25.9%)、LPG排放源 (23.2%)、机动车排放源 (18.8%)、燃烧源 (17.4%)、燃料挥发源 (12.1%)和植物排放源 (2.7%) | 李瑞瑜等, |
Table 5 Comparison of source distribution in different regions of Guangdong Province
| 地点 | 时间 | 来源分布 | 相关文章 |
|---|---|---|---|
| 中山市 紫马岭 | 2020年9月1日-30日 | 机动车尾气及油品挥发源 (37.4%)、工业排放源 (18.3%)、燃烧源 (14.6%)、石油化工源 (12.8%)、溶剂使用源 (11.4%)、植物源 (5.4%) | 本研究 |
| 2021年9月1日-30日 | 机动车尾气及油品挥发源 (32.4%)、溶剂使用源 (16.0%)、燃烧源 (13.2%)、工业排放源 (13.1%)、石油化工源 (12.7%)、植物源 (12.6%) | ||
| 广州市 中心城区 | 2020年1月1日-9日 | 汽车尾气源 (22.4%)、溶剂使用源 (20.5%)、工业排放源 (17.9%)、生物质燃烧源 (16.5%)、油品挥发源 (13.0%)和植物源 (9.7%) | 裴成磊等, |
| 广州 磨碟沙 | 2015年10月15日- 11月10日 | 液化石油气使用 (32%)、机动车尾气 (27%)、工艺过程 (12%)、二次生成源 (9%)、化工行业 (8%)、溶剂涂料使用 (7%)和天然源 (5%) | 蒋美青等, |
| 汕头市 达濠中学 | 2019年10月7日-31日 | 机动车排放源 (38.0%)、汽油泄露与挥发源 (16.5%)、植物排放源 (5.5%)、溶剂使用源 (20.4%)、油燃烧源 (7.9%)、化工排放源 (11.7%) | 李娟等, |
| 佛山市 狮山镇 | 2021年4月1日-30日 | 溶剂使用源 (25.9%)、LPG排放源 (23.2%)、机动车排放源 (18.8%)、燃烧源 (17.4%)、燃料挥发源 (12.1%)和植物排放源 (2.7%) | 李瑞瑜等, |
| [1] |
CARTER W, 1994. Computer modeling of environmental chamber measurements of maximum incremental reactivities of volatile organic compounds[J]. Atmospheric Environment, 29(18): 2513-2527.
DOI URL |
| [2] |
CARTER W, 2010. Development of the SAPRC-07 chemical mechanism[J]. Atmospheric Environment, 44(40): 5324-5335.
DOI URL |
| [3] | HUANG X, DING A J, GAO J, et al., 2021. Enhanced secondary pollution offset reduction of primary emissions during COVID-19 lockdown in China[J]. National Science Review, 8(2): 51-59. |
| [4] |
LI Y, LAU A K H, FUNG J C H, et al., 2013. Importance of NOx control for peak ozone reduction in the Pearl River Delta region[J]. Journal of Geophysical Research: Atmospheres, 118(16): 9428-9443.
DOI URL |
| [5] |
LE T H, WANG Y, LIU L, et al., 2020. Unexpected air pollution with marked emission reductions during the COVID-19 outbreak in China[J]. Science, 369(6504): 702-706.
DOI PMID |
| [6] | LIU X F, GUO H, ZENG L W, et al., 2021. Photochemical ozone pollution in five Chinese megacities in summer 2018[J]. Science of the Total Environment, (801): 149603. |
| [7] |
OU J M, YUAN Z B, ZHENG J Y, et al., 2016. Ambient ozone control in a photochemically active region: short-term despiking or long-term attainment?[J]. Environmental Science & Technology, 50(11): 5720-5728.
DOI URL |
| [8] |
PAATERO P, TAPPER U, 1994. Positive matrix factorization: A non-negative factor model with optimal utilization of error estimates of data values[J]. Environmetrics, 5(2): 111-126.
DOI URL |
| [9] |
SILLMAN S, 2002. The relation between ozone, NOx and hydrocarbons in urban and polluted rural environments[J]. Atmospheric Environment, 33(12): 1821-1845.
DOI URL |
| [10] |
SO K L, WANG T, 2003. On the local and regional influence on ground-level ozone concentrations in Hong Kong[J]. Environmental Pollution, 123(2): 307-317.
PMID |
| [11] |
SHAO M, ZHANG Y H, ZENG L M, et al., 2009. Ground-level ozone in the Pearl River Delta and the roles of VOC and NOx in its production[J]. Journal of Environmental Management, 90(1): 512-518.
DOI URL |
| [12] | SHEN J, CHEN S L, HUANG X B, et al., 2019. Source analysis of O3and PM2.5in the western Foshan City in autumn[J]. Environmental Science & Technology, 42(S1): 143-146. |
| [13] |
TIAN Y Z, ZHANG Y F, LIANG Y L, et al., 2020. PM2.5 source apportionment during severe haze episodes in a Chinese megacity based on a 5-month period by using hourly species measurements: Explore how to better conduct PMF during haze episodes[J]. Atmospheric Environment, 224: 117364.
DOI URL |
| [14] | WANG X, ZHANG Y, HU Y, et al., 2010. Process analysis and sensitivity study of regional ozone formation over the Pearl River Delta, China, during the PRIDE-PRD2004 campaign using the Community Multiscale Air Quality modeling system[J]. Atmospheric Chemistry and Physics, 10(9): 4423-4437. |
| [15] |
WANG X S, ZHANG Y H, HU Y T, et al., 2011. Decoupled direct sensitivity analysis of regional ozone pollution over the Pearl River Delta during the PRIDE-PRD2004 campaign[J]. Atmospheric Environment, 45(28): 4941-4949.
DOI URL |
| [16] |
WANG G, CHENG S Y, WEI W, et al., 2016. Characteristics and source apportionment of VOCs in the suburban area of Beijing, China[J]. Atmospheric Pollution Research, 7(4): 711-724.
DOI URL |
| [17] |
WANG N, LYU X P, DENG X J, et al., 2019. Aggravating O3 pollution due to NOx emission control in eastern China[J]. Science of the Total Environment, 677: 732-744.
DOI URL |
| [18] | XING J, WANG S X, JANG C, et al., 2011. Nonlinear response of ozone to precursor emission changes in China: A modeling study using response surface methodology[J]. Atmospheric Chemistry and Physics, 11(10): 5027-5044. |
| [19] |
XU D N, YUAN Z B, WANG M, et al., 2022. Multi-factor reconciliation of discrepancies in ozone-precursor sensitivity retrieved from observation- and emission-based models[J]. Environment International, 158: 106952.
DOI URL |
| [20] |
ZHANG Y H, HU M, ZHONG L J, et al., 2008. Regional integrated experiments on air quality over Pearl River Delta 2004 (PRIDE-PRD2004): Overview[J]. Atmospheric Environment, 42(25): 6157-6173.
DOI URL |
| [21] | ZOU Y, DENG X J, ZHU D, et al., 2015 Characteristics of 1 year of observational data of VOCs, NOx and O3 at a suburban site in Guangzhou, China[J]. Atmospheric Chemistry and Physics, 15(12): 6625-6636. |
| [22] |
ZHONG Z M, ZHENG J Y, ZHU M N, et al., 2018. Recent developments of anthropogenic air pollutant emission inventories in Guangdong Province, China[J]. Science of the Total Environment, 627: 1080-1092.
DOI URL |
| [23] | ZHAO Y B, ZHANG K, XU X T, et al., 2020. Substantial changes in nitrogen dioxide and ozone after excluding meteorological impactsduring the COVID-19 outbreak in mainland China[J]. Environmental Science & Technology Letters, 7(6): 402-408. |
| [24] |
陈瑶瑶, 廖彤, 汪宇, 等, 2022. 2016-2020年广东省臭氧污染特征[J]. 生态环境学报, 31(12): 2374-2381.
DOI |
| CHEN Y Y, LIAO T, WANG Y, et al., 2022. Characteristics of ozone pollution in Guangdong province from 2016 to 2020[J]. Ecology and Environmental Sciences, 31(12): 2374-2381. | |
| [25] |
洪莹莹, 陈辰, 保鸿燕, 等, 2021. 珠三角西南部春季臭氧来源与敏感性分析[J]. 生态环境学报, 30(5): 984-994.
DOI |
| HONG Y Y, CHEN C, BAO H Y, 2021. Sources and sensitivity analysis of ozone in spring over the southwestern part of Pearl River Delta region[J]. Ecology and Environmental Sciences, 30(5): 984-994. | |
| [26] | 李冰, 陈长和, 余金香, 1998. 利用EKMA曲线制定光化学烟雾污染区域总量控制方案[J]. 高原气象, 17(2): 111-117. |
| LI B, CHEN C H, YU J X, 1998. Using EKMA curve to formulate a total amount control plan for photochemical smog pollution areas[J]. Plateau Meteorology, 17(2): 111-117. | |
| [27] | 李娟, 李成柳, 郭岩, 等, 2021. 汕头市城区大气VOCs来源解析及其对臭氧生成的影响[J]. 环境保护科学, 47(2): 145-152. |
| LI J, LI C L, GUO Y, et al., 2021. Source analysis of volatile organic compounds and its influence on ozone formation in urban area of Shantou[J]. Environmental Protection Science, 47(2): 145-152. | |
| [28] | 李瑞瑜, 郑雅清, 陈耿, 2021. 佛山市大气VOCs污染特征及来源解析[J]. 广东化工, 48(20): 158-161, 192. |
| LI R Y, ZHENG Y Q, CHEN G, 2021. Pollution characteristics and source apportionment of VOCs in Foshan city[J]. Guangdong Chemical Industry, 48(20): 158-161, 192. | |
| [29] | 蒋美青, 陆克定, 苏榕, 等, 2018. 我国典型城市群O3污染成因和关键VOCs活性解析[J]. 科学通报, 63(12): 1130-1141. |
| JIANG M Q, LU K D, SU R, et al., 2018. Ozone formation and key VOCs in typical Chinese city clusters[J]. Chinese Science Bulletin, 63(12): 1130-1141. | |
| [30] | 裴成磊, 谢雨彤, 陈希, 等, 2022. 广州市冬季一次典型臭氧污染过程分析[J]. 环境科学, 43(10): 4305-4315. |
| PEI C L, XIE Y T, CHEN X, et al., 2022. Analysis of a typical ozone pollution process in Guangzhou in winter[J]. Environmental Science, 43(10): 4305-4315. | |
| [31] | 沈劲, 汪宇, 曹静, 等, 2017. 粤东北地区秋季臭氧来源解析与生成敏感性研究[J]. 环境科学与技术, 40(4): 100-106. |
| SHEN J, WANG Y, CAO J, et al., 2017. Study on ozone source and its generating sensitivity in northeastern Guangdong during autumn[J]. Environmental Science & Technology, 40(4): 100-106. | |
| [32] | 沈劲, 陈诗琳, 黄晓波, 等, 2019. 佛山西部秋季O3与PM2.5来源解析[J]. 环境科学与技术, 42(S1): 143-146. |
| SHEN J, CHEN S L, HUANG X B, et al., 2019. Source analysis of O3 and PM2.5 in the western Foshan City in autumn[J]. Environmental Science & Technology, 42(S1): 143-146. | |
| [33] | 沈劲, 杨土士, 晏平仲, 等, 2020. 广东省臭氧污染特征及其成因分析[J]. 环境科学与技术, 43(12): 90-95. |
| SHEN J, YANG T S, YAN P Z, et al., 2020. Characteristics and causes of ozone pollution in Guangdong Province[J]. Environmental Science & Technology, 43(12): 90-95. | |
| [34] | 唐孝炎, 张远航, 邵敏, 2006. 大气环境化学[M]. 北京: 高等教育出版社:739. |
| TANG X Y, ZHANG Y H, SHAO M, 2006. Atmospheric Environmental Chemistry[M]. Beijing: Higher Education Press:739. | |
| [35] | 伍永康, 陈伟华, 颜丰华, 等, 2022. 不同传输通道下珠江三角洲臭氧与前体物非线性响应关系[J]. 环境科学, 43(1): 160-169. |
| WU Y K, CHEN W H, YAN F H, et al., 2022. Nonlinear response relationship between ozone and precursor emissions in the Pearl River delta region under different transmission channels[J]. Environmental Science, 43(1): 160-169. | |
| [36] | 叶绿萌, 樊少芬, 常鸣, 等, 2016. 珠三角地区秋季臭氧生成敏感性时空变化模拟研究[J]. 南京大学学报 (自然科学), 52(6): 977-988. |
| YE L M, FAN S F, CHANG M, et al., 2016. Spatial and temporal distribution of ozone sensitive district in Pearl River Delta region during autumn[J]. Journal of Nanjing University (Natural Sciences), 52(6): 977-988. | |
| [37] | 湛社霞, 2018. 粤港澳大湾区常规大气污染物变化趋势与影响因素研究[D]. 广州: 中国科学院大学 (中国科学院广州地球化学研究所). |
| ZHAN S X, 2018. Research on changing trend and influencing factors of conventional air pollutants in Guangdong-Hong Kong-Macao Greater Bay Area[D]. Guangzhou: Guangzhou Institute of Geochemistry, Chinese Academy of Sciences. | |
| [38] | 庄立跃, 陈瑜萍, 范丽雅, 等, 2019. 基于OMI卫星数据和MODIS土地覆盖类型数据研究珠江三角洲臭氧敏感性[J]. 环境科学学报, 39(11): 3581-3592. |
| ZHUANG L Y, CHEN Y P, FAN L Y, et al., 2019. Study on the ozone formation sensitivity in the Pearl River Delta based on OMI satellite data and MODIS land cover type products[J]. ActaScientiae Circumstantiae, 39(11): 3581-3592. | |
| [39] | 赵伟, 高博, 卢清, 等, 2021. 2006-2019年珠三角地区臭氧污染趋势[J]. 环境科学, 42(1): 97-105. |
| ZHAO W, GAO B, LU Q, et al., 2021. Ozone Pollution Trend in the Pearl River Delta Region During 2006-2019[J]. Environmental Science, 42(1): 97-105. | |
| [40] | 中华人民共和国生态环境部, 2018. 环境空气挥发性有机物气相色谱连续监测系统技术要求及检测方法: HJ 1010—2018[S]. 北京: 中国环境出版集团: 2-12. |
| Ministry of Ecology and Environment of the People's Republic of China, 2018. Specifications and Test Procedures for Ambient Air Quality Continuous Monitoring System with Gas Chromatography for Volatile Organic Compounds: HJ 1010—2018[S]. Beijing: China Environment Publishing Group: 2-12. |
| [1] | YAN Xuejun, HAO Saimei, ZHANG Rongrong, QIN Hua, GAO Sulian, WANG Feng, JIN Xianzhong, SUN Youmin, ZHANG Guiqin. Composition Spectrum and Emission Estimation of VOCs from Furniture Malls [J]. Ecology and Environment, 2023, 32(6): 1070-1077. |
| [2] | XU Xiaoyun, RAO Zhihan, JIANG Hongbin, ZHANG Wei, CHEN Chao, YANG Yongan, HU Yanli, WEI Haichuan. Pollution Characteristics and Formation Potential for O3 and SOA of Ambient VOCs in Suining Industrial Zone in Summer [J]. Ecology and Environment, 2023, 32(5): 956-968. |
| [3] | FU Chuanbo, DAN Li, TONG Jinhe, CHEN Hong. Characteristics and Potential Source Analysis of Ozone pollution in Haikou City [J]. Ecology and Environment, 2023, 32(2): 331-340. |
| [4] | SHI Wenjing, ZHOU Hanpeng, SUN Tao, HUANG Jintao, YANG Wenhuan, LI Weiping. Research on Priority Control Factors and Health Risk Assessment of Heavy Metal Pollution in Soil Around Mining Areas [J]. Ecology and Environment, 2022, 31(8): 1616-1628. |
| [5] | LI Chengcheng, ZHANG Zirui, SONG Xiaoxuan, KONG Juanjuan, HAN Yang, RUAN Yanan. Effects of Ozone Stress on Antioxidant Metabolism and Reproductive Growth of Soybean [J]. Ecology and Environment, 2022, 31(7): 1383-1392. |
| [6] | CHEN Xuequan, KONG Bin, LAN Qing, YU Zhiquan, XIE Yinsi, HUANG Junyi. Emission Characteristics and Ozone Formation Potential Assessment of Volatile Organic Compounds (VOCs) from Adhesive Manufacturing Industry [J]. Ecology and Environment, 2022, 31(4): 750-758. |
| [7] | LI Yinghui, GUO Qianjin, YAN Yulong, HU Dongmei, DENG Mengjie, PENG Lin. Variation Characteristics and Source Apportionment of Ambient BTEX in Jincheng City [J]. Ecology and Environment, 2022, 31(3): 504-511. |
| [8] | CHEN Yaoyao, LIAO Tong, WANG Yu, SHEN Jin, ZHAI Yuhong, YE Siqi, CHEN Duohong, CHEN Jingyang. Characteristics of Ozone Pollution in Guangdong Province from 2016 to 2020 [J]. Ecology and Environment, 2022, 31(12): 2374-2381. |
| [9] | LIAO Tong, XIONG Xin, WANG Zaihua, YANG Xiajie, HUANG Yingnan, FENG Jiaying. The Experience of Prevention and Control of Air Pollution in International Advanced Bay Areas and Its Enlightenment to Guangdong-Hong Kong-Macao Greater Bay Area in China [J]. Ecology and Environment, 2022, 31(11): 2242-2250. |
| [10] | CHEN Yang, ZHANG Jinpu, QIU Xiaonuan, JU Hong, HUANG Jun. Characteristic of Ozone Pollution and Meteorological Factors Analysis in Guangzhou in 2021 [J]. Ecology and Environment, 2022, 31(10): 2028-2038. |
| [11] | FU Chuanbo, DAN Li, LIU Lijun, TONG Jinhe. Characteristics of A Typical Ozone Pollution Event and Its Meteorological Reason in Sanya City in Autumn 2019 [J]. Ecology and Environment, 2022, 31(1): 89-99. |
| [12] | DENG Huiying, CHEN Lixin, YU Yongjiang, WANG Hong. Characteristics of Ozone Pollution Distribution and Its Correlation Analysis with Meteorological Factors in Wuyishan [J]. Ecology and Environment, 2021, 30(7): 1428-1435. |
| [13] | HONG Yingying, CHEN Chen, BAO Hongyan, SHEN Jin. Sources and Sensitivity Analysis of Ozone in Spring Over the Southwestern Part of Pearl River Delta Region [J]. Ecology and Environment, 2021, 30(5): 984-994. |
| [14] | WAN Wuxing, ZHANG Shuai, LI Jie, SUN Xu, GUAN Zuguang, YU Xiaohong, YANG Yonghong, WANG Xiaoke. Regional Differences of Urban Ozone Pollution and Its Damage to Plants in Hebei Province [J]. Ecology and Environment, 2021, 30(11): 2185-2194. |
| [15] | ZHOU Yingtong, WANG Yan, SUN Mingyu, SAN Yu, YAO Xingzhou, ZHAO Tianhong. Effect of Ozone Concentration Increasing Near the Ground on Antioxidant System of Parent and Offspring Soybean Leaves [J]. Ecology and Environment, 2021, 30(11): 2195-2203. |
| Viewed | ||||||
|
Full text |
|
|||||
|
Abstract |
|
|||||
Copyright © 2021 Editorial Office of ACTA PETROLEI SINICA
Address:No. 6 Liupukang Street, Xicheng District, Beijing, P.R.China, 510650
Tel: 86-010-62067128, 86-010-62067137, 86-010-62067139
Fax: 86-10-62067130
Email: syxb@cnpc.com.cn
Support byBeijing Magtech Co.ltd, E-mail:support@magtech.com.cn