生态环境学报 ›› 2025, Vol. 34 ›› Issue (4): 534-547.DOI: 10.16258/j.cnki.1674-5906.2025.04.004
郭铭彬1( ), 龚建周1, 王丽娟2,*(), 王时宽1
收稿日期:2024-11-16
出版日期:2025-04-18
发布日期:2025-04-24
通讯作者:
*王丽娟。E-mail: wanglj1981@126.com作者简介:郭铭彬(2002年生),男,硕士研究生,主要研究方向为生态遥感与大气环境。E-mail: guomb61127@126.com
基金资助:
GUO Mingbin1(), GONG Jianzhou1, WANG Lijuan2,*(), WANG Shikuan1
Received:2024-11-16
Online:2025-04-18
Published:2025-04-24
摘要: 基于Sentinel-5P卫星提供的二氧化氮对流层柱浓度数据(NRTI/L3_NO2),结合气象数据、NDVI和陆表温度数据,采用Sen趋势分析、Mann-Kendall检验等方法,并辅以地理探测器与时空地理加权回归模型(GTWR),解析2019-2023年粤港澳大湾区NO2柱浓度时空变化与自然驱动机制。结果显示:1)年际变化上,2021年NO2柱浓度达到峰值,2020年为最低,季节性变化上冬季浓度最高,夏季最低,空间分布呈“中间高、四周低”的特点;2)Sen年趋势分析表明,广佛交界、深圳西部、肇庆等地NO2浓度上升,珠海、江门、澳门等地下降;Mann-Kendall检验显示,广州北部与肇庆为显著增长区;3)地理探测器分析表明,风速、温度、湿度和气压是主要影响因子,降水和太阳辐射影响较弱;湿度与风速、湿度与温度的交互作用显著,非线性增强效应表现在气压、降水与其他因子的交互中;4)GTWR模型分析显示,风速、温度和陆表温度对NO2浓度存在正向影响,广佛与深圳尤为显著;气压、湿度与植被指数对其存在负向影响,江门与珠海更为明显;降水与太阳辐射的影响复杂,空间差异较大。该研究可为理解大湾区NO2污染的时空变化及自然驱动机制提供参考,助力空气质量管理和污染控制策略的制定。
中图分类号:
郭铭彬, 龚建周, 王丽娟, 王时宽. 2019-2023年粤港澳大湾区NO2浓度变化的自然主控因子解析[J]. 生态环境学报, 2025, 34(4): 534-547.
GUO Mingbin, GONG Jianzhou, WANG Lijuan, WANG Shikuan. Analysis of the Natural Dominant Factors Driving NO2 Concentration Changes in the Guangdong-Hong Kong-Macao Greater Bay Area from 2019 to 2023[J]. Ecology and Environmental Sciences, 2025, 34(4): 534-547.

图1 粤港澳大湾区区位图 基于自然资源部标准地图服务网站下载的审图号为GS(2024)0650号标准地图制作;底图边界无修改
Figure 1 Location map of Guangdong-Hong Kong-Macau Greater Bay Area (GBA)
| 数据 | 分辨率 | 数据来源 | 产品介绍 | |
|---|---|---|---|---|
| NO2数据 | 对流层柱浓度 | 1 km | GEE云平台( | 选用Sentinel-5P Near Real-Time NO2数据集,该影像集提供每天(近实时)的大气污染数据 |
| 气象数据 | 年平均风速(WSD) | 10 km | 选用ERA5-land数据集,该影像集通过重演 ECMWF ERA5气候再分析的陆地部分生成,拥有更高的空间分辨率 | |
| 年平均气温(TEMP) | ||||
| 年平均湿度(RH) | ||||
| 年平均气压(PRE) | ||||
| 年平均降水(PRCP) | ||||
| 年平均太阳辐射度(DNI) | ||||
| 植被数据 | 归一化植被指数(NDVI) | 500 m | 选用MODIS产品中MOD13A2 16d影像集,该影像集将16 d每个像素位置的植被指数(NDVI)进行合成而得 | |
| 下垫面状况 | 陆表温度(LST) | 1 km | 选用MODIS产品中的MOD11A2 V6影像集,为8 d平均地表温度合成数据 | |
表1 数据主要信息、来源及相应产品介绍
Table 1 Data main information, sources and corresponding product descriptions
| 数据 | 分辨率 | 数据来源 | 产品介绍 | |
|---|---|---|---|---|
| NO2数据 | 对流层柱浓度 | 1 km | GEE云平台( | 选用Sentinel-5P Near Real-Time NO2数据集,该影像集提供每天(近实时)的大气污染数据 |
| 气象数据 | 年平均风速(WSD) | 10 km | 选用ERA5-land数据集,该影像集通过重演 ECMWF ERA5气候再分析的陆地部分生成,拥有更高的空间分辨率 | |
| 年平均气温(TEMP) | ||||
| 年平均湿度(RH) | ||||
| 年平均气压(PRE) | ||||
| 年平均降水(PRCP) | ||||
| 年平均太阳辐射度(DNI) | ||||
| 植被数据 | 归一化植被指数(NDVI) | 500 m | 选用MODIS产品中MOD13A2 16d影像集,该影像集将16 d每个像素位置的植被指数(NDVI)进行合成而得 | |
| 下垫面状况 | 陆表温度(LST) | 1 km | 选用MODIS产品中的MOD11A2 V6影像集,为8 d平均地表温度合成数据 | |
| 判据 | 交互作用 |
|---|---|
| q(X1∩X2)<Min[q(X1), q(X2)] | 非线性减弱 |
| Min[q(X1), q(X2)]<q(X1∩X2)< Max[q(X1), q(X2)] | 单因子非线性减弱 |
| q(X1∩X2)>Max[q(X1), q(X2)] | 双因子增强 |
| q(X1∩X2)=q(X1)+q(X2) | 独立 |
| q(X1∩X2)>q(X1)+q(X2) | 非线性增强 |
表2 两个自变量对因子变量交互作用类型
Table 2 Type of interaction between two independent variables and factor variables
| 判据 | 交互作用 |
|---|---|
| q(X1∩X2)<Min[q(X1), q(X2)] | 非线性减弱 |
| Min[q(X1), q(X2)]<q(X1∩X2)< Max[q(X1), q(X2)] | 单因子非线性减弱 |
| q(X1∩X2)>Max[q(X1), q(X2)] | 双因子增强 |
| q(X1∩X2)=q(X1)+q(X2) | 独立 |
| q(X1∩X2)>q(X1)+q(X2) | 非线性增强 |
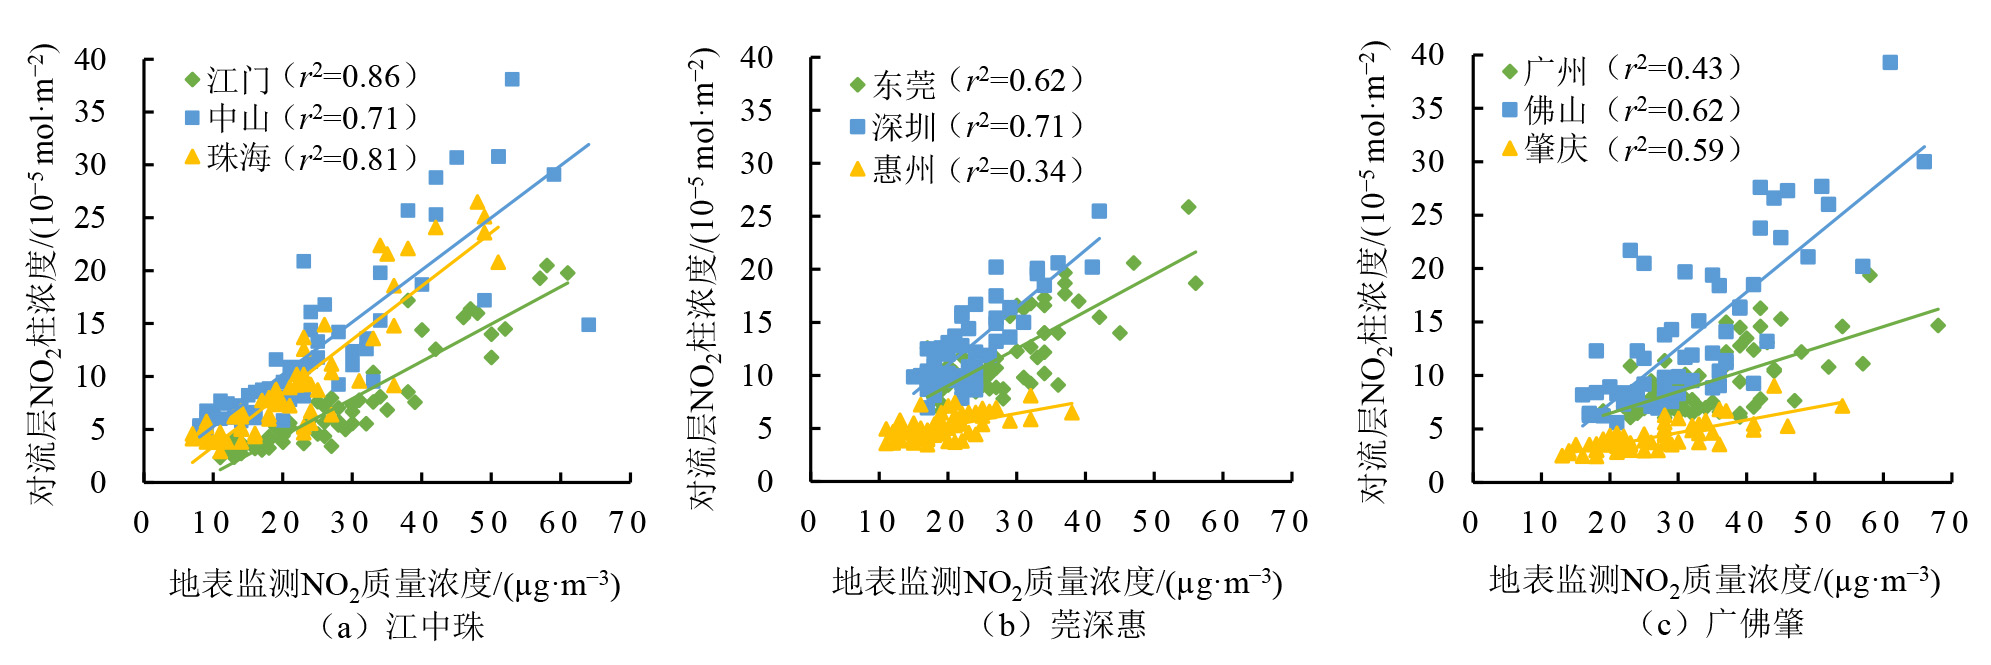
图2 粤港澳大湾区9市NO2地面浓度与NO2柱浓度的相关性分析
Figure 2 The correlation analysis between surface NO2 concentration and NO2 column density in the GBA’s 9 cities
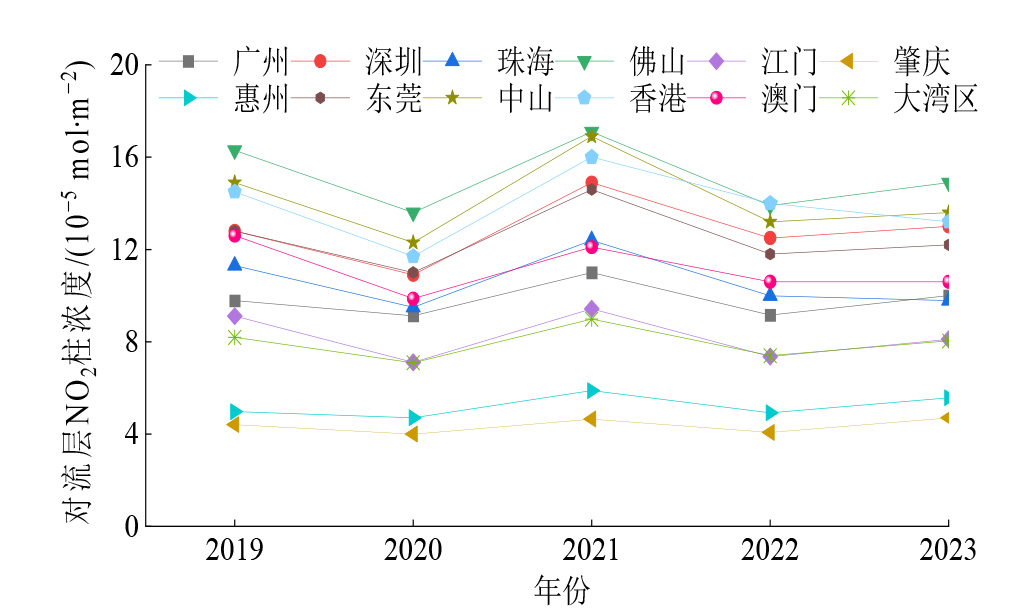
图3 粤港澳大湾区各区域NO2柱浓度均值逐年变化规律
Figure 3 Yearly variation of NO2 column concentrations in different regions of the GBA
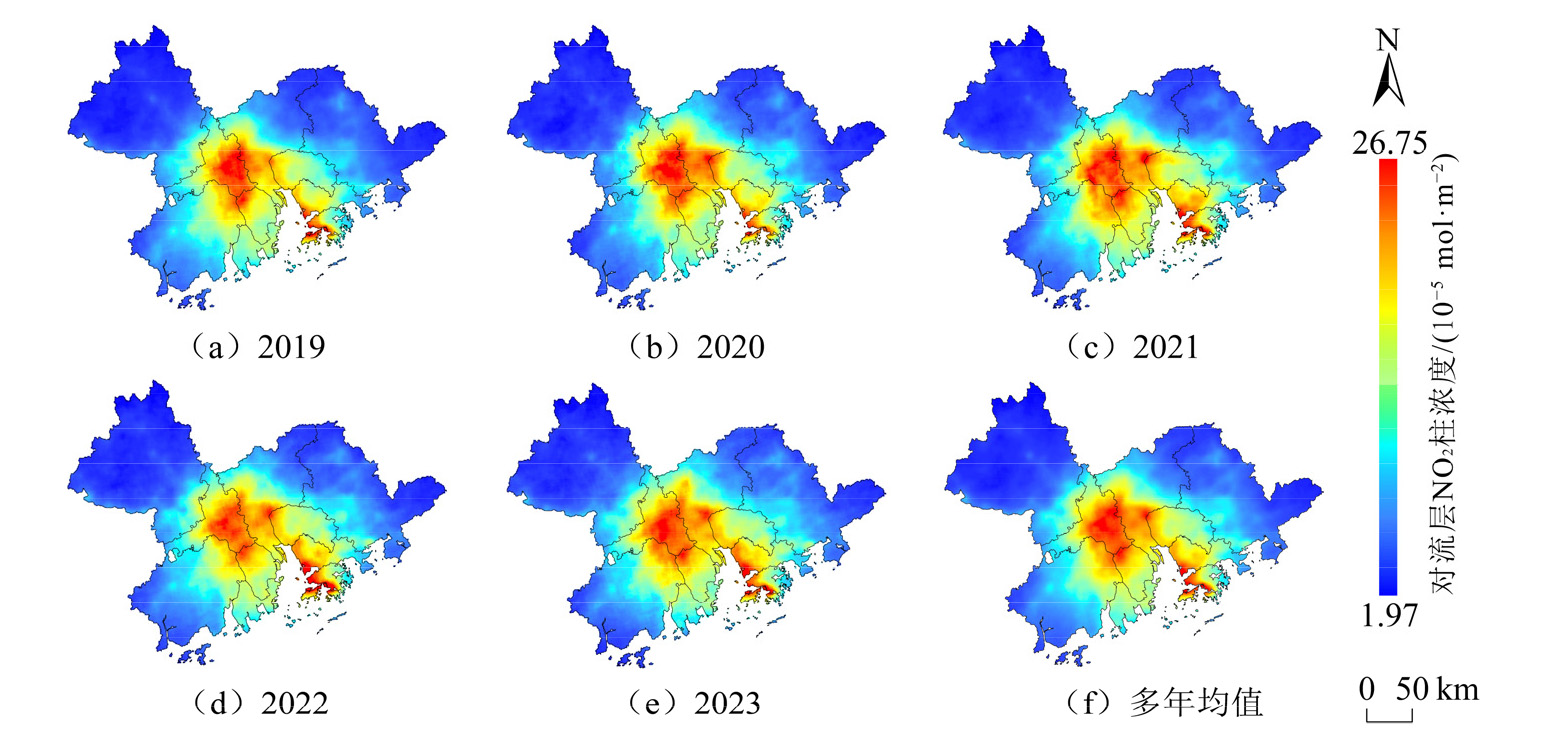
图4 粤港澳大湾区NO2柱浓度空间分布年际变化
Figure 4 Annual variation in spatial distribution of NO2 column concentration in the GBA
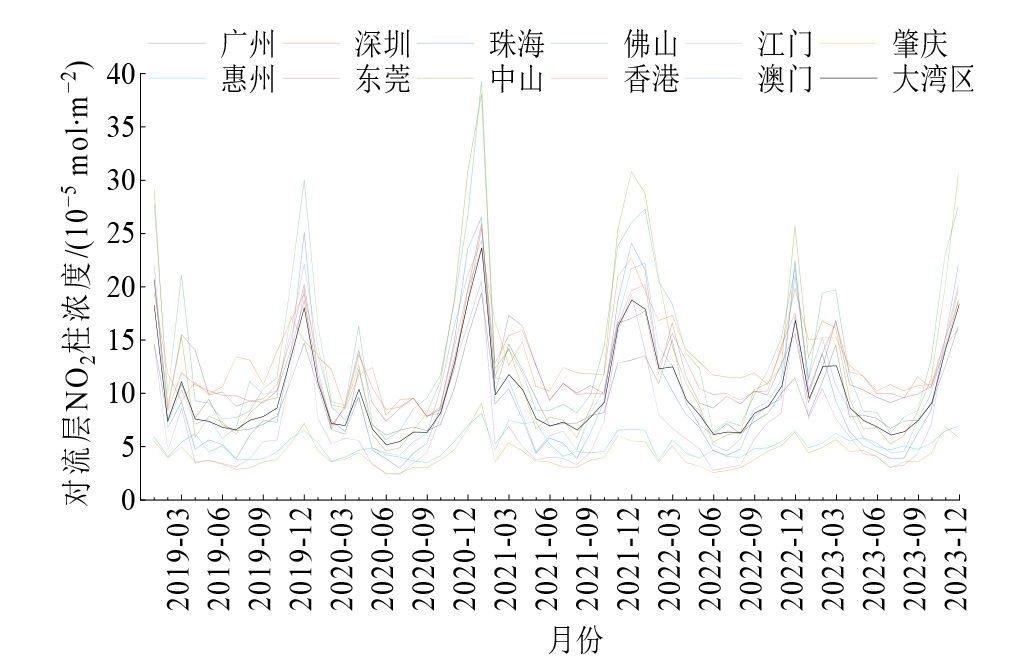
图5 粤港澳大湾区各区域NO2柱浓度均值月变化规律
Figure 5 Monthly variation of NO2 column concentrations in different regions of the GBA

图6 粤港澳大湾区NO2柱浓度空间分布月际变化
Figure 6 Monthly variation in spatial distribution of NO2 column concentration in the GBA
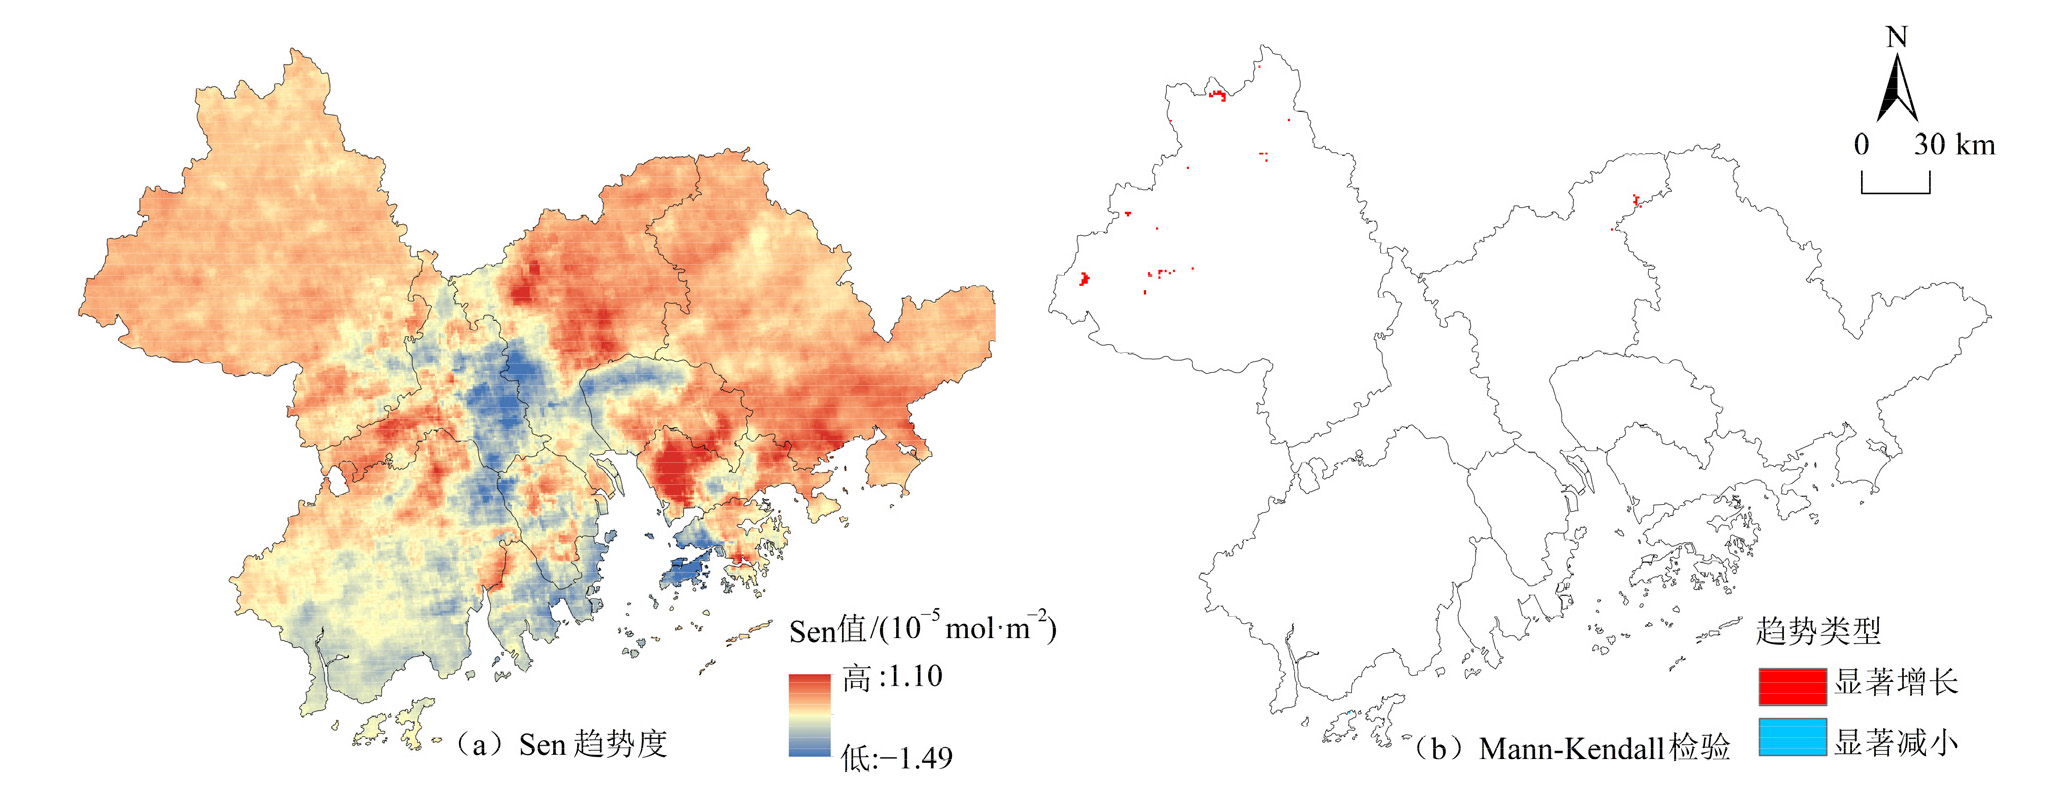
图7 粤港澳大湾区NO2柱浓度年际变化趋势
Figure 7 Trend of NO2 column concentration in the GBA
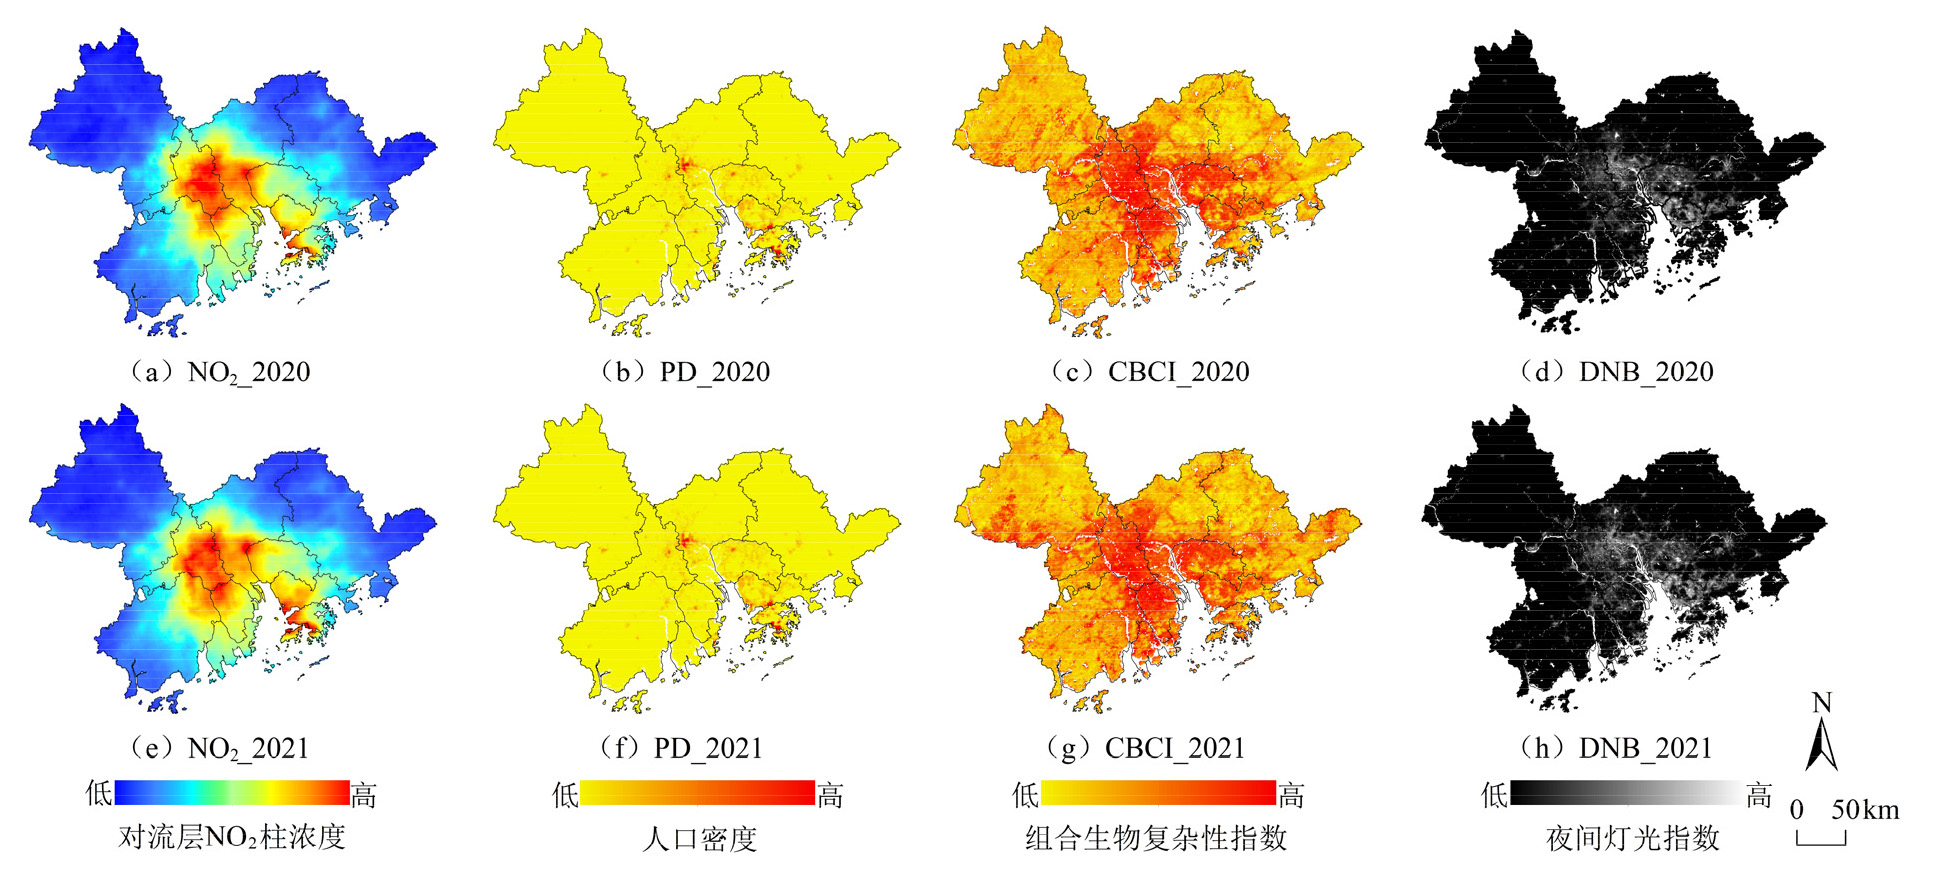
图8 粤港澳大湾区NO2浓度与社会经济因子的空间关联
Figure 8 Spatial correlation between NO2 concentration and socioeconomic factors in GBA
| 年份 | X1 | X2 | X3 | X4 | X5 | X6 | X7 | X8 |
|---|---|---|---|---|---|---|---|---|
| 2019 | 0.684 | 0.672 | 0.297 | 0.603 | 0.183 | 0.466 | 0.444 | 0.167 |
| 2020 | 0.600 | 0.632 | 0.490 | 0.588 | 0.143 | 0.523 | 0.402 | 0.211 |
| 2021 | 0.630 | 0.675 | 0.378 | 0.613 | 0.131 | 0.539 | 0.358 | 0.215 |
| 2022 | 0.638 | 0.665 | 0.194 | 0.611 | 0.114 | 0.513 | 0.488 | 0.249 |
| 2023 | 0.607 | 0.624 | 0.804 | 0.595 | 0.123 | 0.444 | 0.460 | 0.181 |
| 多年均值 | 0.645 | 0.683 | 0.613 | 0.619 | 0.100 | 0.519 | 0.405 | 0.233 |
表3 因子探测逐年q值变化
Table 3 The factor detects the change of q value year by year
| 年份 | X1 | X2 | X3 | X4 | X5 | X6 | X7 | X8 |
|---|---|---|---|---|---|---|---|---|
| 2019 | 0.684 | 0.672 | 0.297 | 0.603 | 0.183 | 0.466 | 0.444 | 0.167 |
| 2020 | 0.600 | 0.632 | 0.490 | 0.588 | 0.143 | 0.523 | 0.402 | 0.211 |
| 2021 | 0.630 | 0.675 | 0.378 | 0.613 | 0.131 | 0.539 | 0.358 | 0.215 |
| 2022 | 0.638 | 0.665 | 0.194 | 0.611 | 0.114 | 0.513 | 0.488 | 0.249 |
| 2023 | 0.607 | 0.624 | 0.804 | 0.595 | 0.123 | 0.444 | 0.460 | 0.181 |
| 多年均值 | 0.645 | 0.683 | 0.613 | 0.619 | 0.100 | 0.519 | 0.405 | 0.233 |
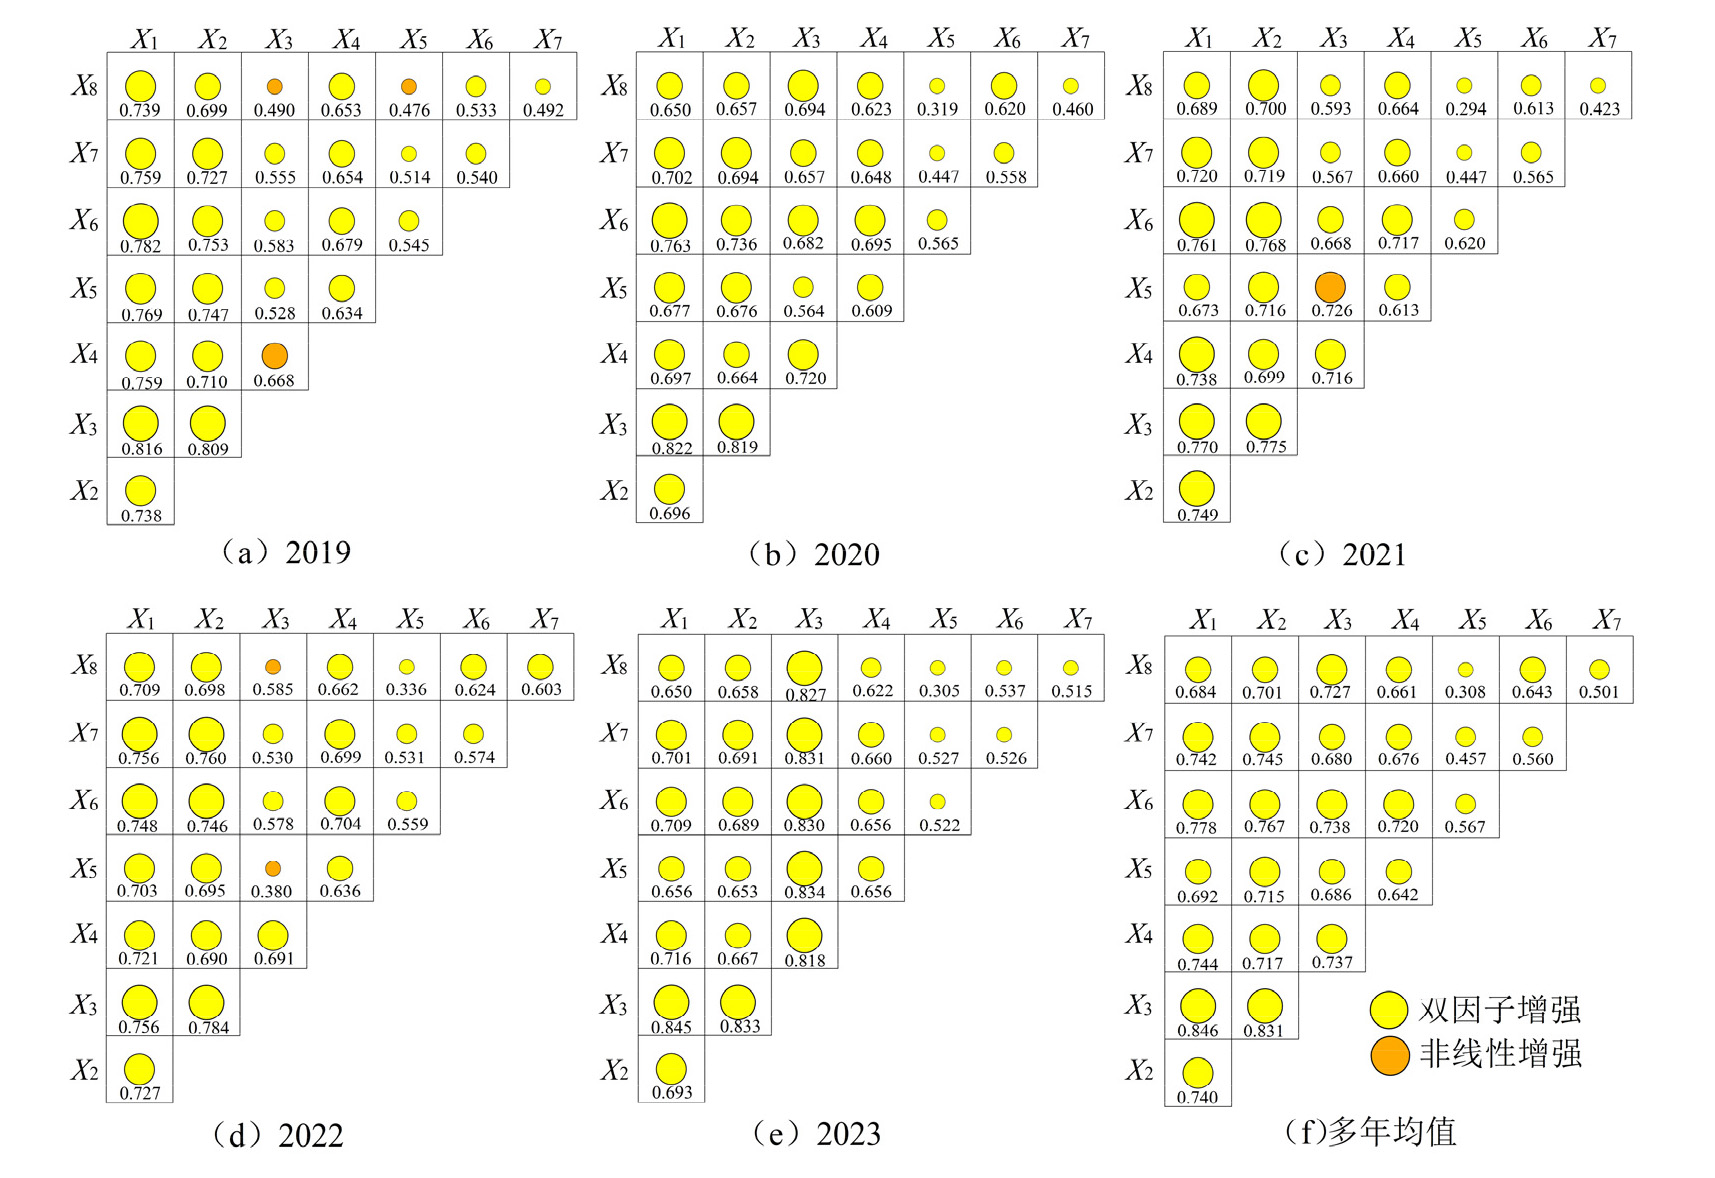
图9 因子交互探测逐年变化图 上述因子含义与2.4.1相同
Figure 9 The factor detects the change of q value year by year
| 因子 | WSD | TEMP | RH | PRE | PRCP | NDVI | LST | DNI |
|---|---|---|---|---|---|---|---|---|
| VIF | 2.02 | 6.60 | 1.40 | 5.44 | 1.34 | 2.43 | 3.07 | 2.28 |
表4 各因子协方差值
Table 4 Covariance of each factor
| 因子 | WSD | TEMP | RH | PRE | PRCP | NDVI | LST | DNI |
|---|---|---|---|---|---|---|---|---|
| VIF | 2.02 | 6.60 | 1.40 | 5.44 | 1.34 | 2.43 | 3.07 | 2.28 |

图10 风速回归系数空间分布图
Figure 10 The spatial distribution map of wind speed regression coefficients
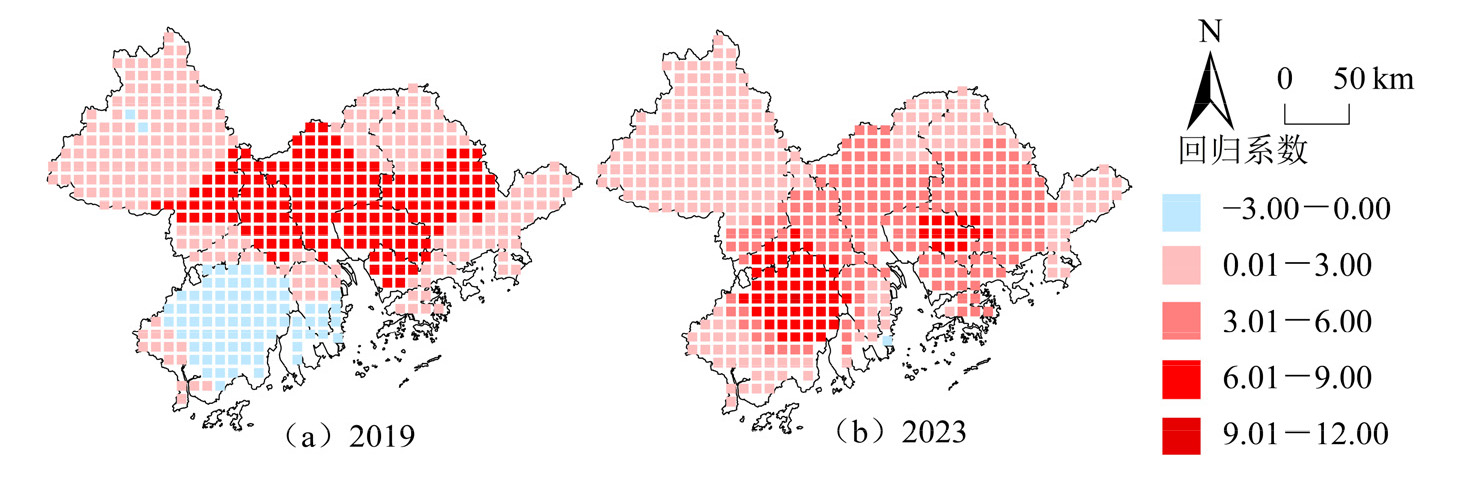
图11 温度回归系数空间分布图
Figure 11 The spatial distribution map of temperature coefficients
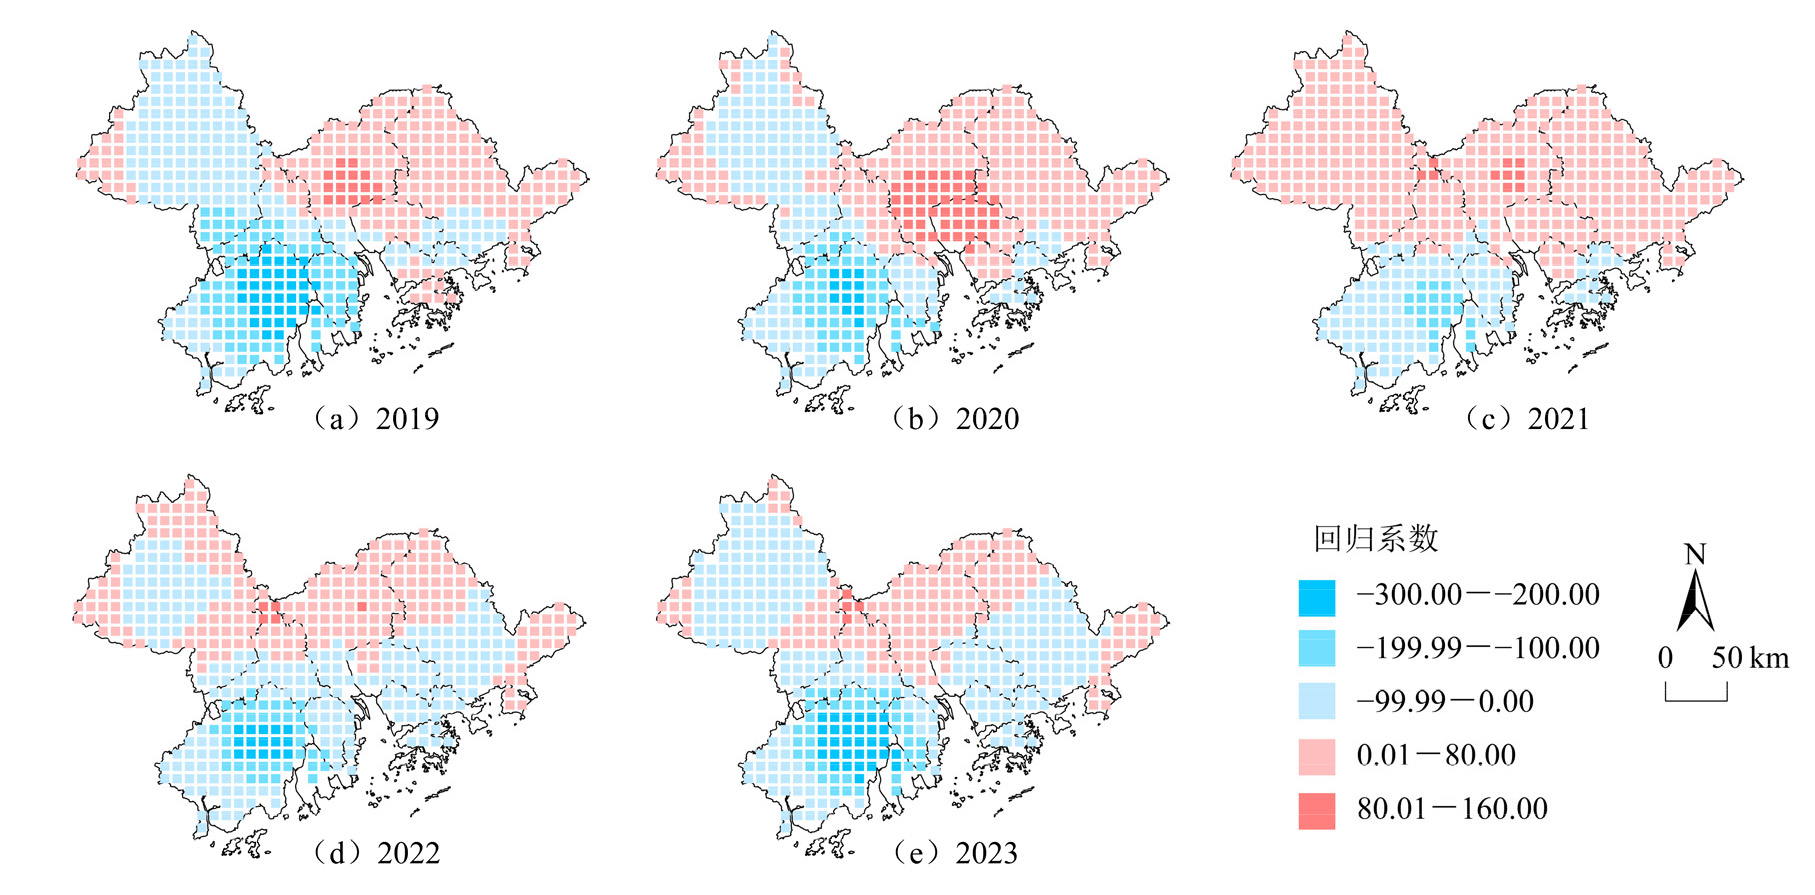
图12 湿度回归系数空间分布图
Figure 12 The spatial distribution map of humidity regression coefficients
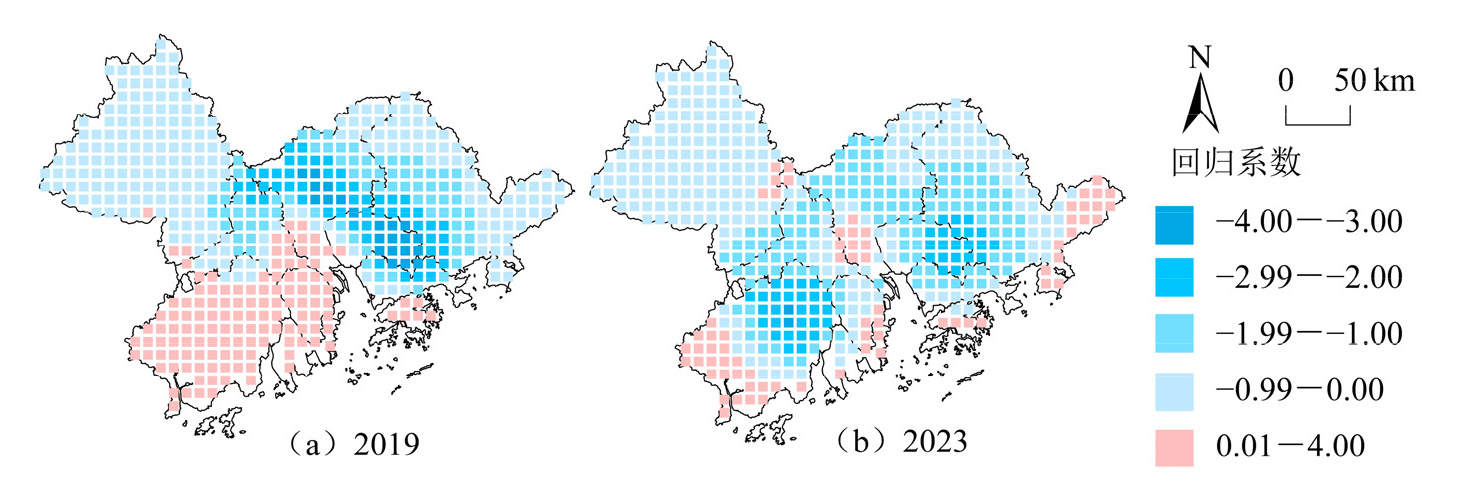
图13 气压回归系数空间分布图
Figure 13 The spatial distribution map of air pressure regression coefficients
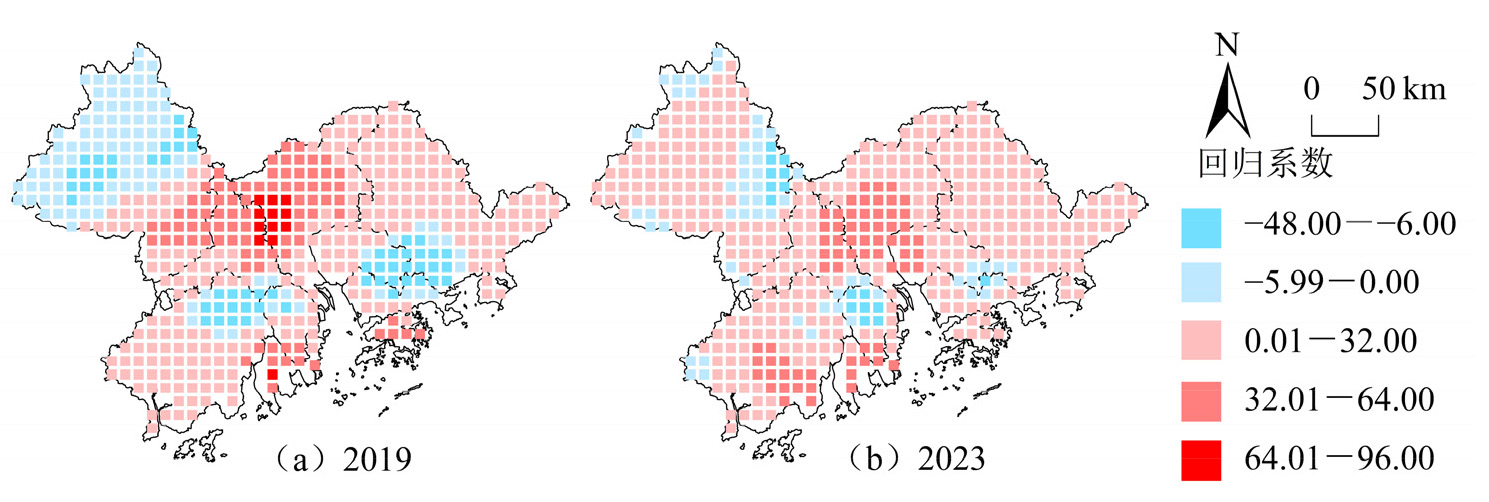
图14 降水回归系数空间分布图
Figure 14 The spatial distribution map of precipitation regression coefficients
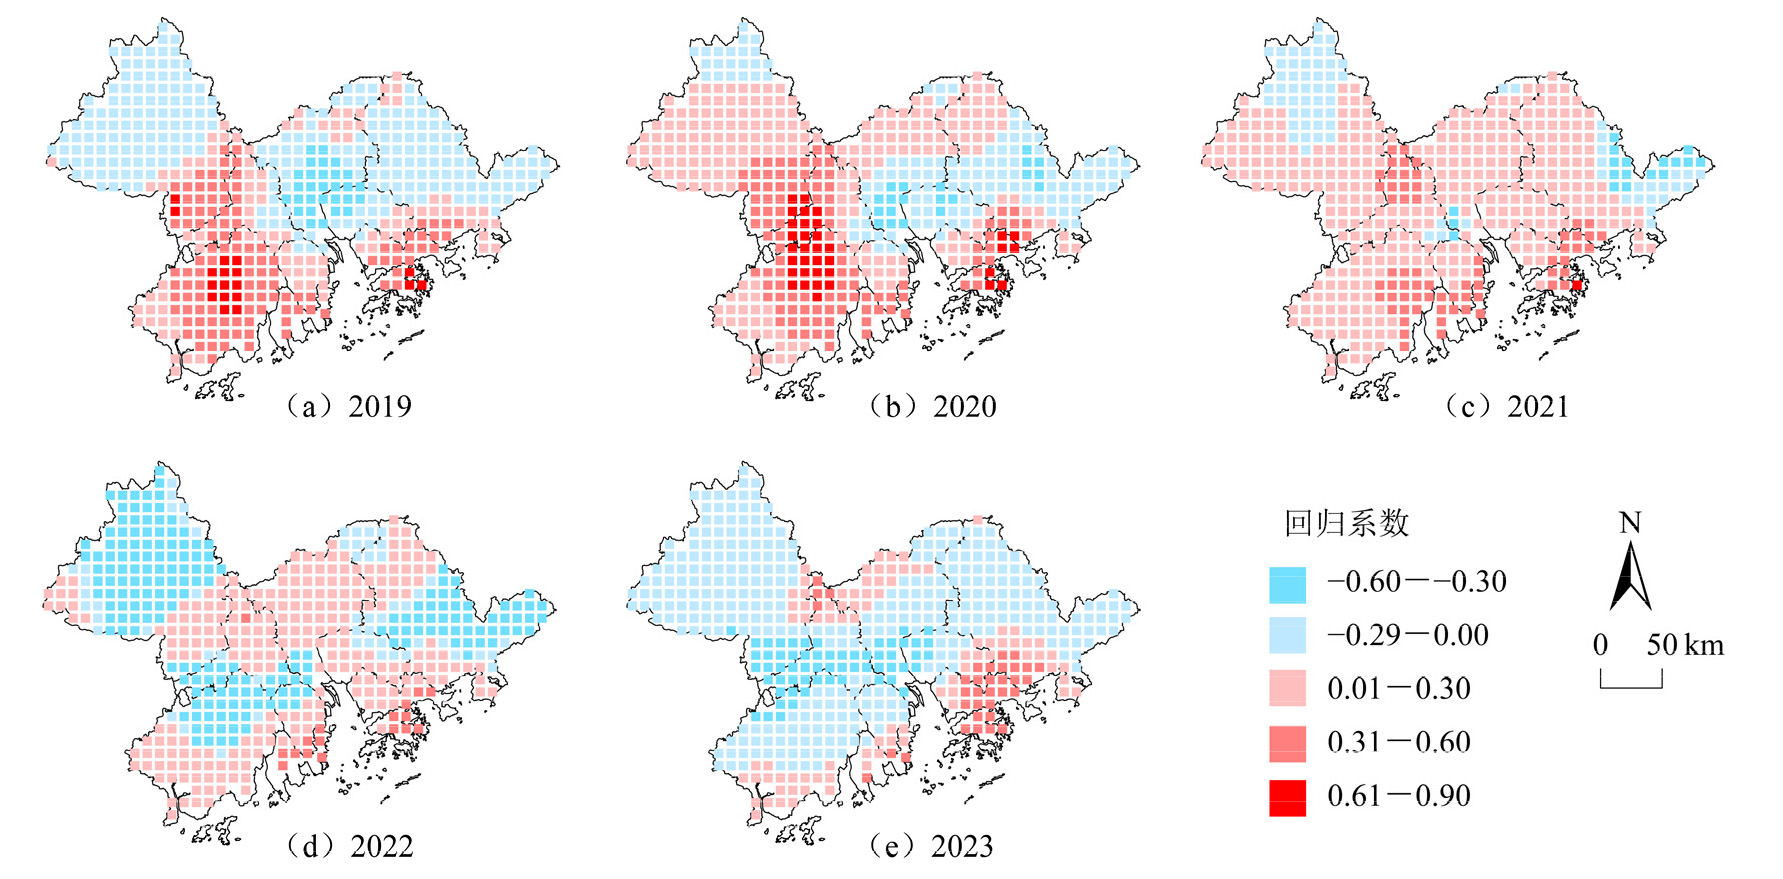
图15 太阳辐射回归系数空间分布图
Figure 15 The spatial distribution map of solar radiation regression coefficients
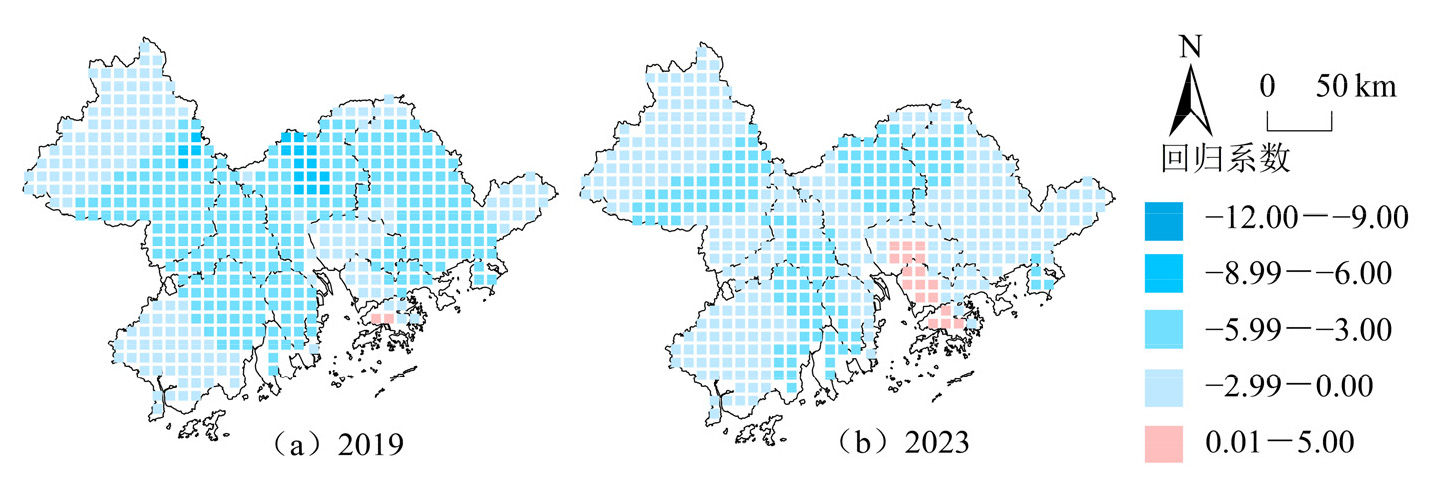
图16 归一化植被指数回归系数空间分布图
Figure 16 The spatial distribution map of normalized vegetation index regression coefficients
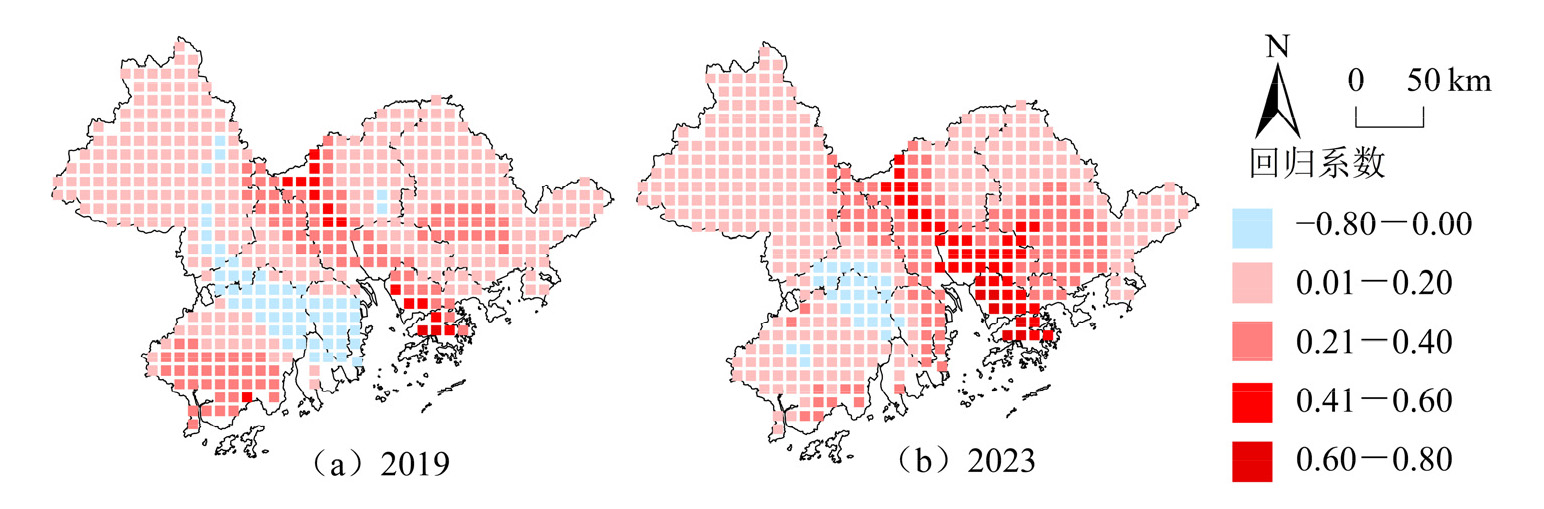
图17 陆表温度回归系数空间分布图
Figure 17 The spatial distribution map of land surface temperature regression coefficients
| [1] | CHEN Z Q, YU B L, YANG C S, et al., 2021. An extended time-series (2000-2018) of global NPP-VIIRS-like nighttime light data from a cross-sensor calibration[J]. Earth System Science Data, 13(3): 889-906. |
| [2] | CHENG S, MA J, CHENG W, 2019. Tropospheric NO2 vertical column densities retrieved from ground-based MAX-DOAS measurements at Shangdianzi regional Atmospheric background station in China[J]. Journal of Environmental Sciences, 80(6): 186-196. |
| [3] | DE FOY B, LU Z F, STREETS D G, 2016. Satellite NO2 retrievals suggest China has exceeded its NOx reduction goals from the Twelfth Five Year Plan[J]. Scientific Reports, 6: 35912. |
| [4] | HUANG B, WU B, BARRY M, 2010. Geographically and temporally weighted regression for modeling spatiotemporal variation in house prices[J]. International Journal of Geographical Information Science, 24(3): 383-401. |
| [5] | KROTKOV N A, MCLINDEN C A, LI C, et al., 2016. Aura OMI observation of regional SO2 and NO2 pollution changes from 2005 to 2015[J]. Atmospheric Chemistry & Physics, 16(7): 4605-4629. |
| [6] | MÜLLER I, ERBERTSEDER T, TAUBENBÖCK H, 2022. Tropospheric NO2: Explorative analyses of spatial variability and impact factors[J]. Remote Sensing of Environment, 270: 112839. |
| [7] | PRASAD L V N, REDDY C K K, DEPURU S R, 2015. Satellite derived pH estimation for acidity in precipitation using water vapor and nitrogen dioxide imagery[J]. Procedia Computer Science, 62: 637-648. |
| [8] | QI L, FU A Q, DUAN X L, 2022. Excess deaths associated with long-term exposure to ambient NO2 in China[J]. Environmental Research Letters, 17(12): 124018. |
| [9] | RAHMAN G, DAWOOD M, 2017. Spatio-statistical analysis of temperature fluctuation using Mann-Kendall and Sen’s slope approach[J]. Climate Dynamics, 48(3-4): 783-797. |
| [10] | TOENGES-SCHULLER N, STEIN O, ROHRER F, et al., 2006. Global distribution pattern of anthropogenic nitrogen oxide emissions: Correlation analysis of satellite measurements and model calculations[J]. Journal of Geophysical Research: Atmospheres, 111(D5): 1-15 |
| [11] | SEN P K, 1968. Estimates of the regression coefficient based on Kendall’s Tau[J]. Journal of the American Statistical Association, 63(324): 1379-1389. |
| [12] | VAN DER A R J, PETERS D, ESKES H, et al., 2006. Detection of the trend and seasonal variation in tropospheric NO2 over China[J]. Journal of Geophysical Research, 111(D12): D12317. |
| [13] | VELDERS G J M, GRANIER C, PORTMANN R W, et al., 2001. Global tropospheric NO2 column distributions: Comparing three-dimensional model calculations with GOME measurements[J]. Journal of Geophysical Research: Atmospheres, 106(D12): 12643-12660. |
| [14] | WAGNER T, BEIRLE S, BRAUERS T, et al., 2011. Inversion of tropospheric profiles of aerosol extinction and HCHO and NO2 mixing ratios from MAX-DOAS observations in Milano during the summer of 2003 and comparison with independent data sets[J]. Atmospheric Measurement Techniques Discussions, 4(12): 2685-2715. |
| [15] | WALTER A L, RUDOLPH B H, 1976. SMS/GOES visible images detect a synoptic-scale air pollution episode[J]. Monthly Review, 104(22): 1623-1626. |
| [16] | WANG N, XU J W, PEI C L, et al., 2021. Air Quality During COVID-19 lockdown in the Yangtze River Delta and the Pearl River Delta: Two different responsive mechanisms to emission reductions in China[J]. Environmental Science & Technology, 55(9): 5721-5730. |
| [17] | XIANG Y C, ZHANG L Y, MAO X Z, et al., 2014. Relationship between NO2 concentration and meteorological factors in the urban area of Wanzhou District[J]. Meteorological and Environmental Research, 5(3): 22-25. |
| [18] | YANG G, ZHAO Y L, XING H F, et al., 2020. Understanding the changes in spatial fairness of urban greenery using time series remote sensing images: A case study of Guangdong-Hong Kong-Macao Greater Bay[J]. Cities, 715: 136763. |
| [19] | ZHANG G X, HAN J L, SU B, 2023. Contributions of cleaner production and end-of-pipe treatment to NOx emissions and intensity reductions in China, 1997-2018[J]. Journal of Environmental Management, 326(Part B): 116822. |
| [20] | ZHANG S H, YANG K, LI M C, et al., 2018. Combinational biophysical composition index (CBCI) for effective mapping biophysical composition in urban areas[J]. IEEE Access, 6: 41224-41237. |
| [21] | ZHANG Y J, GAO J, ZHU Y J, et al., 2023. Evolution of ozone formation sensitivity during a persistent regional ozone episode in northeastern China and its implication for a control strategy[J]. Environmental Science & Technology, 58(1): 617-627. |
| [22] | 蔡文博, 韩宝龙, 逯非, 等, 2020. 全球四大湾区生态环境综合评价研究[J]. 生态学报, 40(23): 8392-8402. |
| CAI W B, HAN B L, LU F, et al., 2020. Comprehensive evaluation of the eco-environment in the four global bay areas[J]. Acta Ecologica Sinica, 40(23): 8392-8402. | |
| [23] | 陈婉莹, 陈懿昂, 褚旸晰, 等, 2022. 珠三角地区臭氧来源特征的数值模拟研究[J]. 环境科学学报, 42(3): 293-308. |
| CHEN W Y, CHEN Y A, CHU Y X, et al., 2022. Numerical simulation of ozone source characteristics in the Pearl River Delta region[J]. Acta Scientiae Circumstantiae, 42(3): 293-308. | |
| [24] |
顾芳婷, 胡敏, 郑竞, 等, 2017. 大气颗粒物中有机硝酸酯的研究进展[J]. 化学进展, 29(9): 962-969.
DOI |
|
GU F T, HU M, ZHENG J, et al., 2017. Research progress on particulate organonitrates[J]. Progress in Chemistry, 29(9): 962-969.
DOI |
|
| [25] |
姜建芳, 侯丽丽, 王鑫龙, 等, 2019. 中国近地面NO2污染分布特征及其社会经济影响因素分析[J]. 生态环境学报, 28(8): 1632-1641.
DOI |
| JIANG J F, HOU L L, WANG X L, et al., 2019. Spatial analysis of ground-level NO2 in China and its socio-economic factors[J]. Ecology and Environmental Sciences, 28(8): 1632-1641. | |
| [26] | 李秋芳, 刘翠棉, 丁学英, 等, 2022. 石家庄市NO2时空分布特征及影响因素[J]. 中国环境监测, 38(3): 62-73. |
| LI Q F, LIU C M, DING X Y, et al., 2022. Temporal and spatial distribution characteristics and influencing factors of NO2 in Shijiazhuang[J]. Environmental Monitoring in China, 38(3): 62-73. | |
| [27] |
梁秀娟, 王旭红, 牛林芝, 等, 2020. 大西安都市圈城市热岛效应时空分布特征及AOD对热岛强度的影响研究[J]. 生态环境学报, 29(8): 1566-1580.
DOI |
| LIANG X J, WANG X H, NIU L Z, et al., 2020. Research on the temporal and spatial distribution characteristics of urban heat island effect and the influence of AOD on urban heat island intensity in the greater Xi’an metropolitan area[J]. Ecology and Environmental Sciences, 29(8): 1566-1580. | |
| [28] | 梁勇歌, 2023. 西安市环境空气质量污染变化特征与影响因素研究[J]. 广东化工, 50(14): 151-153, 157. |
| LIANG Y G, 2023. Study on the change characteristics and influencing factors of ambient air quality pollution in Xi’an[J]. Guangdong Chemical Industry, 50(14): 151-153, 157. | |
| [29] | 刘显通, 郑腾飞, 万齐林, 等, 2015. OMI遥感珠三角城市群NO2的时空分布特征及人类活动影响分析[J]. 热带气象学报, 31(2): 193-201. |
| LIU X T, ZHENG T F, WAN Q L, et al., 2015. Spatio-temporal characteristics of NO2 in concentrated PRD urban districts and analysis of anthropogenic influences based on OMI remote sensing data[J]. Journal of Tropical Meteorology, 31(2): 193-201. | |
| [30] | 刘怡阳, 颉耀文, 郭泽呈, 2022. 基于Sentinel-5P卫星的中国NO2浓度遥感监测[J]. 中国环境科学, 42(11): 4983-4990. |
| LIU Y Y, XIE Y W, GUO Z C, 2022. Monitoring atmospheric NO2 concentrations in China based on Sentinel-5P satellite products[J]. China Environmental Science, 42(11): 4983-4990. | |
| [31] |
王劲峰, 徐成东, 2017. 地理探测器: 原理与展望[J]. 地理学报, 72(1): 116-134.
DOI |
| WANG J F, XU C D, 2017. Geographical detector: Principles and prospects[J]. Journal of Geographical Sciences, 72(1): 116-134. | |
| [32] | 王耀庭, 殷振平, 郑祚芳, 等, 2022. 基于长时序 “地-星” 数据的京津冀大气污染时空分布及演变特征[J]. 环境科学, 43(7): 3508-3522. |
| WANG Y T, YIN Z P, ZHENG Z F, et al., 2022. Spatial-temporal distribution and evolution characteristics of air pollution in Beijing-Tianjin Hebei Region based on long-term “ground-satellite” data[J]. Environmental Science, 43(7): 3508-3522. | |
| [33] | 肖钟湧, 谢先全, 陈颖锋, 等, 2020. 粤港澳大湾区NO2污染的时空特征及影响因素分析[J]. 中国环境科学, 40(5): 2010-2017. |
| XIAO Z Y, XIE X Q, CHEN Y F, et al., 2020. Temporal and spatial characteristics and influencing factors of NO2 pollution over Guangdong-Hongkong-Macao Great Bay area, China[J]. China Environmental Science, 40(5): 2010-2017. | |
| [34] | 张洪飞, 杜宁, 王莉, 等, 2024. 基于Catboost模型的广东省近地面NO2浓度估算[J]. 环境科学, 45(11): 6276-6285. |
| ZHANG H F, DU N, WANG L, et al., 2024. Estimation of near-surface NO2 concentration in Guangdong Province based on Catboost model[J]. Environmental Science, 45(11): 6276-6285. | |
| [35] | 张燕, 2021. 粤港澳大湾区与纽约、旧金山及东京国际一流湾区影响力比较[J]. 全球化 (4): 57-70, 135. |
| ZHANG Y, 2021. A Comparison of the Influence of the Guangdong-Hong Kong-Macao Greater Bay Area with International First-Class Bay Areas: New York, San Francisco, and Tokyo[J]. Globalization (4): 57-70, 135. | |
| [36] | 赵冉, 张成歆, 吴跃, 等, 2021. 基于EMI观测华北平原对流层NO2的时空变化研究[J]. 大气与环境光学学报, 16(3): 186-196. |
| ZHAO R, ZHANG C X, WU Y, et al., 2021. Analysis of spatio-temporal variations of tropospheric nitrogen dioxide in the North China Plain based on EMI[J]. Journal of Atmospheric and Environmental Optics, 16(3): 186-196. |
| [1] | 翁雷霆, 王鹏, 肖荣波, 白晋晶, 钟俊宏. 2000-2022年珠三角城市群PM2.5与O3时空分布特征及其影响因素[J]. 生态环境学报, 2025, 34(2): 268-278. |
| [2] | 尤琪, 杨艺, 张寅清, 祝凌燕. 纳米银颗粒在水环境中的化学转化及影响因素[J]. 生态环境学报, 2025, 34(1): 156-166. |
| [3] | 王雪融, 龚建周, 俞方圆. 粤港澳大湾区4种生态系统调节服务的互馈关系及机制[J]. 生态环境学报, 2024, 33(7): 1130-1141. |
| [4] | 张维琛, 王惺琪, 王博杰. 塔布河流域生态系统服务时空格局及影响因素分析[J]. 生态环境学报, 2024, 33(7): 1142-1152. |
| [5] | 李程, 程志鹏, 刘育金, 姚义鸣, 李春雷. 全(多)氟烷基化合物生态风险及其管控政策研究[J]. 生态环境学报, 2024, 33(6): 980-996. |
| [6] | 张淼, 王桂霞, 王昌伟, 贺艳云, 许艳芳, 李琪, 许杨, 张俊骁, 张桂芹. 济南市区黑碳污染变化特征及来源解析[J]. 生态环境学报, 2024, 33(4): 560-572. |
| [7] | 梁燕, 刘家齐, 肖凡, 潘民萍, 韦凯文, 张楚雯, 段敏. 氮沉降形态对西南岩溶区森林土壤有效磷来源的影响[J]. 生态环境学报, 2024, 33(2): 192-201. |
| [8] | 罗小玲, 刘军, 王琦, 刘同旭, 梁耀杰, 谢志宜, 王中伟, 陈多宏. 2016年以来广东省不同土地利用类型土壤pH和有机质时空变化及其影响因素分析[J]. 生态环境学报, 2024, 33(12): 1849-1861. |
| [9] | 袁茜, 傅开道, 陶雨晨, 张年, 杨丽莎. 澜沧江(云南段)水-气界面氧化亚氮释放通量时空分布特征及其影响因素研究[J]. 生态环境学报, 2024, 33(1): 54-61. |
| [10] | 王超, 杨倩楠, 张池, 刘同旭, 张晓龙, 陈静, 刘科学. 丹霞山不同土地利用方式土壤磷组分特征及其有效性[J]. 生态环境学报, 2023, 32(5): 889-897. |
| [11] | 李建辉, 党争, 陈琳. 黄河几字弯都市圈PM2.5时空特征及影响因素分析[J]. 生态环境学报, 2023, 32(4): 697-705. |
| [12] | 何艳虎, 龚镇杰, 吴海彬, 蔡宴朋, 杨志峰, 陈晓宏. 粤港澳大湾区城市生态效率时空演变及影响因素[J]. 生态环境学报, 2023, 32(3): 469-480. |
| [13] | 郝金虎, 韦玮, 李胜男, 马牧源, 李肖夏, 杨洪国, 姜琦宇, 柴沛东. 基于GEE平台的京津冀长时序水体时空格局及其影响因素[J]. 生态环境学报, 2023, 32(3): 556-566. |
| [14] | 张林, 齐实, 周飘, 伍冰晨, 张岱, 张岩. 北京山区针阔混交林地土壤有机碳含量的影响因素研究[J]. 生态环境学报, 2023, 32(3): 450-458. |
| [15] | 张莉, 李铖, 谭皓泽, 韦家怡, 程炯, 彭桂香. 广州典型城市林地对大气颗粒物的削减效应及影响因素[J]. 生态环境学报, 2023, 32(2): 341-350. |
| 阅读次数 | ||||||
|
全文 |
|
|||||
|
摘要 |
|
|||||