生态环境学报 ›› 2023, Vol. 32 ›› Issue (5): 943-955.DOI: 10.16258/j.cnki.1674-5906.2023.05.012
张钧韦( ), 夏圣洁, 陈慧儒, 刘艳红*()
收稿日期:2023-02-21
出版日期:2023-05-18
发布日期:2023-08-09
通讯作者:
*刘艳红(1978年生),女,副教授,博士,硕士研究生导师,研究方向为城市景观生态规划、风景园林规划设计。E-mail: liuyhwqs@163.com作者简介:张钧韦(1998年生),女,硕士研究生,研究方向为城乡人居环境景观规划与生态设计。E-mail: 15034685951@163.com
基金资助:
ZHANG Junwei(), XIA Shengjie, CHEN Huiru, LIU Yanhong*()
Received:2023-02-21
Online:2023-05-18
Published:2023-08-09
摘要:
城市群化使得城市热环境问题变得更为复杂。以2010-2020年4期Landsat影像数据为基础,运用空间分析、景观格局指数与数理统计等方法,分析山西中部城市群景观格局动态演变和热环境分布及变化特征,并定量探究城市群景观格局演变对其热环境的影响作用。研究表明,(1)近10年来山西省中部城市群的建设用地逐年增加,在空间分布上均有向太原市偏移的趋势。(2)研究区地表温度总体呈上升趋势,城市群热岛效应逐渐显现,2013-2016年,高温区重心向东北方移动30.03 km,转移至太原市中轴线偏北方位置,各城市间热环境的连通性加强。(3)城市群的景观格局演变对其热环境有着明显的影响:①各景观类型中建设用地、耕地及草地热环境贡献指数较高,林地与水体贡献指数为负,其中林地贡献值为-0.975,贡献指数绝对值最大;②从景观格局指数来看,在类型水平上,林地的聚集度指数、平均分布斑块面积、最大斑块所占景观面积比例、景观类型比例与地表温度(LST)呈负相关,斑块密度、边缘密度与LST呈正相关,而在景观水平上,景观形状指数、斑块密度、香浓均匀度指数等与LST呈正相关,2013年各相关系数最大,不同景观类型的结构组分与空间构型越复杂,景观格局对LST的影响越强;③反映城市群绿地景观格局的等绿线与对应区域等温线双变量空间自相关呈显著负相关性,空间集聚类型以“低-高”聚集和“高-低”集聚为主,“高-高”聚集区主要分布于建设用地区域,“低-低”聚集区位于绿地景观聚集区域。该研究为城市群发展规划和城市群热环境改善提供了理论参考。
中图分类号:
张钧韦, 夏圣洁, 陈慧儒, 刘艳红. 山西中部城市群景观格局演变对其热环境的影响研究[J]. 生态环境学报, 2023, 32(5): 943-955.
ZHANG Junwei, XIA Shengjie, CHEN Huiru, LIU Yanhong. Influence of Landscape Pattern Evolution on Thermal Environment of Urban Agglomerations in Central Shanxi Province[J]. Ecology and Environment, 2023, 32(5): 943-955.
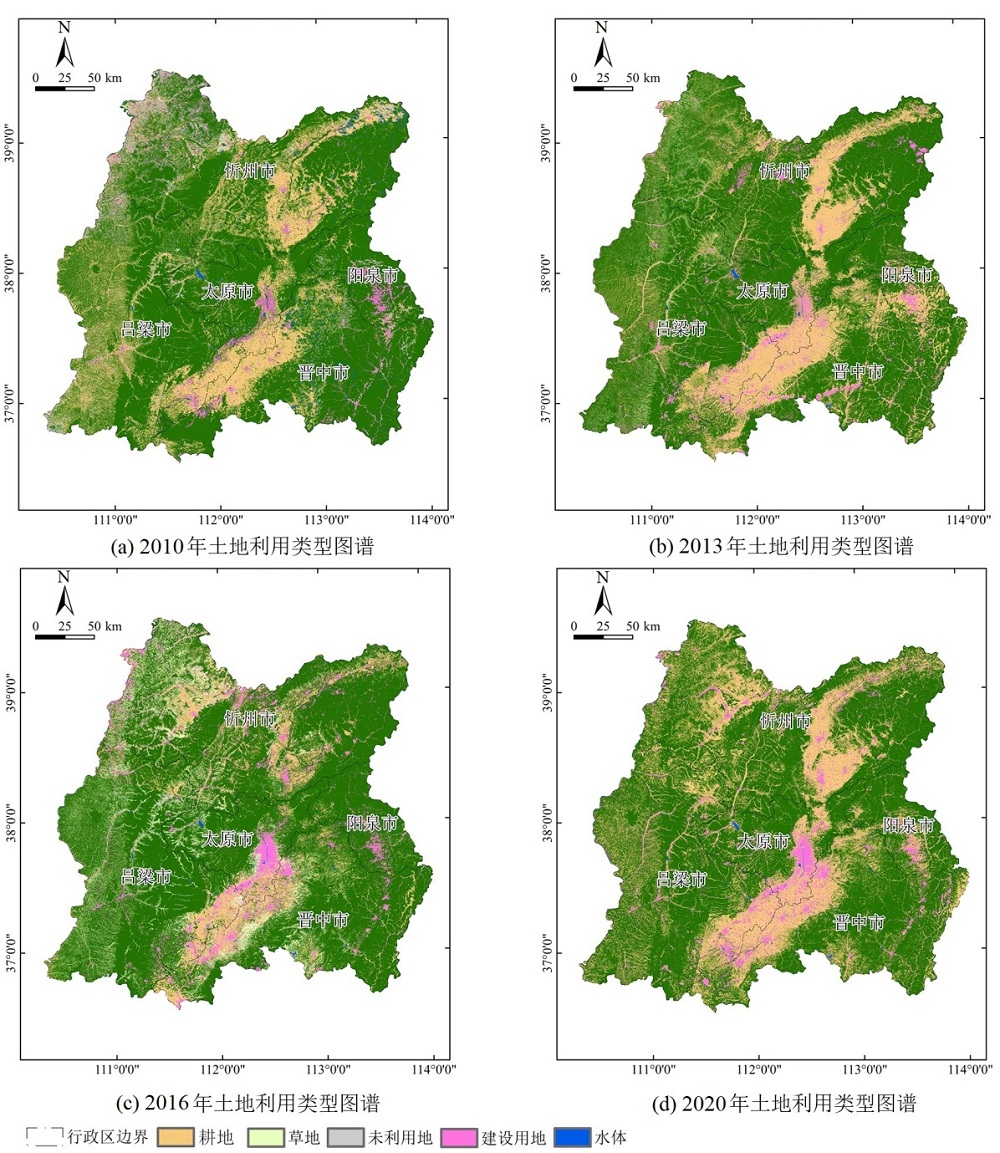
图1 2010-2020年土地利用类型图谱
Figure 1 Map of land use types from 2010 to 2020
| 温度等级 | 热环境划分区间1) |
|---|---|
| 高温区 | t>u+s |
| 次高温区 | u+0.5s<t≤u+s |
| 中温区 | u-0.5s≤t≤u+0.5s |
| 次低温区 | u-s≤t<u-0.5s |
| 低温区 | t<u-s |
表1 均值与标准差法划分地表温度等级
Table 1 Classification of LST by mean and standard deviation method
| 温度等级 | 热环境划分区间1) |
|---|---|
| 高温区 | t>u+s |
| 次高温区 | u+0.5s<t≤u+s |
| 中温区 | u-0.5s≤t≤u+0.5s |
| 次低温区 | u-s≤t<u-0.5s |
| 低温区 | t<u-s |
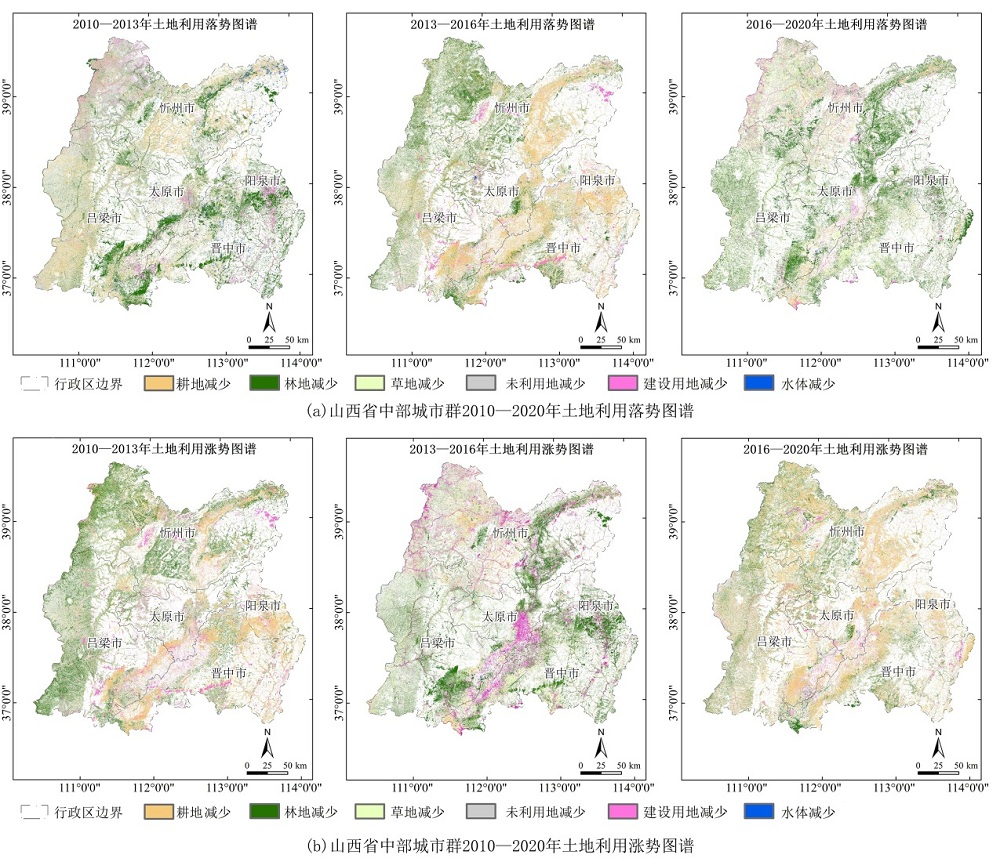
图2 2010-2020年土地利用类型涨落势图谱
Figure 2 2010-2020 Land use type fluctuation trend map
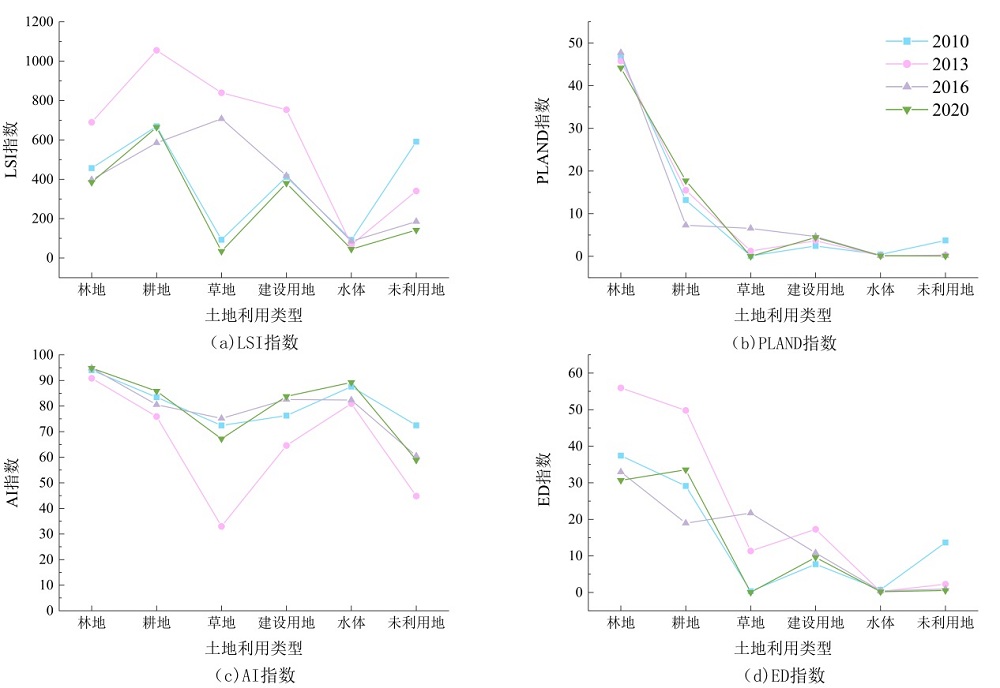
图3 2010-2020年土地利用类型景观格局指数变化
Figure 3 Change of landscape pattern index of land use type from 2010 to 2020
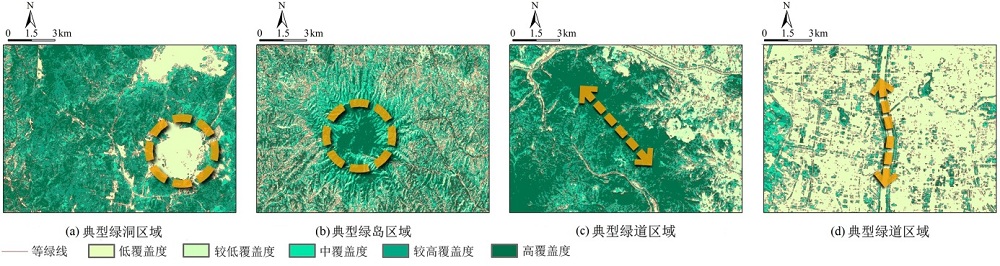
图4 山西省中部城市群绿地景观特殊特征区域植被覆盖度
Figure 4 Special characteristics of green landscape in urban agglomeration of central Shanxi Province
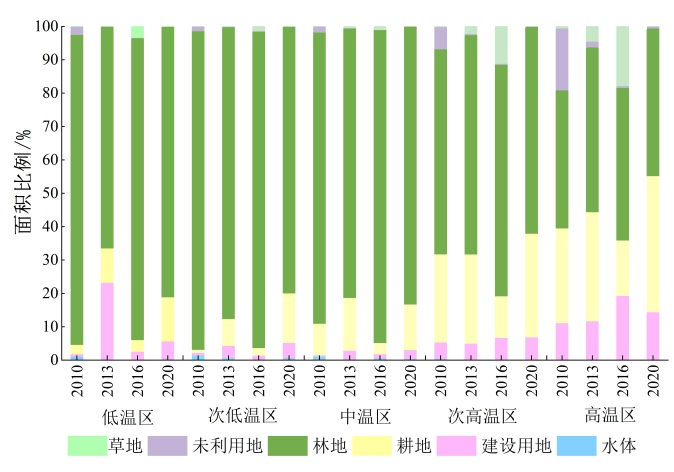
图5 2010-2020年各热力等级的景观类型比例
Figure 5 Proportion of landscape types for each thermal class from 2010 to 2020
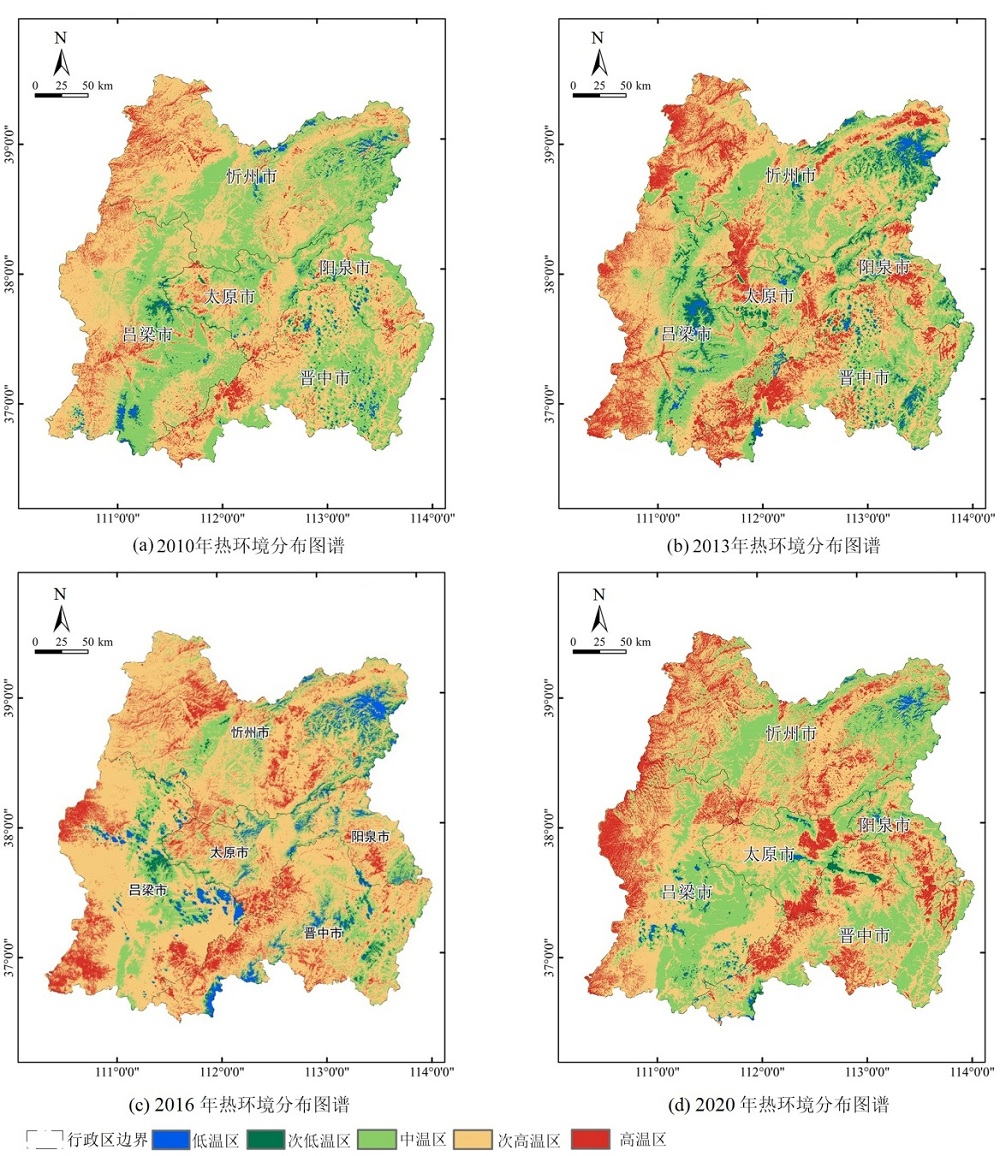
图6 2010-2020年城市群热环境分布图谱
Figure 6 Distribution map of thermal environment in urban agglomerations from 2010 to 2020
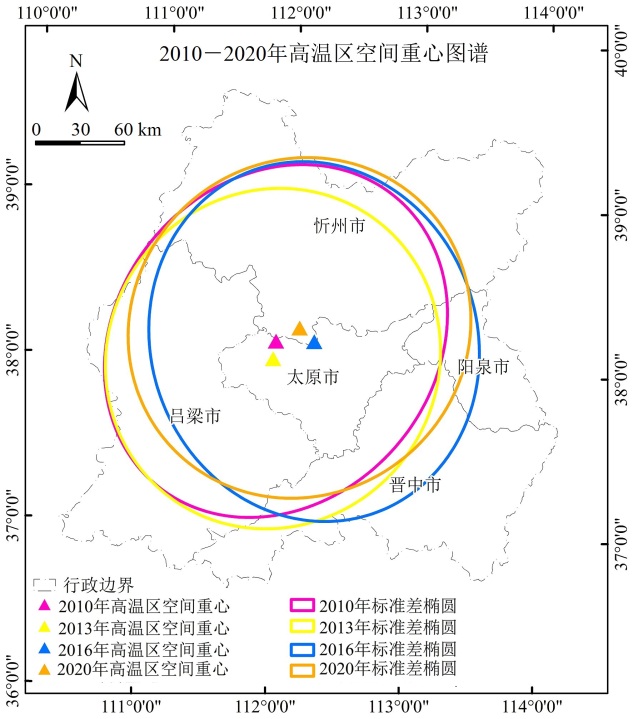
图7 2010-2020年城市群高温区空间重心转移图谱
Figure 7 Shift map of spatial center of gravity in high temperature areas of urban agglomerations from 2010 to 2020
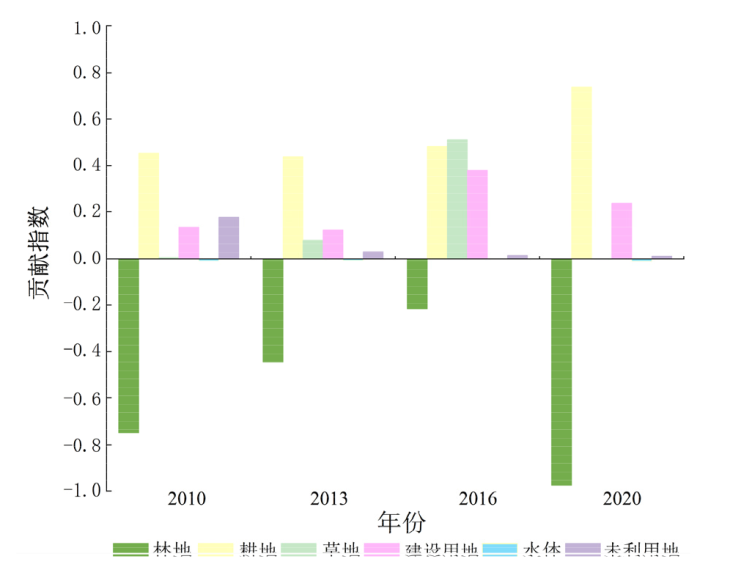
图8 2010-2020各景观类型热环境贡献指数
Figure 8 The thermal environment contribution index of each landscape type from 2010 to 2020
| 年份 | 景观指数1) | 林地 | 耕地 | 草地 | 建设用地 | 水体 | |||||||||
|---|---|---|---|---|---|---|---|---|---|---|---|---|---|---|---|
| 平均值 | 相关系数 | 平均值 | 相关系数 | 平均值 | 相关系数 | 平均值 | 相关系数 | 平均值 | 相关系数 | ||||||
| 2010 | AI | 79.8 | -0.526** | 50.8 | 0.035** | 51.3 | -0.036 | 47.9 | -0.110** | 75.9 | 0.001 | ||||
| Area-Mean | 24.6 | -0.536** | 6.82 | 0.216** | 1.44 | 0.077** | 2.59 | 0.130** | 3.58 | -0.037** | |||||
| ED | 34.8 | 0.564** | 36.1 | 0.372** | 11.7 | 0.124** | 19.3 | 0.259** | 14.8 | -0.035** | |||||
| LPI | 66.7 | -0.512** | 21.4 | 0.258** | 3.94 | 0.090** | 7.76 | 0.153** | 9.49 | -0.042** | |||||
| LSI | 1.58 | 0.563** | 1.66 | 0.388** | 1.11 | 0.113** | 1.30 | 0.276** | 1.14 | -0.040** | |||||
| PD | 4.06 | 0.456** | 5.25 | 0.337** | 3.01 | 0.125** | 3.94 | 0.288** | 2.91 | -0.082** | |||||
| PLAND | 69.4 | -0.502** | 25.2 | 0.302** | 4.45 | 0.104** | 2.59 | 0.130** | 9.95 | -0.048** | |||||
| 2013 | AI | 78.9 | -0.377** | 42.6 | 0.112** | 15.9 | -0.033** | 33.5 | -0.132** | 59.9 | -0.061** | ||||
| Area-Mean | 57.6 | -0.385** | 13.3 | 0.134** | 1.15 | 0.134** | 2.97 | -0.028** | 2.62 | -0.068** | |||||
| ED | 37.1 | 0.480** | 34.6 | 0.450** | 14.4 | 0.214** | 15.1 | 0.235** | 5.76 | -0.02 | |||||
| LPI | 66.1 | -0.348** | 19.5 | 0.206** | 1.97 | 0.155** | 4.78 | 0.035** | 2.89 | -0.096** | |||||
| LSI | 2.05 | 0.493** | 2.32 | 0.464** | 1.65 | 0.235** | 1.62 | 0.267** | 1.12 | 0.013 | |||||
| PD | 1.99 | 0.299** | 3.86 | 0.342** | 3.06 | 0.176** | 2.55 | 0.290** | 1.21 | 0.053* | |||||
| PLAND | 68.4 | -0.343** | 24.0 | 0.273** | 4.36 | 0.129** | 6.76 | 0.121** | 3.11 | -0.059** | |||||
| 2016 | AI | 82.3 | -0.181** | 40.1 | -0.008 | 40.5 | -0.035** | 48.4 | -0.048** | 59.7 | 0.021 | ||||
| Area-Mean | 59.2 | -0.191** | 6.32 | 0.044** | 3.78 | -0.009 | 4.95 | 0.046** | 3.14 | -0.018 | |||||
| ED | 33.4 | 0.243** | 23.8 | 0.115** | 26.8 | 0.137** | 15.6 | 0.100** | 7.70 | -0.016 | |||||
| LPI | 68.3 | -0.170** | 10.4 | 0.063** | 7.76 | 0.044** | 7.37 | 0.061** | 3.54 | -0.023 | |||||
| LSI | 1.53 | 0.107** | 1.93 | 0.128** | 2.28 | 0.128** | 1.24 | 0.002 | 1.13 | -0.176** | |||||
| PD | 2.07 | 0.159** | 3.13 | 0.119** | 3.57 | 0.150** | 2.27 | 0.110** | 1.34 | -0.038** | |||||
| PLAND | 13.8 | -0.164** | 13.8 | 0.081** | 12.1 | 0.082** | 9.26 | 0.073** | 3.95 | -0.028* | |||||
| 2020 | AI | 80.2 | -0.220** | 53.5 | 0.126** | 47.2 | 0.042 | 51.41 | -0.014** | 76.7 | -0.031 | ||||
| Area-Mean | 53.1 | -0.253** | 14.2 | 0.147** | 1.31 | -0.136** | 4.95 | 0.050** | 5.92 | -0.122** | |||||
| ED | 32.9 | 0.221** | 35.8 | 0.248** | 5.43 | -0.145** | 14.5 | 0.129** | 9.19 | 0.013 | |||||
| LPI | 62.8 | -0.230** | 22.0 | 0.189** | 1.52 | -0.149** | 7.20 | 0.070** | 6.38 | -0.102** | |||||
| LSI | 1.93 | 0.235** | 2.28 | 0.230** | 1.13 | -0.145** | 1.53 | 0.137** | 1.24 | 0.054** | |||||
| PD | 2.08 | 0.190** | 3.47 | 0.140** | 1.31 | -0.148** | 2.12 | 0.135** | 1.18 | -0.013 | |||||
| PLAND | 66.0 | -0.221** | 26.9 | 0.217** | 1.84 | -0.159** | 8.94 | 0.085** | 6.63 | -0.104** | |||||
表2 类型层面景观指数与LST的相关性
Table 2 Correlation between landscape index at type level and LST
| 年份 | 景观指数1) | 林地 | 耕地 | 草地 | 建设用地 | 水体 | |||||||||
|---|---|---|---|---|---|---|---|---|---|---|---|---|---|---|---|
| 平均值 | 相关系数 | 平均值 | 相关系数 | 平均值 | 相关系数 | 平均值 | 相关系数 | 平均值 | 相关系数 | ||||||
| 2010 | AI | 79.8 | -0.526** | 50.8 | 0.035** | 51.3 | -0.036 | 47.9 | -0.110** | 75.9 | 0.001 | ||||
| Area-Mean | 24.6 | -0.536** | 6.82 | 0.216** | 1.44 | 0.077** | 2.59 | 0.130** | 3.58 | -0.037** | |||||
| ED | 34.8 | 0.564** | 36.1 | 0.372** | 11.7 | 0.124** | 19.3 | 0.259** | 14.8 | -0.035** | |||||
| LPI | 66.7 | -0.512** | 21.4 | 0.258** | 3.94 | 0.090** | 7.76 | 0.153** | 9.49 | -0.042** | |||||
| LSI | 1.58 | 0.563** | 1.66 | 0.388** | 1.11 | 0.113** | 1.30 | 0.276** | 1.14 | -0.040** | |||||
| PD | 4.06 | 0.456** | 5.25 | 0.337** | 3.01 | 0.125** | 3.94 | 0.288** | 2.91 | -0.082** | |||||
| PLAND | 69.4 | -0.502** | 25.2 | 0.302** | 4.45 | 0.104** | 2.59 | 0.130** | 9.95 | -0.048** | |||||
| 2013 | AI | 78.9 | -0.377** | 42.6 | 0.112** | 15.9 | -0.033** | 33.5 | -0.132** | 59.9 | -0.061** | ||||
| Area-Mean | 57.6 | -0.385** | 13.3 | 0.134** | 1.15 | 0.134** | 2.97 | -0.028** | 2.62 | -0.068** | |||||
| ED | 37.1 | 0.480** | 34.6 | 0.450** | 14.4 | 0.214** | 15.1 | 0.235** | 5.76 | -0.02 | |||||
| LPI | 66.1 | -0.348** | 19.5 | 0.206** | 1.97 | 0.155** | 4.78 | 0.035** | 2.89 | -0.096** | |||||
| LSI | 2.05 | 0.493** | 2.32 | 0.464** | 1.65 | 0.235** | 1.62 | 0.267** | 1.12 | 0.013 | |||||
| PD | 1.99 | 0.299** | 3.86 | 0.342** | 3.06 | 0.176** | 2.55 | 0.290** | 1.21 | 0.053* | |||||
| PLAND | 68.4 | -0.343** | 24.0 | 0.273** | 4.36 | 0.129** | 6.76 | 0.121** | 3.11 | -0.059** | |||||
| 2016 | AI | 82.3 | -0.181** | 40.1 | -0.008 | 40.5 | -0.035** | 48.4 | -0.048** | 59.7 | 0.021 | ||||
| Area-Mean | 59.2 | -0.191** | 6.32 | 0.044** | 3.78 | -0.009 | 4.95 | 0.046** | 3.14 | -0.018 | |||||
| ED | 33.4 | 0.243** | 23.8 | 0.115** | 26.8 | 0.137** | 15.6 | 0.100** | 7.70 | -0.016 | |||||
| LPI | 68.3 | -0.170** | 10.4 | 0.063** | 7.76 | 0.044** | 7.37 | 0.061** | 3.54 | -0.023 | |||||
| LSI | 1.53 | 0.107** | 1.93 | 0.128** | 2.28 | 0.128** | 1.24 | 0.002 | 1.13 | -0.176** | |||||
| PD | 2.07 | 0.159** | 3.13 | 0.119** | 3.57 | 0.150** | 2.27 | 0.110** | 1.34 | -0.038** | |||||
| PLAND | 13.8 | -0.164** | 13.8 | 0.081** | 12.1 | 0.082** | 9.26 | 0.073** | 3.95 | -0.028* | |||||
| 2020 | AI | 80.2 | -0.220** | 53.5 | 0.126** | 47.2 | 0.042 | 51.41 | -0.014** | 76.7 | -0.031 | ||||
| Area-Mean | 53.1 | -0.253** | 14.2 | 0.147** | 1.31 | -0.136** | 4.95 | 0.050** | 5.92 | -0.122** | |||||
| ED | 32.9 | 0.221** | 35.8 | 0.248** | 5.43 | -0.145** | 14.5 | 0.129** | 9.19 | 0.013 | |||||
| LPI | 62.8 | -0.230** | 22.0 | 0.189** | 1.52 | -0.149** | 7.20 | 0.070** | 6.38 | -0.102** | |||||
| LSI | 1.93 | 0.235** | 2.28 | 0.230** | 1.13 | -0.145** | 1.53 | 0.137** | 1.24 | 0.054** | |||||
| PD | 2.08 | 0.190** | 3.47 | 0.140** | 1.31 | -0.148** | 2.12 | 0.135** | 1.18 | -0.013 | |||||
| PLAND | 66.0 | -0.221** | 26.9 | 0.217** | 1.84 | -0.159** | 8.94 | 0.085** | 6.63 | -0.104** | |||||
| 景观指数1) | 年份 | |||||||||||
|---|---|---|---|---|---|---|---|---|---|---|---|---|
| 2010 | 2013 | 2016 | 2020 | |||||||||
| 平均值 | 相关系数 | 平均值 | 相关系数 | 平均值 | 相关系数 | 平均值 | 相关系数 | |||||
| AI | 82.1 | -0.585** | 59.9 | -0.061** | 81.5 | -0.240** | 83.1 | -0.260** | ||||
| Contag | 43.5 | -0.020** | 48.0 | -0.119** | 42.80 | 0.080** | 43.0 | 0.005 | ||||
| Division | 0.331 | 0.539** | 0.317 | 0.502** | 0.339 | 0.224** | 0.337 | 0.251** | ||||
| ED | 44.2 | 0.557** | 44.3 | 0.561** | 42.1 | 0.226** | 38.9 | 0.263** | ||||
| LPI | 78.5 | -0.555** | 79.0 | -0.461** | 76.5 | -0.206** | 76.8 | -0.236** | ||||
| LSI | 1.64 | 0.592** | 2.10 | 0.561** | 1.96 | 0.187** | 1.96 | 0.263** | ||||
| PD | 11.2 | 0.541** | 8.94 | 0.564** | 8.71 | 0.237** | 6.77 | 0.256** | ||||
| SHDI | 0.503 | 0.502** | 0.503 | 0.536** | 0.537 | 0.233** | 0.489 | 0.259** | ||||
| SHEI | 0.488 | 0.520** | 0.444 | 0.475** | 0.440 | 0.238** | 0.505 | 0.245** | ||||
表3 景观层面景观指数与LST的相关性
Table 3 Correlation between landscape index and LST at landscape level
| 景观指数1) | 年份 | |||||||||||
|---|---|---|---|---|---|---|---|---|---|---|---|---|
| 2010 | 2013 | 2016 | 2020 | |||||||||
| 平均值 | 相关系数 | 平均值 | 相关系数 | 平均值 | 相关系数 | 平均值 | 相关系数 | |||||
| AI | 82.1 | -0.585** | 59.9 | -0.061** | 81.5 | -0.240** | 83.1 | -0.260** | ||||
| Contag | 43.5 | -0.020** | 48.0 | -0.119** | 42.80 | 0.080** | 43.0 | 0.005 | ||||
| Division | 0.331 | 0.539** | 0.317 | 0.502** | 0.339 | 0.224** | 0.337 | 0.251** | ||||
| ED | 44.2 | 0.557** | 44.3 | 0.561** | 42.1 | 0.226** | 38.9 | 0.263** | ||||
| LPI | 78.5 | -0.555** | 79.0 | -0.461** | 76.5 | -0.206** | 76.8 | -0.236** | ||||
| LSI | 1.64 | 0.592** | 2.10 | 0.561** | 1.96 | 0.187** | 1.96 | 0.263** | ||||
| PD | 11.2 | 0.541** | 8.94 | 0.564** | 8.71 | 0.237** | 6.77 | 0.256** | ||||
| SHDI | 0.503 | 0.502** | 0.503 | 0.536** | 0.537 | 0.233** | 0.489 | 0.259** | ||||
| SHEI | 0.488 | 0.520** | 0.444 | 0.475** | 0.440 | 0.238** | 0.505 | 0.245** | ||||
| 年份 | 回归模型1) | R2 |
|---|---|---|
| 2010 | t=0.216P+12.3S1+3.48S2+27.4 | 0.092 |
| 2013 | t=0.03T+0.107E+0.091L1+3.18S2+12.3 | 0.182 |
| 2016 | t=0.023T-0.058L2+0.019E+0.33P+8.34 | 0.029 |
| 2020 | t=0.007T+3.70S1-0.027A+31.4 | 0.013 |
表4 景观层面景观指数与LST的逐步回归模型
Table 4 Stepwise regression model of landscape index and LST at landscape level
| 年份 | 回归模型1) | R2 |
|---|---|---|
| 2010 | t=0.216P+12.3S1+3.48S2+27.4 | 0.092 |
| 2013 | t=0.03T+0.107E+0.091L1+3.18S2+12.3 | 0.182 |
| 2016 | t=0.023T-0.058L2+0.019E+0.33P+8.34 | 0.029 |
| 2020 | t=0.007T+3.70S1-0.027A+31.4 | 0.013 |
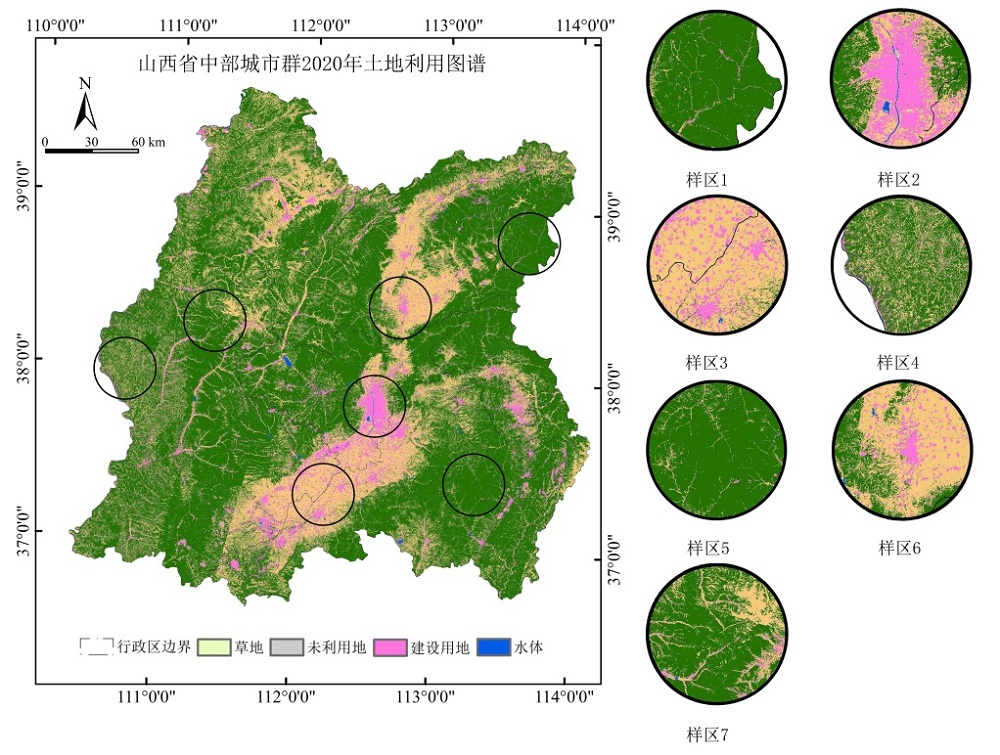
图9 山西省城市群绿地样本选择
Figure 9 Selection of green space samples of urban agglomerations in Shanxi Province
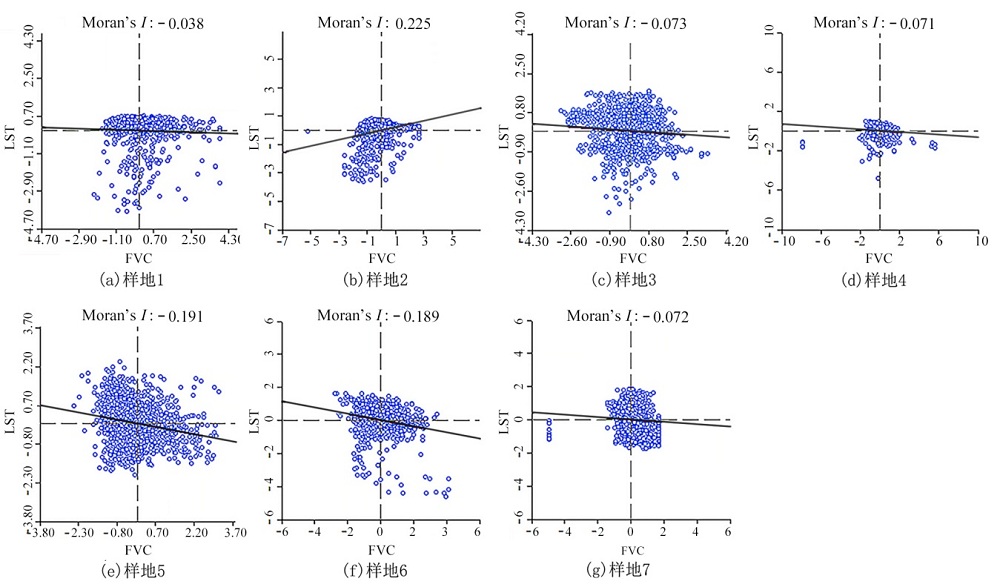
图10 绿地样本双变量空间自相关Moran’s I散点图
Figure 10 Two variable spatial autocorrelation Moran’s I scatter plot of green space samples
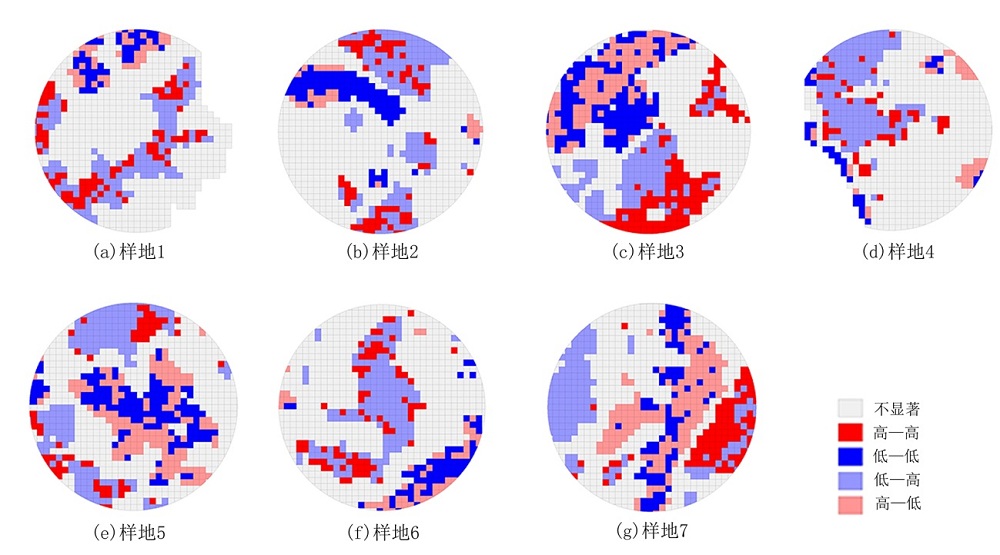
图11 绿地样本双变量空间自相关LISA分布图
Figure 11 Distribution of bivariate spatial autocorrelation LISA of green space samples
| [1] |
CHAKRABORTI S, BANERJEE A, SANNIGRAHI S, et al., 2019. Assessing the dynamic relationship among land use pattern and land surface temperature: A spatial regression approach[J]. Asian Geographer, 36(2): 93-116.
DOI URL |
| [2] |
ESTOQUE R, MURAYAMA Y, MYINT S, 2017. Effects of landscape composition and pattern on land surface temperature: An urban heat island study in the megacities of Southeast Asia[J]. Science of the Total Environment, 577(1): 349-359.
DOI URL |
| [3] |
GREENE G, KEDRONB P, 2018. Beyond fractional coverage: A multilevel approach to analyzing the impact of urban tree canopy structure on surface urban heat islands[J]. Applied Geography, 95(7): 45- 53.
DOI URL |
| [4] |
GUO G H, WU Z F, CHEN Y B, 2019. Complex mechanisms linking land surface temperature to greenspace spatial patterns: Evidence from four southeastern chinese cities[J]. Science of the Total Environment, 674(15): 77-87.
DOI URL |
| [5] |
LEE H K, YUAN T, JUNG H C, et al., 2015. Mapping wetland water depths over the central Congo Basin using PALSARS can SAR, Envisat altimetry, and MODIS VCF data[J]. Remote Sensing of Environment, 159: 70-79.
DOI URL |
| [6] | MYINT S W, BRAZEL A, OKIN G, et al., 2010. Combined effects of impervious surface and vegetation cover on air temperature variations in a rapidly expanding desert city[J]. GIS Science & Remote Sensing, 47(3): 301-320. |
| [7] |
ZHOU D C, BONAFONI S, ZHANG L X, et al., 2018. Remote sensing of the urban heat island effect in a highly populated urban agglomeration area in east China[J]. Science of the Total Environment, 628-629: 415-429.
DOI URL |
| [8] | 陈爱莲, 孙然好, 陈利顶, 2012. 传统景观格局指数在城市热岛效应评价中的适用性[J]. 应用生态学报, 23(8): 2077-2086. |
| CHEN A L, SUN R H, CHEN L D, 2012. Applicability of traditional landscape pattern index to urban heat island effect assessment[J]. Chinese Journal of Applied Ecology, 23(8): 2077-2086. | |
| [9] | 成实, 牛宇琛, 王鲁帅, 2019. 城市公园缓解热岛效应研究——以深圳为例[J]. 中国园林, 35(10): 40- 45. |
| CHENG S, NIU Y C, WANG L S, 2019. City parks relieving heat island effect research - in shenzhen, for example[J]. Chinese Garden, 35(10): 40-45. | |
| [10] |
陈述彭, 岳天祥, 励惠国, 等, 2000. 地学信息图谱研究及其应用[J]. 地理研究, 19(4): 337-343.
DOI |
| CHEN S P, YUE T X, LI H G, et al., 2000. Research on geoscience information graph and its application[J]. Geographical Research, 19(4): 337-343. | |
| [11] | 崔林林, 李国胜, 戢冬建, 2018. 成都市热岛效应及其与下垫面的关系[J]. 生态学杂志, 37(5): 1518-1526. |
| CUI L L, LI G S, JI D J, 2018. Heat island effect and its relationship with underlying surface in Chengdu City[J]. Journal of Ecology, 37(5): 1518-1526. | |
| [12] | 胡丽香, 2010. 武汉中心城区绿量格局研究[D]. 武汉: 华中农业大学:74. |
| HU L X, 2010. Study on the pattern of green quantity in Wuhan Central city[D]. Wuhan: Huazhong Agricultural University:74. | |
| [13] | 胡盼盼, 李锋, 胡聃, 等, 2021. 1980-2015年珠三角城市群城市扩张的时空特征分析[J]. 生态学报, 41(17): 7063-7072. |
| HU P P, LI F, HU D, et al., 2021. Spatial and temporal characteristics of urban expansion in the Pearl River Delta urban Agglomeration from 1980 to 2015[J]. Acta Ecologica Sinica, 41(17): 7063-7072. | |
| [14] |
黄丽明, 陈健飞, 2015. 城市景观格局时空特征的热环境效应研究——以广州市花都区为例[J]. 自然资源学报, 30(3): 480-490.
DOI |
| HUANG L M, CHEN J F, 2015. Thermal environment effects on spatial and temporal characteristics of urban landscape pattern: A case study of Huadu District, Guangzhou[J]. Journal of Natural Resources, 30(3): 480-490. | |
| [15] | 雷金睿, 陈宗铸, 吴庭天, 等, 2019. 1989-2015年海口城市热环境与景观格局的时空演变及其相互关系[J]. 中国环境科学, 39(4): 1734-1743. |
| LEI J R, CHEN Z Z, WU T T, et al., 2019. Spatial and temporal changes of urban thermal environment and landscape pattern in Haikou from 1989 to 2015 and their relationship[J]. China Environmental Science, 39(4): 1734-1743. | |
| [16] | 刘璐, 申广荣, 吴裕, 等, 2019. 城市化进程中县域土地利用类型的转移特征及其对热环境的影响[J]. 水土保持通报, 39(6): 260-266. |
| LIU L, SHEN G R, WU Y, et al., 2019. Transfer characteristics of land use types and their effects on thermal environment in county area during urbanization[J]. Bulletin of Soil and Water Conservation, 39(6): 260- 266. | |
| [17] | 刘焱序, 彭建, 王仰麟, 2017. 城市热岛效应与景观格局的关联: 从城市规模、景观组分到空间构型[J]. 生态学报, 37(23): 7769-7780. |
| LIU Y X, PENG J, WANG Y L, 2017. The relationship between urban heat island effect and landscape pattern: From urban scale and landscape composition to spatial architecture[J]. Acta Ecologica Sinica, 37(23): 7769-7780. | |
| [18] | 卢惠敏, 李飞, 张美亮, 等, 2018. 景观格局对杭州城市热环境年内变化的影响分析[J]. 遥感技术与应用, 33(3): 398- 407. |
| LU H M, LI F, ZHANG M L, et al., 2018. Analysis of the influence of landscape pattern on the annual variation of urban thermal environment in Hangzhou[J]. Remote Sensing Technology and Application, 33(3): 398-407. | |
| [19] | 宁秀红, 郭龙, 张海涛, 2013. 基于空间自回归和地理加权回归模型的不同尺度下土地利用程度研究[J]. 华中农业大学学报, 32(4): 48-54. |
| NING X H, GUO L, ZHANG H T, 2013. Study on land use degree at different scales based on spatial autoregressive and geographically weighted regression models[J]. Journal of Huazhong Agricultural University, 32(4): 48-54. | |
| [20] | 潘明慧, 兰思仁, 朱里莹, 等, 2020. 景观格局类型对热岛效应的影响——以福州市中心城区为例[J]. 中国环境科学, 40(6): 2635-2646. |
| PAN M H, LAN S R, Zhu L Y, et al., 2020. Influence of landscape pattern types on heat island effect over central Fuzhou City[J]. China Environmental Science, 40(6): 2635-2646.. | |
| [21] | 曲海涛, 翟玉兰, 张学明, 等, 2021. 基于1985-2015年Landsat MSS/TM/OLI影像的面向对象SVM分类的威海市土地利用及变化分析[J]. 测绘与空间地理信息, 44(5): 132-135. |
| QU H T, ZHAI Y L, ZHANG X M, et al., 2021. Analysis of land use and change in Weihai City based on Object-Oriented SVM classification of Landsat MSS/TM/OLI images from 1985 to 2015[J]. Mapping and Spatial Geographic Information. 44(5): 132-135. | |
| [22] | 沈中健, 曾坚, 梁晨, 2020a. 闽南三市绿地景观格局与地表温度的空间关系[J]. 生态学杂志, 39(4): 1309-1317. |
| SHEN Z J, ZENG J, LIANG C, 2020. Spatial relationship between green landscape pattern and land surface temperature in three cities in southern Fujian Province[J]. Chinese Journal of Ecology, 39(4): 1309-1317. | |
| [23] | 沈中健, 曾坚, 2020b. 厦门市热岛强度与相关地表因素的空间关系研究[J]. 地理科学, 40(5): 842- 852. |
| SHEN Z J, ZENG J, 2020. Spatial relationship between heat island intensity and related surface factors in Xiamen City[J]. Geographical Science, 40(5): 842-852. | |
| [24] |
覃志豪, ZHANG Minghua, ARNON K, 等, 2001. 用陆地卫星TM6数据演算地表温度的单窗算法[J]. 地理学报, 56(4): 456-466.
DOI |
| QIN Z H, ZHANG M H, ARNON K, et al., 2001. A single window algorithm for land surface temperature calculation from Landsat TM6 data[J]. Acta Geographica Sinica, 56(4): 456-466. | |
| [25] | 王戈, 于强, YANG D, 等, 2021. 京津冀城市群生态空间格局变化与地表温度关系研究[J]. 农业机械学报, 52(1): 209-218. |
| WANG G, YU Q, YANG D, et al., 2021. Study on the relationship between ecological spatial pattern change and land surface temperature in the Beijing-Tianjin-Hebei urban Agglomeration[J]. Transactions of the Chinese Society for Agricultural Machinery, 52(1): 209-218. | |
| [26] | 王莹莹, 2010. 城市热岛变化特征及其与下垫面之间的关系[D]. 合肥: 安徽师范大学:56. |
| WANG Y Y, 2010. Variation characteristics of urban heat island and its relationship with underlying surface[D]. Hefei: Anhui Normal University:56. | |
| [27] | 魏娜思, 2019. 基于高分影像的林地覆盖遥感动态监测[J]. 信息通信 (3): 19-22. |
| WEI N S, 2019. Dynamic monitoring of forest cover by remote sensing based on high-resolution images[J]. Information and Communication (3): 19-22. | |
| [28] | 闫章美, 周德成, 张良侠, 2021. 我国三大城市群地区城市和农业用地地表热环境效应对比研究[J]. 生态学报, 41(22): 8870-888. |
| YAN Z M, ZHOU D C, ZHANG L X, 2021. Comparative study on surface thermal environment effects of urban and agricultural land in Urban Agglomerations[J]. Acta Ecologica Sinica, 41(22): 8870-8881. | |
| [29] | 姚远, 陈曦, 钱静, 2018. 城市地表热环境研究进展[J]. 生态学报, 38(3): 1134-1147. |
| YAO Y, CHEN X, QIAN J, 2018. Research progress of urban surface thermal environment[J]. Acta Ecologica Sinica, 38(3): 1134-1147. | |
| [30] | 张志明, 罗亲普, 王文礼, 等, 2010. 2D与3D景观指数测定山区植被景观格局变化对比分析[J]. 生态学报, 30(21): 5886-5893. |
| ZHANG Z M, LUO Z P, WANG W L, et al., 2010. Comparative analysis of vegetation landscape pattern change in mountainous area measured by 2D and 3D landscape index[J]. Acta Ecologica Sinica, 30(21): 5886-5893. | |
| [31] | 邹婧, 曾辉, 2017. 城市地表热环境与景观格局的关系——以深圳市为例[J]. 北京大学学报(自然科学版), 53(3): 436-444. |
| ZOU J, ZENG H, 2017. The relationship between urban surface thermal environment and landscape pattern: A case study of Shenzhen[J]. Journal of Peking University (Natural Sciences), 53(3): 436-444. |
| [1] | 刘霞, 郭澍, 王琳. 区域一体化地区的土地利用与生态服务价值研究——以双莱先行区为例[J]. 生态环境学报, 2023, 32(6): 1163-1172. |
| [2] | 李建辉, 党争, 陈琳. 黄河几字弯都市圈PM2.5时空特征及影响因素分析[J]. 生态环境学报, 2023, 32(4): 697-705. |
| [3] | 王嘉丽, 冯婧珂, 杨元征, 俎佳星, 蔡文华, 杨健. 南宁市主城区不透水面与热环境效应的空间关系研究[J]. 生态环境学报, 2023, 32(3): 525-534. |
| [4] | 蒋恬田, 杨纯, 廖炜, 胡力, 刘欢瑶, 任勃, 李小马. 城市绿地景观格局影响地表温度的通径分析——以长沙市为例[J]. 生态环境学报, 2023, 32(1): 18-25. |
| [5] | 王晨茜, 张琼锐, 张若琪, 孙学超, 徐颂军. 广东省珠江流域景观格局对水质净化服务的影响[J]. 生态环境学报, 2022, 31(7): 1425-1433. |
| [6] | 玄锦, 李祖婵, 邹诚, 秦子博, 吴雅华, 黄柳菁. 江心洲景观类型和格局对植物多样性的多尺度影响——以闽江流域福州段为例[J]. 生态环境学报, 2022, 31(12): 2320-2330. |
| [7] | 边振兴, 张宇飞, 果晓玉, 林琳, 于淼. 低山丘陵区农业景观格局对害虫-捕食性天敌食物网的影响[J]. 生态环境学报, 2022, 31(1): 79-88. |
| [8] | 董鑫, 郎嘉钰, 楚原梦冉, 赵姗姗, 张晋东, 白文科. 川金丝猴家域的季节性差异[J]. 生态环境学报, 2021, 30(7): 1342-1352. |
| [9] | 胡琳, 李思悦. 不同空间尺度土地利用结构与景观格局对龙川江流域水质的影响[J]. 生态环境学报, 2021, 30(7): 1470-1481. |
| [10] | 宋鑫博, 黄鹤, 郭军, 熊明明. 城市形态对夏季热环境影响研究——以天津中心城区为例[J]. 生态环境学报, 2021, 30(11): 2165-2174. |
| [11] | 雷金睿, 陈宗铸, 陈毅青, 陈小花, 李苑菱, 吴庭天. 1990—2018年海南岛湿地景观格局演变及其驱动力分析[J]. 生态环境学报, 2020, 29(1): 59-70. |
| 阅读次数 | ||||||
|
全文 |
|
|||||
|
摘要 |
|
|||||