生态环境学报 ›› 2020, Vol. 29 ›› Issue (1): 59-70.DOI: 10.16258/j.cnki.1674-5906.2020.01.007
雷金睿( ), 陈宗铸*(), 陈毅青, 陈小花, 李苑菱, 吴庭天
收稿日期:2019-10-08
出版日期:2020-01-18
发布日期:2020-03-09
通讯作者:
* 陈宗铸(1977年生),男,副研究员,博士,研究方向为林业3S技术。E-mail: chenzongzhu@foxmail.com作者简介:雷金睿(1988年生),男,助理研究员,硕士,研究方向为湿地植物与景观演变。E-mail: raykingre@163.com
基金资助:
LEI Jinrui(), CHEN Zongzhu*(), CHEN Yiqing, CHEN Xiaohua, LI Yuanling, WU Tingtian
Received:2019-10-08
Online:2020-01-18
Published:2020-03-09
摘要:
以1990、1995、2000、2005、2010年Landsat TM和2015、2018年Landsat OLI 7期遥感影像为主要数据源,综合运用景观动态分析、景观格局指数和数理统计等方法分析了近30年来海南岛湿地景观演变特征及其驱动因子。结果表明:(1)1990—2018年间,海南岛湿地景观总面积呈增长的趋势,且在2005年之前湿地综合动态变化较剧烈,2005年以后变缓。2018年湿地总面积达1337.57 km2,面积净增加393.21 km2,年变化率为14.04 km2∙a-1;(2)在研究期内,人工湿地持续增长,自然湿地则持续减少,其中水产养殖场和库塘的净增加面积最高,分别为268.53 km2和179.46 km2;澙湖减少最多,为86.65 km2;盐田和红树林的面积变化不大;(3)海南岛湿地景观总体呈现破碎度增大、连通度降低、斑块形状趋于复杂的变化特征,以库塘、水产养殖场等人工类湿地的变化较大,自然类湿地变化较小;(4)研究区人口总数、城镇人口、国内生产总值和渔业生产总值是影响湿地景观变化的关键因素,是导致研究区自然湿地减少、人工湿地增加和湿地景观多样性变化与破碎化的主要驱动因子。研究结果可为海南岛湿地资源今后的保护利用和规划提供重要的参考。
中图分类号:
雷金睿, 陈宗铸, 陈毅青, 陈小花, 李苑菱, 吴庭天. 1990—2018年海南岛湿地景观格局演变及其驱动力分析[J]. 生态环境学报, 2020, 29(1): 59-70.
LEI Jinrui, CHEN Zongzhu, CHEN Yiqing, CHEN Xiaohua, LI Yuanling, WU Tingtian. Landscape Pattern Changes and Driving Factors Analysis of Wetland in Hainan Island during 1990-2018[J]. Ecology and Environment, 2020, 29(1): 59-70.
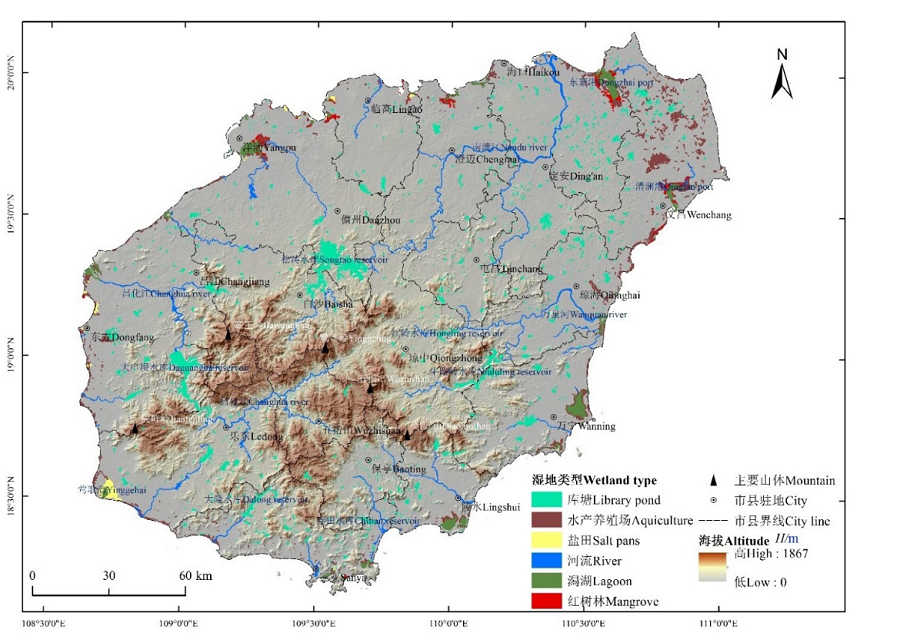
图1 研究区位置及湿地景观类型(2018年)
Fig. 1 Location of the study area and wetland landscape types (2018)

图2 1990—2018年海南岛湿地类型
Fig. 2 Types of wetland in Hainan Island in 1990-2018
| 一级湿地类型 First wetland type | 二级湿地类型 Second wetland type | 1990 | 1995 | 2000 | 2005 | 2010 | 2015 | 2018 | 1990—2018年变化率 Annual gradient/(km2∙a-1) |
|---|---|---|---|---|---|---|---|---|---|
| 人工湿地 Artificial wetland | 423.87 | 540.46 | 631.83 | 655.81 | 730.90 | 869.43 | 873.26 | 16.05 | |
| 库塘 Library pond | 364.69 | 458.02 | 501.49 | 430.28 | 450.28 | 536.19 | 544.15 | 6.41 | |
| 水产养殖场 Aquiculture | 21.28 | 45.50 | 93.40 | 187.20 | 240.85 | 293.88 | 289.82 | 9.59 | |
| 盐田 Salt pans | 37.90 | 36.94 | 36.94 | 38.33 | 39.77 | 39.36 | 39.29 | 0.05 | |
| 自然湿地 Natural wetland | 520.49 | 502.93 | 484.84 | 463.94 | 460.70 | 453.64 | 464.31 | -2.01 | |
| 河流 River | 164.53 | 170.40 | 169.61 | 170.79 | 170.07 | 181.02 | 196.17 | 1.13 | |
| 潟湖 Lagoon | 318.13 | 292.68 | 277.38 | 256.36 | 251.33 | 234.94 | 231.48 | -3.09 | |
| 红树林 Mangrove | 37.83 | 39.86 | 37.86 | 36.79 | 39.31 | 37.68 | 36.66 | -0.04 | |
| 总面积 Total wetland area | 944.36 | 1043.40 | 1116.67 | 1119.75 | 1191.60 | 1323.08 | 1337.57 | 14.04 |
表1 1990—2018年海南岛湿地类型面积
Table 1 Area of different types of wetland in Hainan Island in 1990-2018 km2
| 一级湿地类型 First wetland type | 二级湿地类型 Second wetland type | 1990 | 1995 | 2000 | 2005 | 2010 | 2015 | 2018 | 1990—2018年变化率 Annual gradient/(km2∙a-1) |
|---|---|---|---|---|---|---|---|---|---|
| 人工湿地 Artificial wetland | 423.87 | 540.46 | 631.83 | 655.81 | 730.90 | 869.43 | 873.26 | 16.05 | |
| 库塘 Library pond | 364.69 | 458.02 | 501.49 | 430.28 | 450.28 | 536.19 | 544.15 | 6.41 | |
| 水产养殖场 Aquiculture | 21.28 | 45.50 | 93.40 | 187.20 | 240.85 | 293.88 | 289.82 | 9.59 | |
| 盐田 Salt pans | 37.90 | 36.94 | 36.94 | 38.33 | 39.77 | 39.36 | 39.29 | 0.05 | |
| 自然湿地 Natural wetland | 520.49 | 502.93 | 484.84 | 463.94 | 460.70 | 453.64 | 464.31 | -2.01 | |
| 河流 River | 164.53 | 170.40 | 169.61 | 170.79 | 170.07 | 181.02 | 196.17 | 1.13 | |
| 潟湖 Lagoon | 318.13 | 292.68 | 277.38 | 256.36 | 251.33 | 234.94 | 231.48 | -3.09 | |
| 红树林 Mangrove | 37.83 | 39.86 | 37.86 | 36.79 | 39.31 | 37.68 | 36.66 | -0.04 | |
| 总面积 Total wetland area | 944.36 | 1043.40 | 1116.67 | 1119.75 | 1191.60 | 1323.08 | 1337.57 | 14.04 |
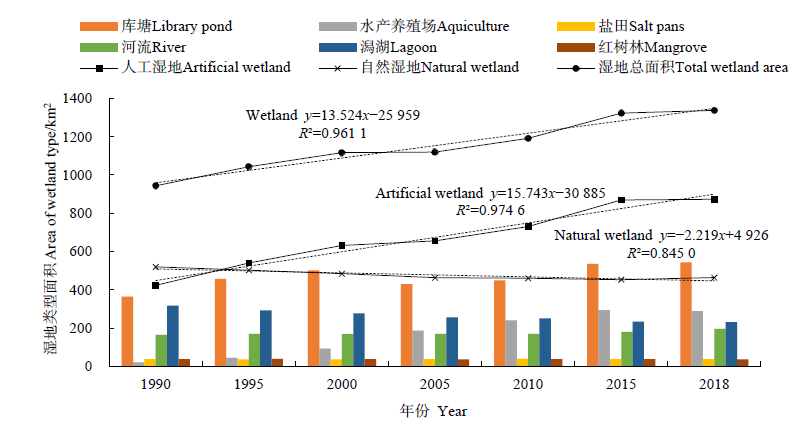
图3 1990—2018年海南岛湿地类型面积变化
Fig. 3 Area changes of different types of wetland in Hainan Island in 1990-2018
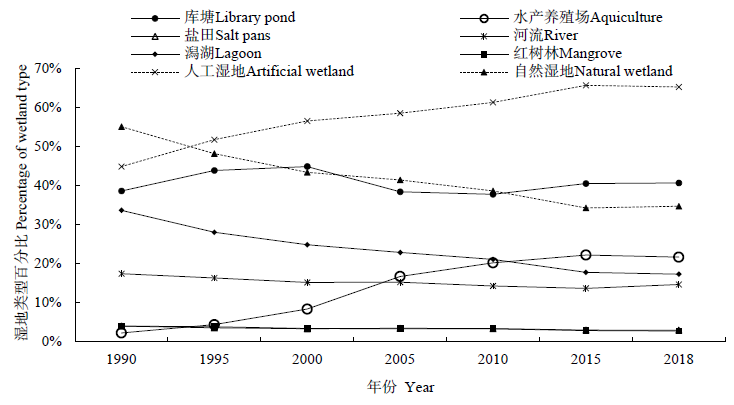
图4 1990—2018年海南岛湿地类型百分比变化
Fig. 4 Percentage changes of different types of wetland in Hainan Island in 1990-2018
| 时期 Phases | 1990-1995 | 1995-2000 | 2000-2005 | 2005-2010 | 2010-2015 | 2015-2018 | 1990-2018 |
|---|---|---|---|---|---|---|---|
| 湿地综合动态度 Wetland comprehensive dynamic index | 1.61% | 1.05% | 1.70% | 0.74% | 1.41% | 0.40% | 1.08% |
表2 1990—2018年海南岛湿地综合动态度
Table 2 Comprehensive dynamic attitude of wetland in Hainan Island in 1990-2018
| 时期 Phases | 1990-1995 | 1995-2000 | 2000-2005 | 2005-2010 | 2010-2015 | 2015-2018 | 1990-2018 |
|---|---|---|---|---|---|---|---|
| 湿地综合动态度 Wetland comprehensive dynamic index | 1.61% | 1.05% | 1.70% | 0.74% | 1.41% | 0.40% | 1.08% |
| 1990 | 2018 | |||||||
|---|---|---|---|---|---|---|---|---|
| 库塘 Library pond | 水产养殖场 Aquiculture | 盐田 Salt pans | 河流 River | 潟湖 Lagoon | 红树林 Mangrove | 非湿地 Non- wetland | 总计 Total | |
| 库塘 Library pond | 307.63 | 10.03 | 6.84 | 0.04 | 40.15 | 364.69 | ||
| 水产养殖场 Aquiculture | 15.78 | 0.04 | 0.41 | 1.17 | 0.06 | 3.83 | 21.28 | |
| 盐田 Salt pans | 0.37 | 36.21 | 0.01 | 0.13 | 0.01 | 1.16 | 37.90 | |
| 河流 River | 10.39 | 4.15 | 0.02 | 114.89 | 0.20 | 0.05 | 34.83 | 164.53 |
| 潟湖 Lagoon | 0.12 | 56.51 | 0.54 | 5.10 | 216.34 | 5.49 | 34.05 | 318.14 |
| 红树林 Mangrove | 0.06 | 5.69 | 0.03 | 0.13 | 1.58 | 27.83 | 2.53 | 37.85 |
| 非湿地 Non-wetland | 225.96 | 197.29 | 2.45 | 68.81 | 12.03 | 3.22 | 509.74 | |
| 总计 Total | 544.15 | 289.82 | 39.29 | 196.17 | 231.48 | 36.66 | 116.56 | |
表3 1990—2018年湿地类型面积转移矩阵
Table 3 Transfer matrix of different wetland types in 1990-2018 km2
| 1990 | 2018 | |||||||
|---|---|---|---|---|---|---|---|---|
| 库塘 Library pond | 水产养殖场 Aquiculture | 盐田 Salt pans | 河流 River | 潟湖 Lagoon | 红树林 Mangrove | 非湿地 Non- wetland | 总计 Total | |
| 库塘 Library pond | 307.63 | 10.03 | 6.84 | 0.04 | 40.15 | 364.69 | ||
| 水产养殖场 Aquiculture | 15.78 | 0.04 | 0.41 | 1.17 | 0.06 | 3.83 | 21.28 | |
| 盐田 Salt pans | 0.37 | 36.21 | 0.01 | 0.13 | 0.01 | 1.16 | 37.90 | |
| 河流 River | 10.39 | 4.15 | 0.02 | 114.89 | 0.20 | 0.05 | 34.83 | 164.53 |
| 潟湖 Lagoon | 0.12 | 56.51 | 0.54 | 5.10 | 216.34 | 5.49 | 34.05 | 318.14 |
| 红树林 Mangrove | 0.06 | 5.69 | 0.03 | 0.13 | 1.58 | 27.83 | 2.53 | 37.85 |
| 非湿地 Non-wetland | 225.96 | 197.29 | 2.45 | 68.81 | 12.03 | 3.22 | 509.74 | |
| 总计 Total | 544.15 | 289.82 | 39.29 | 196.17 | 231.48 | 36.66 | 116.56 | |
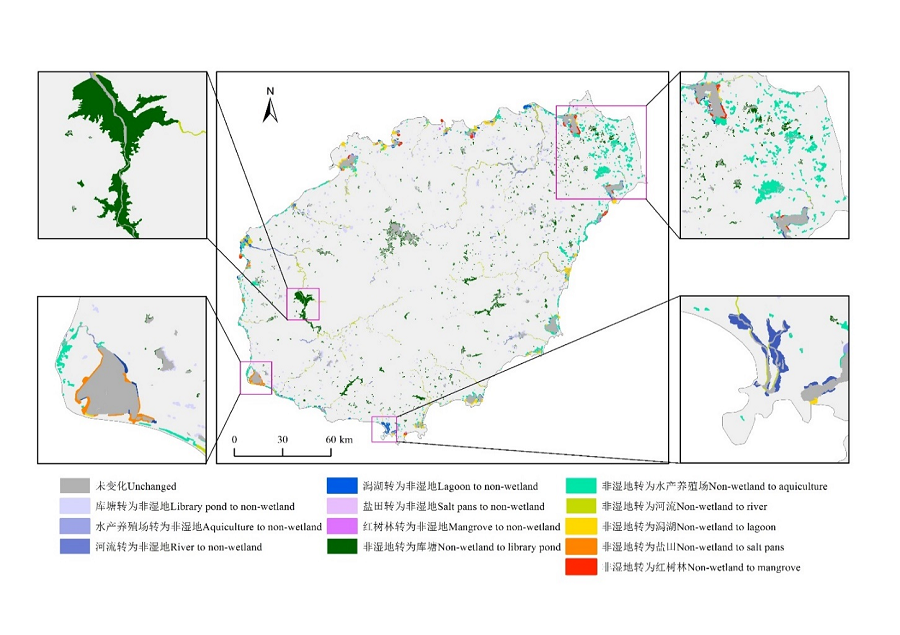
图5 1990—2018年海南岛湿地变化空间分布图
Fig. 5 Spatial distribution of wetland changes in Hainan Island in 1990-2018
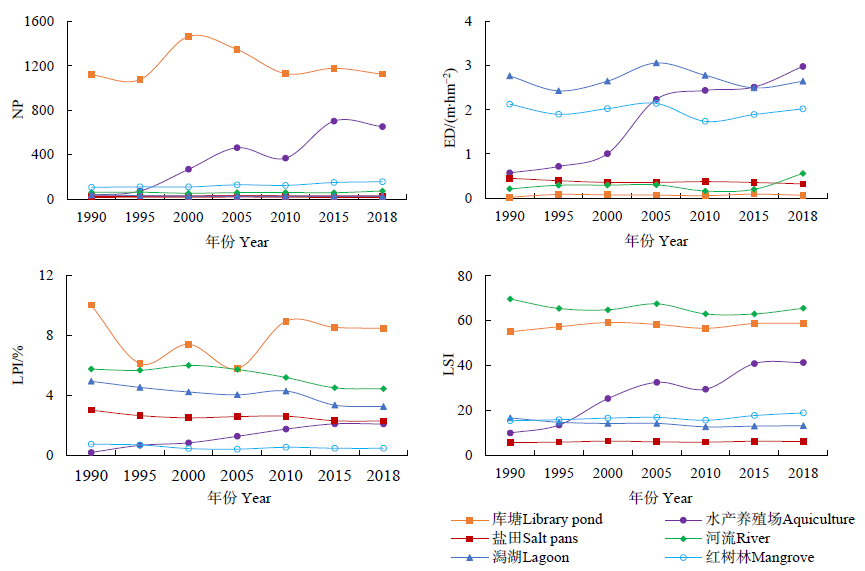
图6 1990—2018年海南岛湿地类型水平上的景观格局指数变化
Fig. 6 Changes in landscape pattern indices of wetland in Hainan Island at the scale of class in 1990-2018
| 时期 Phases | NP | LPI/% | ED/ (m∙hm-2) | LSI | PAFRAC | CONTAG | SHDI |
|---|---|---|---|---|---|---|---|
| 1990 | 1379 | 10.04 | 3.08 | 76.29 | 1.51 | 60.64 | 1.38 |
| 1995 | 1373 | 6.17 | 2.92 | 76.84 | 1.52 | 60.32 | 1.39 |
| 2000 | 1943 | 7.42 | 3.20 | 80.83 | 1.49 | 59.31 | 1.43 |
| 2005 | 2047 | 6.09 | 4.09 | 83.36 | 1.48 | 56.52 | 1.52 |
| 2010 | 1729 | 8.96 | 3.78 | 78.32 | 1.46 | 56.47 | 1.52 |
| 2015 | 2134 | 8.55 | 3.78 | 86.07 | 1.44 | 57.52 | 1.49 |
| 2018 | 2052 | 8.45 | 4.28 | 87.56 | 1.45 | 57.40 | 1.48 |
表4 1990—2018年海南岛湿地景观水平上的景观格局指数变化
Table 4 Changes in landscape pattern indices of wetland in Hainan Island at the scale of landscape in 1990-2018
| 时期 Phases | NP | LPI/% | ED/ (m∙hm-2) | LSI | PAFRAC | CONTAG | SHDI |
|---|---|---|---|---|---|---|---|
| 1990 | 1379 | 10.04 | 3.08 | 76.29 | 1.51 | 60.64 | 1.38 |
| 1995 | 1373 | 6.17 | 2.92 | 76.84 | 1.52 | 60.32 | 1.39 |
| 2000 | 1943 | 7.42 | 3.20 | 80.83 | 1.49 | 59.31 | 1.43 |
| 2005 | 2047 | 6.09 | 4.09 | 83.36 | 1.48 | 56.52 | 1.52 |
| 2010 | 1729 | 8.96 | 3.78 | 78.32 | 1.46 | 56.47 | 1.52 |
| 2015 | 2134 | 8.55 | 3.78 | 86.07 | 1.44 | 57.52 | 1.49 |
| 2018 | 2052 | 8.45 | 4.28 | 87.56 | 1.45 | 57.40 | 1.48 |
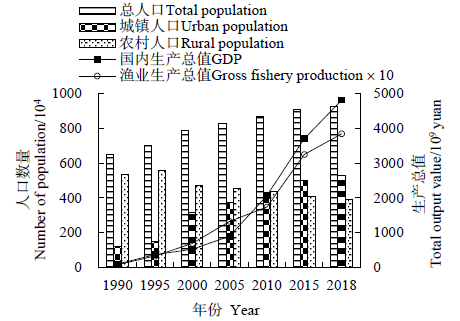
图7 1990—2018年研究区域人口与社会经济发展动态
Fig. 7 Dynamic of population and social economy in study area in 1990-2018
| 指标 Index | 年降水量 Annual rainfall/mm | 平均气温 Average temperature/℃ | 平均相对湿度 Average relative humidity/% |
|---|---|---|---|
| 1990 | 1312.74 | 24.17 | 84.70 |
| 1995 | 1277.44 | 23.96 | 82.98 |
| 2000 | 1592.77 | 24.31 | 83.05 |
| 2005 | 1213.36 | 24.52 | 77.43 |
| 2010 | 1509.11 | 24.91 | 79.77 |
| 2015 | 1065.99 | 25.36 | 80.28 |
| 2018 | 1411.27 | 24.48 | 81.99 |
| 线性拟合公式 Linear fitting | y=-1.8599x+5068.9 | y=0.0338x-43.246 | y=-0.1324x+346.83 |
| 拟合优度 Fitting optimization level | R²=0.0115 | R²=0.5511 | R²=0.3124 |
表5 1990—2018年研究区域气候环境指标动态
Table 5 Dynamic of climate and environmental indicators in study area in 1990-2018
| 指标 Index | 年降水量 Annual rainfall/mm | 平均气温 Average temperature/℃ | 平均相对湿度 Average relative humidity/% |
|---|---|---|---|
| 1990 | 1312.74 | 24.17 | 84.70 |
| 1995 | 1277.44 | 23.96 | 82.98 |
| 2000 | 1592.77 | 24.31 | 83.05 |
| 2005 | 1213.36 | 24.52 | 77.43 |
| 2010 | 1509.11 | 24.91 | 79.77 |
| 2015 | 1065.99 | 25.36 | 80.28 |
| 2018 | 1411.27 | 24.48 | 81.99 |
| 线性拟合公式 Linear fitting | y=-1.8599x+5068.9 | y=0.0338x-43.246 | y=-0.1324x+346.83 |
| 拟合优度 Fitting optimization level | R²=0.0115 | R²=0.5511 | R²=0.3124 |
| 类型 | 总人口 Total population | 城镇人口 Urban population | 农村人口 Rural population | 国内生产总值GDP | 渔业生产总值Gross fishery production | 20—20时累计降水量 20-20 hours cumulative precipitation | 平均气温Average temperature | 平均相对湿度Average relative humidity |
|---|---|---|---|---|---|---|---|---|
| 人工湿地 Artificial wetland | 0.982** | 0.969** | -0.931** | 0.922** | 0.954** | -0.129 | 0.748 | -0.506 |
| 库塘 Library pond | 0.782* | 0.752 | -0.693 | 0.769* | 0.782* | 0.006 | 0.458 | -0.166 |
| 水产养殖场 Aquiculture | 0.977** | 0.976** | -0.952** | 0.898** | 0.938** | -0.188 | 0.819* | -0.633 |
| 盐田Salt pans | 0.758* | 0.776* | -0.788* | 0.763* | 0.766* | -0.179 | 0.793* | -0.519 |
| 自然湿地 Natural wetland | -0.955** | -0.946** | 0.897** | -0.714 | -0.791* | 0.132 | -0.806* | 0.799* |
| 河流 River | 0.751 | 0.739 | -0.733 | 0.927** | 0.910** | -0.107 | 0.321 | -0.128 |
| 潟湖 Lagoon | -0.992** | -0.978** | 0.934** | -0.860* | -0.913** | 0.134 | -0.737 | 0.664 |
| 红树林 Mangrove | -0.406 | -0.463 | 0.564 | -0.410 | -0.480 | 0.170 | -0.197 | 0.249 |
| 湿地总面积 Total wetland area | 0.968** | 0.955** | -0.919** | 0.941** | 0.965** | -0.126 | 0.724 | -0.445 |
表6 湿地类型面积与社会环境因子的相关性分析
Table 6 Regression analyses between the area of wetland types and social economy and climate factors
| 类型 | 总人口 Total population | 城镇人口 Urban population | 农村人口 Rural population | 国内生产总值GDP | 渔业生产总值Gross fishery production | 20—20时累计降水量 20-20 hours cumulative precipitation | 平均气温Average temperature | 平均相对湿度Average relative humidity |
|---|---|---|---|---|---|---|---|---|
| 人工湿地 Artificial wetland | 0.982** | 0.969** | -0.931** | 0.922** | 0.954** | -0.129 | 0.748 | -0.506 |
| 库塘 Library pond | 0.782* | 0.752 | -0.693 | 0.769* | 0.782* | 0.006 | 0.458 | -0.166 |
| 水产养殖场 Aquiculture | 0.977** | 0.976** | -0.952** | 0.898** | 0.938** | -0.188 | 0.819* | -0.633 |
| 盐田Salt pans | 0.758* | 0.776* | -0.788* | 0.763* | 0.766* | -0.179 | 0.793* | -0.519 |
| 自然湿地 Natural wetland | -0.955** | -0.946** | 0.897** | -0.714 | -0.791* | 0.132 | -0.806* | 0.799* |
| 河流 River | 0.751 | 0.739 | -0.733 | 0.927** | 0.910** | -0.107 | 0.321 | -0.128 |
| 潟湖 Lagoon | -0.992** | -0.978** | 0.934** | -0.860* | -0.913** | 0.134 | -0.737 | 0.664 |
| 红树林 Mangrove | -0.406 | -0.463 | 0.564 | -0.410 | -0.480 | 0.170 | -0.197 | 0.249 |
| 湿地总面积 Total wetland area | 0.968** | 0.955** | -0.919** | 0.941** | 0.965** | -0.126 | 0.724 | -0.445 |
| 景观指数 Landscape index | 总人口 Total population | 城镇人口 Urban population | 农村人口 Rural population | 国内生产总值GDP | 渔业生产总值Gross fishery production | 年降水量 Annual rainfall | 平均气温 Average temperature | 平均相对湿度Average relative humidity |
|---|---|---|---|---|---|---|---|---|
| NP | 0.862* | 0.878** | -0.881** | 0.650 | 0.748 | -0.123 | 0.660 | -0.617 |
| LPI | 0.022 | 0.084 | -0.193 | 0.266 | 0.184 | 0.126 | 0.302 | 0.395 |
| ED | 0.857* | 0.872* | -0.888** | 0.754* | 0.815* | -0.131 | 0.566 | -0.708 |
| LSI | 0.847* | 0.853* | -0.857* | 0.828* | 0.890** | -0.276 | 0.550 | -0.445 |
| PAFRAC | -0.970** | -0.983** | 0.982** | -0.894** | -0.933** | 0.114 | -0.842* | 0.532 |
| CONTAG | -0.850* | -0.853* | 0.828* | -0.581 | -0.662 | 0.070 | -0.704 | 0.890** |
| SHDI | 0.838* | 0.841* | -0.813* | 0.557 | 0.639 | -0.063 | 0.709 | -0.897** |
表7 湿地景观格局与社会环境因子的相关性分析
Table 7 Regression analyses between wetland landscape pattern and social economy and climate factors
| 景观指数 Landscape index | 总人口 Total population | 城镇人口 Urban population | 农村人口 Rural population | 国内生产总值GDP | 渔业生产总值Gross fishery production | 年降水量 Annual rainfall | 平均气温 Average temperature | 平均相对湿度Average relative humidity |
|---|---|---|---|---|---|---|---|---|
| NP | 0.862* | 0.878** | -0.881** | 0.650 | 0.748 | -0.123 | 0.660 | -0.617 |
| LPI | 0.022 | 0.084 | -0.193 | 0.266 | 0.184 | 0.126 | 0.302 | 0.395 |
| ED | 0.857* | 0.872* | -0.888** | 0.754* | 0.815* | -0.131 | 0.566 | -0.708 |
| LSI | 0.847* | 0.853* | -0.857* | 0.828* | 0.890** | -0.276 | 0.550 | -0.445 |
| PAFRAC | -0.970** | -0.983** | 0.982** | -0.894** | -0.933** | 0.114 | -0.842* | 0.532 |
| CONTAG | -0.850* | -0.853* | 0.828* | -0.581 | -0.662 | 0.070 | -0.704 | 0.890** |
| SHDI | 0.838* | 0.841* | -0.813* | 0.557 | 0.639 | -0.063 | 0.709 | -0.897** |
| [1] | BDRINSON M M, ECKLES D, 2011. Department of Agriculture conservation program and practice effects on wetland ecosystem services: A synthesis[J]. Ecological Applications, 21(3): 116-127. |
| [2] |
COPELAND H E, TESSMAN S A, GIRVETZ E H, et al., 2010. A geospatial assessment on the distribution, condition, and vulnerability of Wyoming's wetlands[J]. Ecological Indicators, 10(4): 869-879.
DOI URL |
| [3] |
DAVRANCHE A, LEFEBVRE G, POULIN B, 2010. Wetland monitoring using classification trees and SPOT-5 seasonal time series[J]. Remote Sensing of Environment, 114(3): 552-562.
DOI URL |
| [4] |
FENG L, HAN X X, HU C M, et al., 2016. Four decades of wetland changes of the largest freshwater lake in China: Possible linkage to the Three Gorges Dam?[J]. Remote Sensing of Environment, 176: 43-55.
DOI URL |
| [5] |
HUANG L B, BAI J H, YAN D H, et al., 2012. Changes of wetland landscape patterns in Dadu River catchment from 1985 to 2000, China[J]. Frontiers of Earth Science, 6(3): 237-249
DOI URL |
| [6] |
JIN H R, HUANG C Q, MEGAN W LANG, et al., 2017. Monitoring of wetland inundation dynamics in the Delmarva Peninsula using Landsat time-series imagery from 1985 to 2011, China[J]. Remote Sensing of Environment, 190: 26-41.
DOI URL |
| [7] |
LIN W P, GEN J W, XU D, et al., 2018. Wetland landscape pattern changes over a period of rapid development (1985-2015) in the Zhoushan Islands of Zhejiang province, China[J]. Estuarine, Coastal and Shelf Science, 213: 148-159.
DOI URL |
| [8] |
SKALÓS J, RICHTER P, KEKEN Z, 2017. Changes and trajectories of wetlands in the lowland landscape of the Czech Republic[J]. Ecological Engineering, 108: 435-445.
DOI URL |
| [9] |
SUN N, ZHU W N, CHENG Q, 2018. GF-1 and Landsat observed a 40-year wetland spatiotemporal variation and its coupled environmental factors in Yangtze River estuary[J]. Estuarine, Coastal and Shelf Science, 207: 30-39.
DOI URL |
| [10] |
YU H Y, ZHANG F, KUNG H T, et al., 2017. Analysis of land cover and landscape change patterns in Ebinur Lake Wetland National Nature Reserve, China from 1972 to 2013 [J]. Wetlands Ecology and Management, 25(3): 619-637.
DOI URL |
| [11] |
ZORRILLA-MIRAS P, PALOMO I, GÓMEZ-BAGGETHUN E, et al., 2014. Effects of land-use change on wetland ecosystem services: a case study in the Doñana marshes (SW Spain)[J]. Landscape and Urban Planning, 122: 160-174.
DOI URL |
| [12] | 陈昆仑, 齐漫, 王旭, 等, 2019. 1995-2015年武汉城市湖泊景观生态安全格局演化[J]. 生态学报, 39(5): 1725-1734. |
| CHEN K L, QI M, WANG X, et al., 2019. Study of urban lake landscape ecological security pattern evolution in Wuhan, 1995-2015 [J]. Acta Ecologica Sinica, 39(5): 1725-1734. | |
| [13] | 程敏, 张丽云, 欧阳志云, 2017. 三个时期河北省滨海湿地景观格局及变化[J]. 湿地科学, 15(6): 824-828. |
| CHENG M, ZHANG L Y, OUYANG Z Y, 2017. Landscape patterns of coastal wetlands in Hebei province in 2000, 2005 and 2010 and their changes[J]. Wetland science, 15(6): 824-828. | |
| [14] | 范强, 杜婷, 杨俊, 等, 2014. 1982-2012年南四湖湿地景观格局演变分析[J]. 资源科学, 36(4): 865-873. |
| FAN Q, DU T, YANG J, et al., 2014. Landscape pattern changes for Nansihu Wetland from 1982 to 2012 [J]. Resources Science, 36(4): 865-873. | |
| [15] | 宫鹏, 牛振国, 程晓, 等, 2010. 中国1990和2000基准年湿地变化遥感[J]. 中国科学: 地球科学, 40(6): 768-775. |
|
GONG P, NIU Z G, CHENG X, et al., 2010. China’s wetland change (1990-2000) determined by remote sensing[J]. Scientia Sinica Terrae, 40(6): 768-775.
DOI URL |
|
| [16] | 宫兆宁, 张翼然, 宫辉力, 等, 2011. 北京湿地景观格局演变特征与驱动机制分析[J]. 地理学报, 66(1): 77-88. |
| GONG Z N, ZHANG Y R, GONG H L, et al., 2011. Evolution of wetland landscape pattern and its driving factors in Beijing[J]. Acta Geographica Sinica, 66(1): 77-88. | |
| [17] | 顾行发, 李闽榕, 徐东华, 2017. 中国可持续发展遥感监测报告(2016)[M]. 北京: 社会科学文献出版社. |
| GU X F, LI M R, XU D H, 2017. Remote sensing monitoring report on sustainable development in China (2016)[M]. Beijing: Social sciences academic press. | |
| [18] | 国家林业局, 2015. 中国湿地资源: 海南卷[M]. 北京: 中国林业出版社. |
| State forestry administration, 2015. China wetland resources: Hainan volume[M]. Beijing: China forestry press. | |
| [19] | 洪佳, 卢晓宁, 王玲玲, 2016. 1973-2013年黄河三角洲湿地景观演变驱动力[J]. 生态学报, 36(4): 924-935. |
| HONG J, LU X N, WANG N N, 2016. Quantitative analysis of the factor driving evolution in the Yellow River Delta Wetland in the past 40 years[J]. Acta Ecologica Sinica, 36(4): 924-935. | |
| [20] | 雷金睿, 陈宗铸, 吴庭天, 等, 2019. 1989-2015年海口城市热环境与景观格局的时空演变及其相互关系[J]. 中国环境科学, 39(4): 1734-1743. |
| LEI J R, CHEN Z Z, WU T T, et al., 2019. Spatio-temporal evolution and interrelationship between thermal environment and landscape patterns of Haikou City, 1989-2015 [J]. China Environmental Science, 39(4): 1734-1743. | |
| [21] | 李传哲, 于福亮, 刘佳, 等, 2011. 近20年来黑河干流中游地区土地利用/覆被变化及驱动力定量研究[J]. 自然资源学报, 26(3): 353-363. |
| LI C Z, YU F L, LIU J, et al., 2011. Research on land use/cover change and its driving force in midstream of the Heihe mainstream basin during the past 20 years[J]. Journal of natural resources, 26(3): 353-363. | |
| [22] | 李儒, 朱博勤, 童晓伟, 等, 2017. 2002-2013年海南东寨港自然保护区湿地变化分析[J]. 国土资源遥感, 29(3): 149-155. |
| LI R, ZHU B Q, TONG X W, et al., 2017. Change analysis in Hainan Dongzhai Wetland Reserve based on remote sensing data obtained during 2002-2013 [J]. Remote Sensing for Land and Resources, 29(3): 149-155. | |
| [23] | 李悦, 袁若愚, 刘洋, 等, 2019. 基于综合权重法的青岛市湿地生态安全评价[J]. 生态学杂志, 38(3): 847-855. |
| LI Y, YUAN R Y, LIU Y, et al., 2019. Ecological security evaluation of wetlands in Qingdao -based on the comprehensive weighting method[J]. Chinese Journal of Ecology, 38(3): 847-855. | |
| [24] |
刘吉平, 董春月, 盛连喜, 等, 2016. 1955-2010年小三江平原沼泽湿地景观格局变化及其对人为干扰的响应[J]. 地理科学, 36(6): 879-887.
DOI |
| LIU J P, DONG C Y, SHENG L X, et al., 2016. Landscape pattern change of the marsh and its response to human disturbance in the Small Sanjiang Plain, 1955-2010 [J]. Scientia Geographica Sinica, 36(6): 879-887. | |
| [25] | 卢晓宁, 黄玥, 洪佳, 等, 2018. 基于Landsat的黄河三角洲湿地景观时空格局演变[J]. 中国环境科学, 38(11): 4314-4324. |
| LU X N, HUANG Y, HONG J, et al., 2018. Spatial and temporal variations in wetland landscape patterns in the Yellow River Delta based on Landsat images[J]. China Environmental Science, 38(11): 4314-4324. | |
| [26] | 吕金霞, 蒋卫国, 王文杰, 等, 2018. 近30年来京津冀地区湿地景观变化及其驱动因素[J]. 生态学报, 38(12): 4492-4503. |
| LV J X, JIANG W G, WANG W J, et al., 2018. Wetland landscape pattern change and its driving forces in Beijing-Tianjin-Hebei region in recent 30 years[J]. Acta Ecologica Sinica, 38(12): 4492-4503. | |
| [27] | 牛振国, 张海英, 王显威, 等, 2012. 1978-2008年中国湿地类型变化[J]. 科学通报, 57(16): 1400-1411. |
| NIU Z G, ZHANG H Y, WANG X W, et al., 2012. Mapping wetland changes in China between 1978 and 2008[J]. Chinese Science Bulletin, 57(16): 1400-1411. | |
| [28] | 隋燕, 张丽, 穆晓东, 等, 2018. 海南岛海岸线变迁遥感监测与分析[J]. 海洋学研究, 36(2): 36-43. |
| SUI Y, ZHANG L, MU X D, et al., 2018. Coastline change monitoring and analysis with remote sensing in Hainan Island[J]. Journal of Marine Sciences, 36(2): 36-43. | |
| [29] | 万智巍, 连丽聪, 贾玉连, 等, 2018. 近百年来鄱阳湖南部湿地景观生态格局演变[J]. 生态环境学报, 27(9): 1682-1687. |
| WAN Z W, LIAN L C, JIA Y L, et al., 2018. Landscape Ecological Pattern Changes of Wetland in South Poyang Lake in the Past 100 Years[J]. Ecology and Environmental Sciences, 27(9): 1682-1687. | |
| [30] | 王泉泉, 王行, 张卫国, 等, 2019. 滇西北高原湿地景观变化与人为、自然因子的相关性[J]. 生态学报, 39(2): 726-738. |
| WANG Q Q, WANG H, ZHANG W G, et al., 2019. The correlations between wetland landscape and social-natural factors on Northwestern Yunnan Plateau[J]. Acta Ecologica Sinica, 39(2): 726-738. | |
| [31] | 魏帆, 韩广轩, 张金萍, 等, 2018. 1985-2015年围填海活动影响下的环渤海滨海湿地演变特征[J]. 生态学杂志, 37(5): 1527-1537. |
| WEI F, HAN G X, ZHANG J P, et al., 2018. Evolution of coastal wetlands under the influence of sea reclamation in Bohai Rim during 1985-2015 [J]. Chinese Journal of Ecology, 37(5): 1527-1537. | |
| [32] | 邬建国, 2007. 景观生态学——格局、过程、尺度与等级[M]. 第2版. 北京: 高等教育出版社. |
| WU J G, 2007. Landscape ecology - pattern, process, scale and rank[M]. 2nd edition. Beijing: Higher education press. | |
| [33] | 吴文挺, 田波, 周云轩, 等, 2016. 中国海岸带围垦遥感分析[J]. 生态学报, 36(16): 5007-5016. |
| WU W T, TIAN B, ZHOU Y X, et al., 2016. The trends of coastal reclamation in China in the past three decades[J]. Acta Ecologica Sinica, 36(16): 5007-5016. | |
| [34] | 徐晓龙, 王新军, 朱新萍, 等, 2018. 1996-2015年巴音布鲁克天鹅湖高寒湿地景观格局演变分析[J]. 自然资源学报, 33(11): 1897-1911. |
|
XU X L, WANG X J, ZHU X P, et al., 2018. Landscape Pattern changes in alpine wetland of Bayanbulak Swan lake during 1996-2015 [J]. Journal of Natural Resources, 33(11): 1897-1911.
DOI URL |
|
| [35] | 徐晓然, 谢跟踪, 邱彭华, 2018. 1964-2015年海南省八门湾红树林湿地及其周边土地景观动态分析[J]. 生态学报, 38(20): 7458-7468. |
| XU X R, XIE G Z, QIU P H, 2018. Dynamic analysis of landscape changes in Bamen port and the surrounding lands of Hainan Province from 1964 to 2015 [J]. Acta Ecologica Sinica, 38(20): 7458-7468. | |
| [36] | 易凤佳, 李仁东, 常变蓉, 等, 2016. 2000-2010年汉江流域湿地动态变化及其空间趋向性[J]. 长江流域资源与环境, 25(9): 1412-1420. |
| YI F J, LI R D, CHANG B R, et al., 2016. Dynamic change analysis of wetland and its spatial temporal trend in Hanjiang basin from 2000 to 2010 [J]. Resources and Environment in the Yangtze Basin, 25(9): 1412-1420. | |
| [37] | 张猛, 曾永年, 2018. 长株潭城市群湿地景观时空动态变化及驱动力分析[J]. 农业工程学报, 34(1): 241-249. |
| ZHANG M, ZENG Y N, 2018. Temporal and spatial dynamic changes and driving forces analysis of wetland landscape of Chang-Zhu-Tan urban agglomeration[J]. Transactions of the Chinese Society of Agricultural Engineering, 34(1): 241-249. | |
| [38] | 甄佳宁, 廖静娟, 沈国状, 2019. 1987以来海南省清澜港红树林变化的遥感监测与分析[J]. 湿地科学, 17(1): 44-51. |
| ZHEN J N, LIAO J J, SHEN G Z, 2019. Remote sensing monitoring and analysis on the dynamics of mangrove forests in Qinglan Habor of Hainan Province since 1987 [J]. Wetland science, 17(1): 44-51. | |
| [39] | 邹发生, 宋晓军, 江海声, 等, 1999. 海南岛的湿地类型及其特点[J]. 热带地理, 19(3): 204-207. |
| ZOU F S, SONG X J, JIANG H S, et al., 1999. Types and characteristics of the wetland of Hainan Island[J]. Tropical Geography, 19(3): 204-207. |
| [1] | 董洁芳, 邓椿, 张仲伍. 渭河流域PM2.5时空演化及人口暴露风险[J]. 生态环境学报, 2023, 32(6): 1078-1088. |
| [2] | 巫晨煜, 许帆帆, 魏士博, 樊晶晶, 刘观鹏, 王坤. 渭河流域地表植被覆盖对气候变化的响应研究[J]. 生态环境学报, 2023, 32(5): 835-844. |
| [3] | 李梦华, 韩颖娟, 赵慧, 王云霞. 基于地理探测器的宁夏植被覆盖度时空变化特征及其驱动因子分析[J]. 生态环境学报, 2022, 31(7): 1317-1325. |
| [4] | 魏小锋, 韩红, 闫学军, 王在峰, 李圣增, 田勇, 梁第, 马明亮, 张桂芹. 基于卫星遥感与CMB模型的济南市冬季重污染过程PM2.5溯源分析[J]. 生态环境学报, 2022, 31(6): 1175-1183. |
| [5] | 高思琦, 董国涛, 蒋晓辉, 聂桐, 郭欣伟, 党素珍, 李心宇, 李昊洋. 黄河源植被覆盖度变化及空间分布自然驱动力分析[J]. 生态环境学报, 2022, 31(3): 429-439. |
| [6] | 聂桐, 董国涛, 蒋晓辉, 郭欣伟, 党素珍, 郑嘉昊, 李立缠, 王江. 榆林地区植被时空分异特征及其影响因素研究[J]. 生态环境学报, 2022, 31(1): 26-36. |
| [7] | 梁永春, 尹芳, 赵英芬, 刘磊. 基于Landsat 8影像的太湖生化需氧量遥感反演[J]. 生态环境学报, 2021, 30(7): 1492-1502. |
| [8] | 王瑞璠, 魏倪彬, 张仓皓, 鲍甜甜, 刘健, 余坤勇, 王帆. 南方丘陵区林下植被覆盖度无人机多角度遥感测量[J]. 生态环境学报, 2021, 30(12): 2294-2302. |
| [9] | 马琼芳, 燕红, 李伟, 赵欣胜, 陈玲, 张超凡, 李杰玲. 吉林省湿地生态系统固碳和释氧服务功能分析[J]. 生态环境学报, 2021, 30(12): 2351-2359. |
| [10] | 雷金睿, 陈宗铸, 陈毅青, 陈小花, 李苑菱, 吴庭天. 1990—2018年海南岛湿地景观生态安全格局演变[J]. 生态环境学报, 2020, 29(2): 293-302. |
| 阅读次数 | ||||||
|
全文 |
|
|||||
|
摘要 |
|
|||||