生态环境学报 ›› 2022, Vol. 31 ›› Issue (8): 1667-1679.DOI: 10.16258/j.cnki.1674-5906.2022.08.019
王超越( ), 郭先华, 郭莉, 白丽芳, 夏利林, 王春博, 李廷真*()
收稿日期:2022-02-20
出版日期:2022-08-18
发布日期:2022-10-10
通讯作者:
* 李廷真(1978年生),男,博士,教授,主要从事生态环境污染防治研究。E-mail: litingzhen@163.com作者简介:王超越(1997年生),男,硕士研究生,研究方向为国土空间与生态环境格局演变。E-mail: wangchaoyue0616@163.com
基金资助:
WANG Chaoyue(), GUO Xianhua, GUO Li, BAI Lifang, XIA Lilin, WANG Chunbo, LI Tingzhen*()
Received:2022-02-20
Online:2022-08-18
Published:2022-10-10
摘要:
基于“双碳”战略背景下,探究城市群土地利用覆被变化与生态系统碳储量时空变化之间的关系,以期为城市群区域碳平衡、国土空间规划和生态系统的可持续发展提供一定的借鉴。以呼包鄂榆城市群为例,选取多期土地利用数据并确定相关驱动因子,基于FLUS-InVEST模型,在明确该城市群2000—2020年土地利用覆被变化规律的基础上,分别模拟预测2030年呼包鄂榆城市群在自然发展和生态保护两种情景下土地利用空间格局,并评估两种情景下碳储量及其时空动态变化特征。结果表明:2000—2020年呼包鄂榆城市群林地、水域和建设用地面积持续增加,耕地、草地和未利用地的面积持续减少,20年间城市群碳储量呈减少趋势,总体减少8.416×10⁶ t。与自然发展情景相比,生态保护情景下2030年草地、林地和水域面积得到了增长,耕地与未利用地持续减少,建设用地面积受到了限制,生态空间效应得到体现。2030年,自然发展情景与生态保护情景下的城市群碳储量较2020年分别减少77.065×10⁶ t和68.031×10⁶ t,生态保护情景下土地利用变化碳储量稳定性显著高于自然发展情景,因此,生态保护情景下的呼包鄂榆城市群土地利用能综合统筹各地类功能,减缓碳储量损失,对区域国土空间优化具有重要意义。
中图分类号:
王超越, 郭先华, 郭莉, 白丽芳, 夏利林, 王春博, 李廷真. 基于FLUS-InVEST的西北地区土地利用变化及其对碳储量的影响——以呼包鄂榆城市群为例[J]. 生态环境学报, 2022, 31(8): 1667-1679.
WANG Chaoyue, GUO Xianhua, GUO Li, BAI Lifang, XIA Lilin, WANG Chunbo, LI Tingzhen. Land Use Change and Its Impact on Carbon Storage in Northwest China Based on FLUS-Invest: A Case Study of Hu-Bao-Er-Yu Urban Agglomeration[J]. Ecology and Environment, 2022, 31(8): 1667-1679.
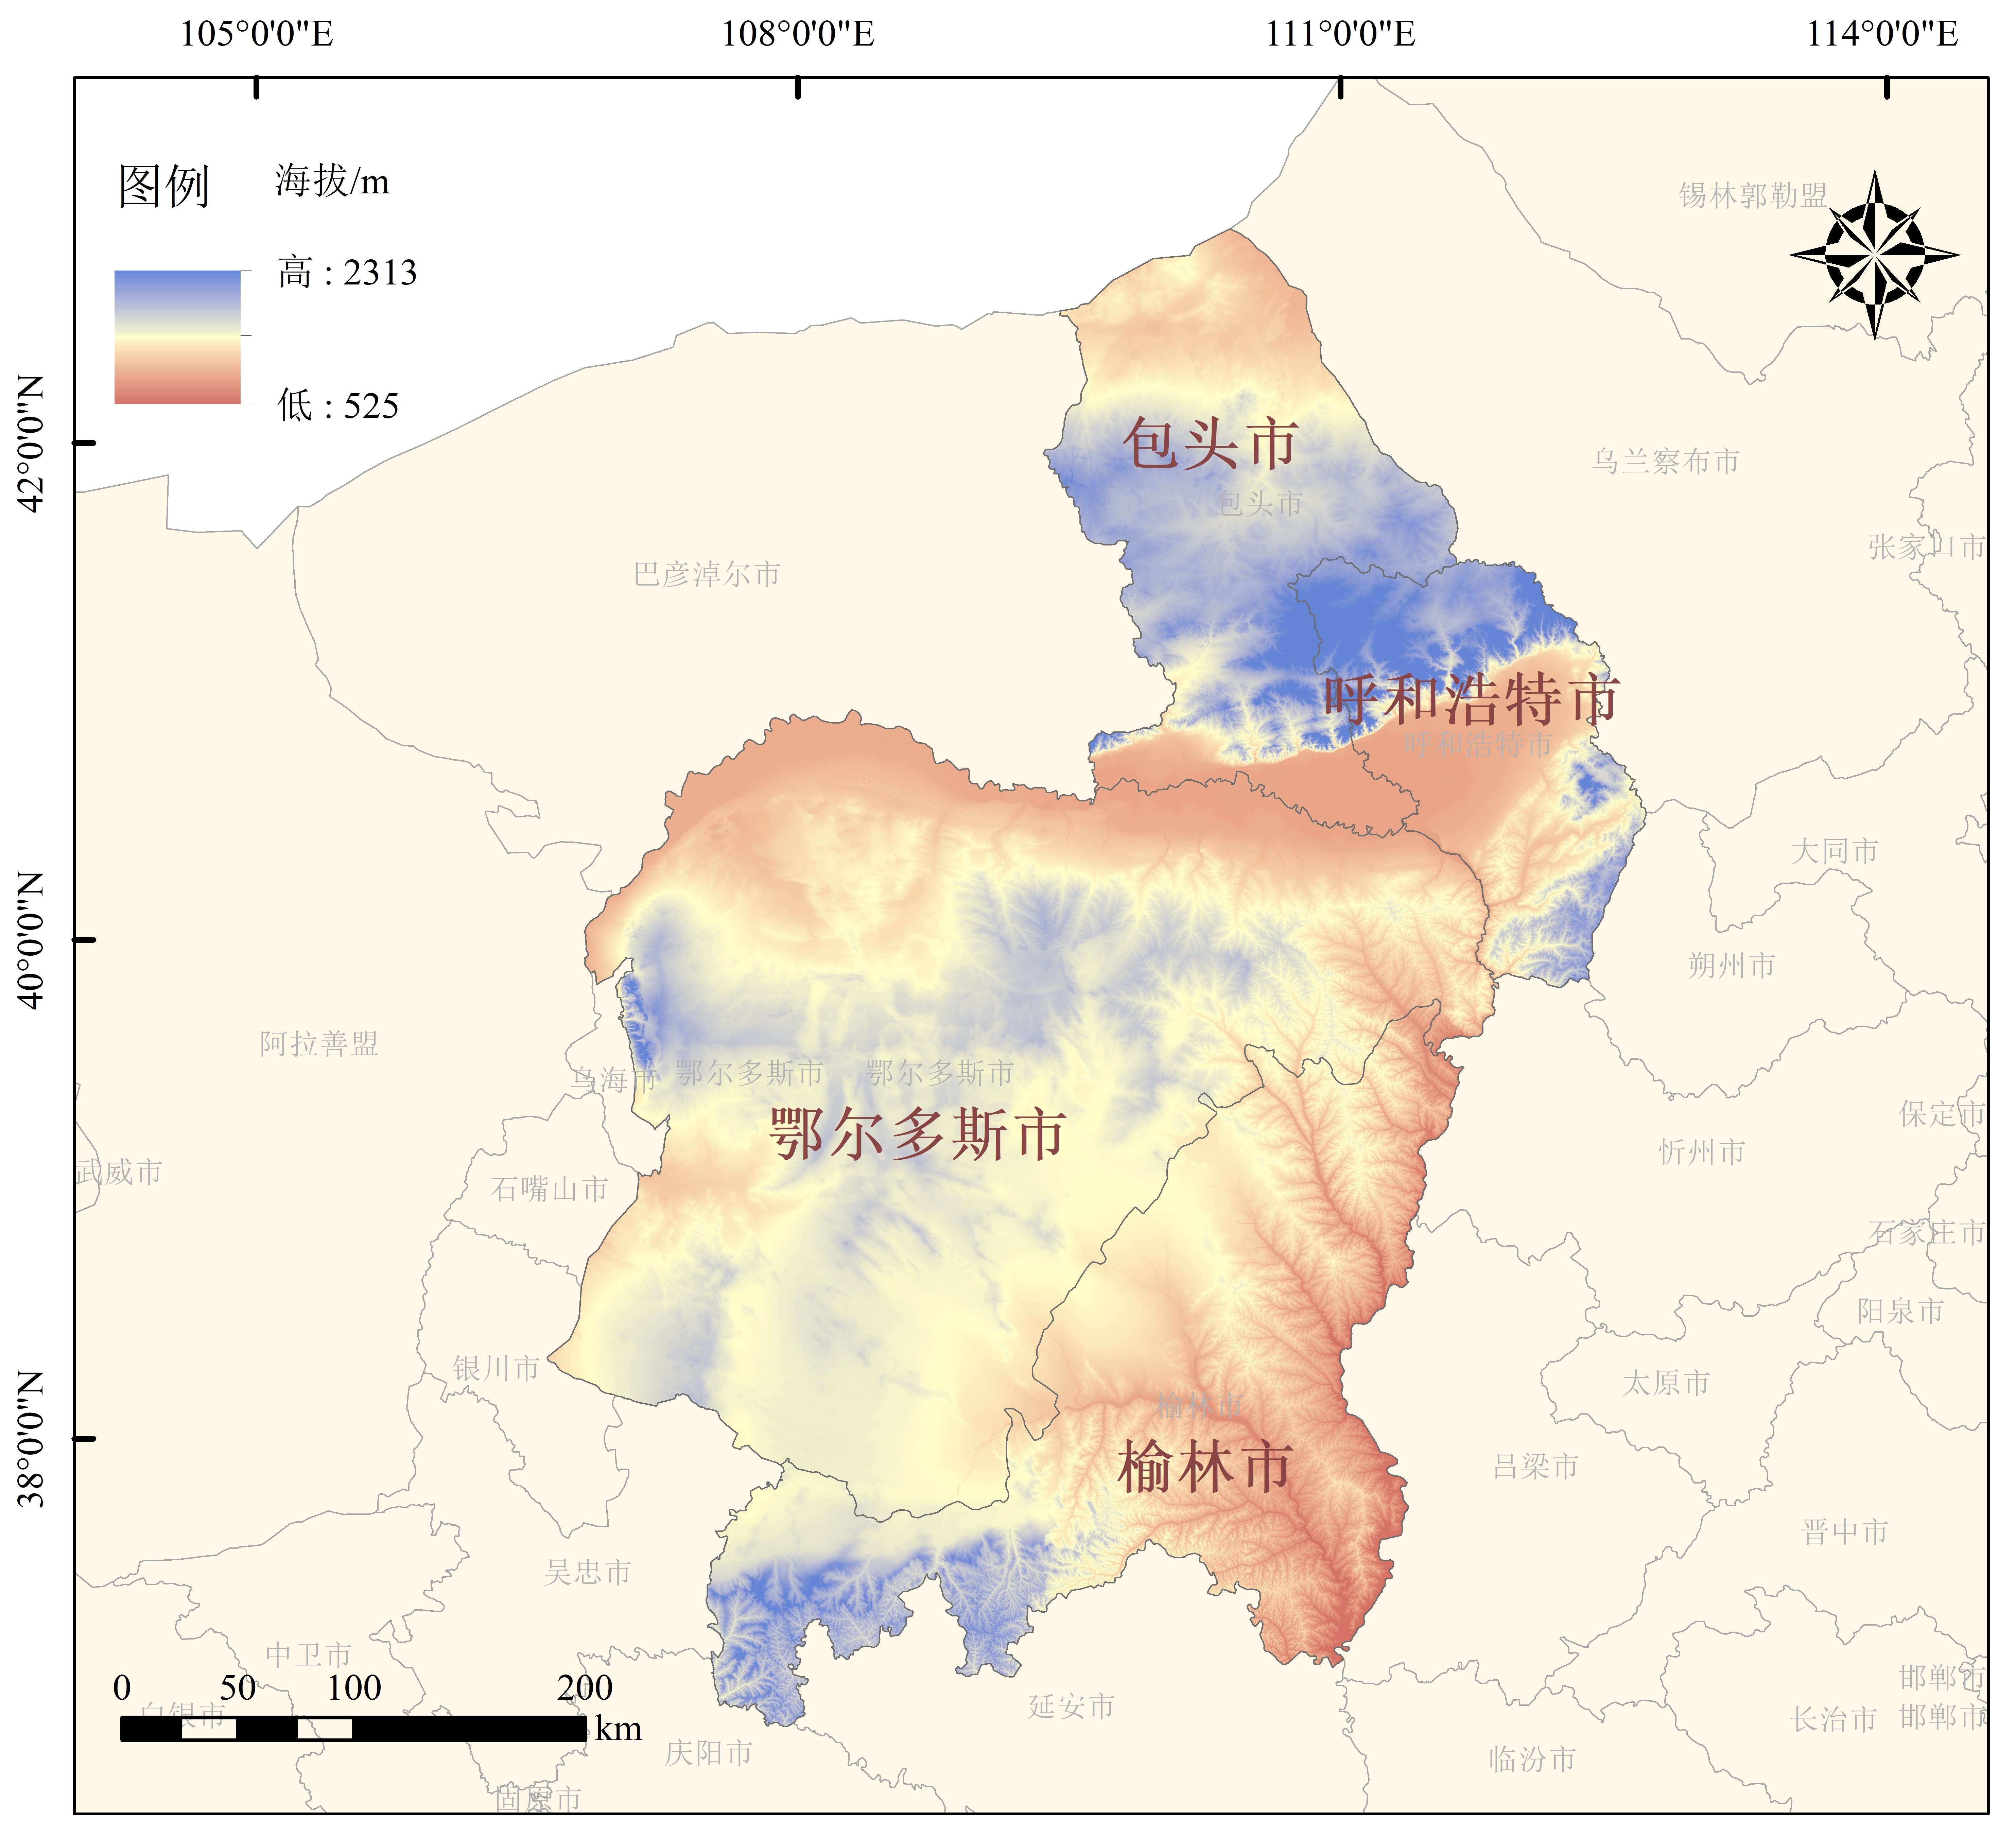
图1 呼包鄂榆城市群区位
Figure 1 Hu-Bao-Er-Yu urban agglomeration location

图2 呼包鄂榆城市群土地利用驱动因子
Figure 2 Study the driving factors of land use in regional urban agglomerations
| 土地利用类型 Land use type | 耕地 Cultivated land | 林地 Forest | 草地 Grassland | 水域 Water | 建设用地 Construction land | 未利用地 Unused land |
|---|---|---|---|---|---|---|
| 自然情景邻域因子 Natural scene neighborhood factor | 0.40 | 0.75 | 0.30 | 0.80 | 0.95 | 0.50 |
| 生态情景邻域因子 Ecological scene neighborhood factor | 0.70 | 0.50 | 0.20 | 0.60 | 0.95 | 0.60 |
表1 邻域因子参数
Table 1 Neighborhood factor parameters
| 土地利用类型 Land use type | 耕地 Cultivated land | 林地 Forest | 草地 Grassland | 水域 Water | 建设用地 Construction land | 未利用地 Unused land |
|---|---|---|---|---|---|---|
| 自然情景邻域因子 Natural scene neighborhood factor | 0.40 | 0.75 | 0.30 | 0.80 | 0.95 | 0.50 |
| 生态情景邻域因子 Ecological scene neighborhood factor | 0.70 | 0.50 | 0.20 | 0.60 | 0.95 | 0.60 |
| 土地利用类型 Land use type | 耕地 Cultivated land | 林地 Forest | 草地 Grassland | 水域 Water | 建设用地 Construction land | 未利用地 Unused land |
|---|---|---|---|---|---|---|
| 耕地 Cultivated land | 1 | 1 | 1 | 1 | 1 | 1 |
| 林地 Forest | 1 | 1 | 1 | 1 | 1 | 1 |
| 草地 Grassland | 1 | 1 | 1 | 1 | 1 | 1 |
| 水域 Water | 1 | 1 | 1 | 1 | 1 | 1 |
表2 自然发展情景成本矩阵
Table 2 Cost matrix of natural development scenario
| 土地利用类型 Land use type | 耕地 Cultivated land | 林地 Forest | 草地 Grassland | 水域 Water | 建设用地 Construction land | 未利用地 Unused land |
|---|---|---|---|---|---|---|
| 耕地 Cultivated land | 1 | 1 | 1 | 1 | 1 | 1 |
| 林地 Forest | 1 | 1 | 1 | 1 | 1 | 1 |
| 草地 Grassland | 1 | 1 | 1 | 1 | 1 | 1 |
| 水域 Water | 1 | 1 | 1 | 1 | 1 | 1 |
| 土地利用类型 Land use type | 耕地 Cultivated land | 林地 Forest | 草地 Grassland | 水域 Water | 建设用地 Construction land | 未利用地 Unused land |
|---|---|---|---|---|---|---|
| 耕地 Cultivated land | 1 | 1 | 1 | 1 | 1 | 1 |
| 林地 Forest | 0 | 1 | 1 | 0 | 0 | 0 |
| 草地 Grassland | 0 | 1 | 1 | 0 | 0 | 0 |
| 水域 Water | 1 | 1 | 1 | 1 | 0 | 1 |
| 建设用地 Construction land | 0 | 1 | 1 | 0 | 1 | 0 |
表3 生态保护情景成本矩阵
Table 3 Scenario cost matrix of ecological protection
| 土地利用类型 Land use type | 耕地 Cultivated land | 林地 Forest | 草地 Grassland | 水域 Water | 建设用地 Construction land | 未利用地 Unused land |
|---|---|---|---|---|---|---|
| 耕地 Cultivated land | 1 | 1 | 1 | 1 | 1 | 1 |
| 林地 Forest | 0 | 1 | 1 | 0 | 0 | 0 |
| 草地 Grassland | 0 | 1 | 1 | 0 | 0 | 0 |
| 水域 Water | 1 | 1 | 1 | 1 | 0 | 1 |
| 建设用地 Construction land | 0 | 1 | 1 | 0 | 1 | 0 |
| 土地利用类型 Land use type | 地上碳密度 Above-ground carbon density | 地下碳密度 Underground carbon density | 土壤碳密度 Soil carbon density | 死亡有机物碳密度 Dead organic matter carbon density |
|---|---|---|---|---|
| 耕地 Cultivated land | 3.41 | 17.58 | 47.23 | 6.36 |
| 林地 Forest | 6.15 | 29.18 | 67.75 | 5.59 |
| 草地 Grassland | 2.33 | 19.79 | 48.82 | 1.73 |
| 水域 Water | 2.37 | 3.95 | 5.95 | 1.50 |
| 建设用地 Construction land | 1.89 | 2.42 | 6.78 | 0.00 |
表4 呼包鄂榆城市群不同土地利用类型的碳密度值
Table 4 Carbon density values of different land use types in the study area t∙hm-2
| 土地利用类型 Land use type | 地上碳密度 Above-ground carbon density | 地下碳密度 Underground carbon density | 土壤碳密度 Soil carbon density | 死亡有机物碳密度 Dead organic matter carbon density |
|---|---|---|---|---|
| 耕地 Cultivated land | 3.41 | 17.58 | 47.23 | 6.36 |
| 林地 Forest | 6.15 | 29.18 | 67.75 | 5.59 |
| 草地 Grassland | 2.33 | 19.79 | 48.82 | 1.73 |
| 水域 Water | 2.37 | 3.95 | 5.95 | 1.50 |
| 建设用地 Construction land | 1.89 | 2.42 | 6.78 | 0.00 |
| 土地利用类型 Land use type | 2000年 | 2010年 | 2020年 | 面积变化值 Area change/km2 | |||||
|---|---|---|---|---|---|---|---|---|---|
| 面积 Area/km2 | 比例 Proportion/% | 面积 Area/km2 | 比例 Proportion/% | 面积 Area/km2 | 比例 Proportion/% | ||||
| 耕地 Cultivated land | 32674 | 18.70 | 32132 | 18.39 | 31249 | 17.89 | -1425 | ||
| 林地 Forest | 7328 | 4.20 | 7756 | 4.44 | 8448 | 4.84 | 1120 | ||
| 草地 Grassland | 96807 | 55.42 | 97392 | 55.75 | 95257 | 54.53 | -1550 | ||
| 水域 Water | 3402 | 1.95 | 3172 | 1.82 | 3426 | 1.96 | 19 | ||
| 建设用地 Construction land | 2674 | 1.53 | 3859 | 2.21 | 5154 | 2.95 | 2480 | ||
| 未利用地 Unused land | 31796 | 18.20 | 30370 | 17.39 | 31147 | 17.83 | -649 | ||
表5 2000—2020年呼包鄂榆城市群各期土地利用类型面积及比例
Table 5 Area and proportion of land use types in the study area during 2000-2020
| 土地利用类型 Land use type | 2000年 | 2010年 | 2020年 | 面积变化值 Area change/km2 | |||||
|---|---|---|---|---|---|---|---|---|---|
| 面积 Area/km2 | 比例 Proportion/% | 面积 Area/km2 | 比例 Proportion/% | 面积 Area/km2 | 比例 Proportion/% | ||||
| 耕地 Cultivated land | 32674 | 18.70 | 32132 | 18.39 | 31249 | 17.89 | -1425 | ||
| 林地 Forest | 7328 | 4.20 | 7756 | 4.44 | 8448 | 4.84 | 1120 | ||
| 草地 Grassland | 96807 | 55.42 | 97392 | 55.75 | 95257 | 54.53 | -1550 | ||
| 水域 Water | 3402 | 1.95 | 3172 | 1.82 | 3426 | 1.96 | 19 | ||
| 建设用地 Construction land | 2674 | 1.53 | 3859 | 2.21 | 5154 | 2.95 | 2480 | ||
| 未利用地 Unused land | 31796 | 18.20 | 30370 | 17.39 | 31147 | 17.83 | -649 | ||
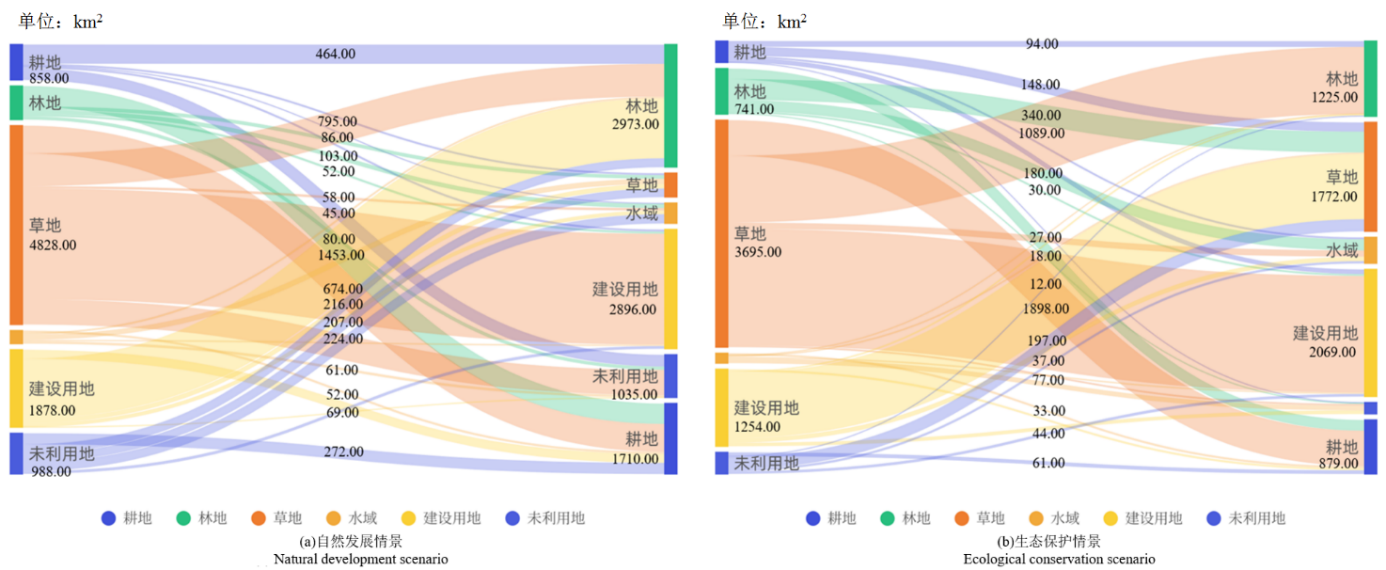
图3 2020—2030年两种典型情景下土地利用类型转移桑基图
Figure 3 Sankey map of land use type transfer under two typical scenarios, 2020-2030
| 土地利用类型 Land use type | 2020年 | 2030年 | 2020-2030年变化 Change from 2020 to 2030 | ||||||||||
|---|---|---|---|---|---|---|---|---|---|---|---|---|---|
| 自然发展情景 Natural development | 生态保护情景 Ecological protection | 自然发展情景 Natural development | 生态保护情景Ecological protection | ||||||||||
| 面积 Area/km2 | 比例 Proportion/% | 面积 Area/km2 | 比例 Proportion/% | 面积 Area/km2 | 比例 Proportion/% | 面积 Area/km2 | 变化率 Rate/% | 面积 Area/km2 | 变化率Rate/% | ||||
| 耕地 Cultivated land | 31249 | 17.89 | 31321 | 17.93 | 29003 | 16.60 | 72 | 0.23 | -2246 | -7.19 | |||
| 林地 Forest | 8448 | 4.84 | 8521 | 4.88 | 8942 | 5.12 | 73 | 0.86 | 494 | 5.85 | |||
| 草地 Grassland | 95257 | 54.53 | 94741 | 54.24 | 97811 | 55.99 | -516 | -0.54 | 2554 | 2.68 | |||
| 水域 Water | 3426 | 1.96 | 3286 | 1.88 | 3683 | 2.11 | -140 | -4.09 | 257 | 7.50 | |||
| 建设用地 Construction land | 5154 | 2.95 | 5756 | 3.29 | 5218 | 2.99 | 602 | 11.68 | 64 | 1.24 | |||
| 未利用地 Unused land | 31147 | 17.83 | 31056 | 17.78 | 30024 | 17.19 | -91 | -0.29 | -1123 | -3.61 | |||
表6 2030年自然发展与生态保护情景下各地类面积及其与2020年比值
Table 6 Area of each region under the scenario of natural development and ecological protection in 2030 and its ratio to 2020
| 土地利用类型 Land use type | 2020年 | 2030年 | 2020-2030年变化 Change from 2020 to 2030 | ||||||||||
|---|---|---|---|---|---|---|---|---|---|---|---|---|---|
| 自然发展情景 Natural development | 生态保护情景 Ecological protection | 自然发展情景 Natural development | 生态保护情景Ecological protection | ||||||||||
| 面积 Area/km2 | 比例 Proportion/% | 面积 Area/km2 | 比例 Proportion/% | 面积 Area/km2 | 比例 Proportion/% | 面积 Area/km2 | 变化率 Rate/% | 面积 Area/km2 | 变化率Rate/% | ||||
| 耕地 Cultivated land | 31249 | 17.89 | 31321 | 17.93 | 29003 | 16.60 | 72 | 0.23 | -2246 | -7.19 | |||
| 林地 Forest | 8448 | 4.84 | 8521 | 4.88 | 8942 | 5.12 | 73 | 0.86 | 494 | 5.85 | |||
| 草地 Grassland | 95257 | 54.53 | 94741 | 54.24 | 97811 | 55.99 | -516 | -0.54 | 2554 | 2.68 | |||
| 水域 Water | 3426 | 1.96 | 3286 | 1.88 | 3683 | 2.11 | -140 | -4.09 | 257 | 7.50 | |||
| 建设用地 Construction land | 5154 | 2.95 | 5756 | 3.29 | 5218 | 2.99 | 602 | 11.68 | 64 | 1.24 | |||
| 未利用地 Unused land | 31147 | 17.83 | 31056 | 17.78 | 30024 | 17.19 | -91 | -0.29 | -1123 | -3.61 | |||

图4 2030年两种典型情景下呼包鄂榆城市群土地利用模拟预测图
Figure 4 Land use simulation forecast chart of urban agglomeration under two typical scenarios in 2030
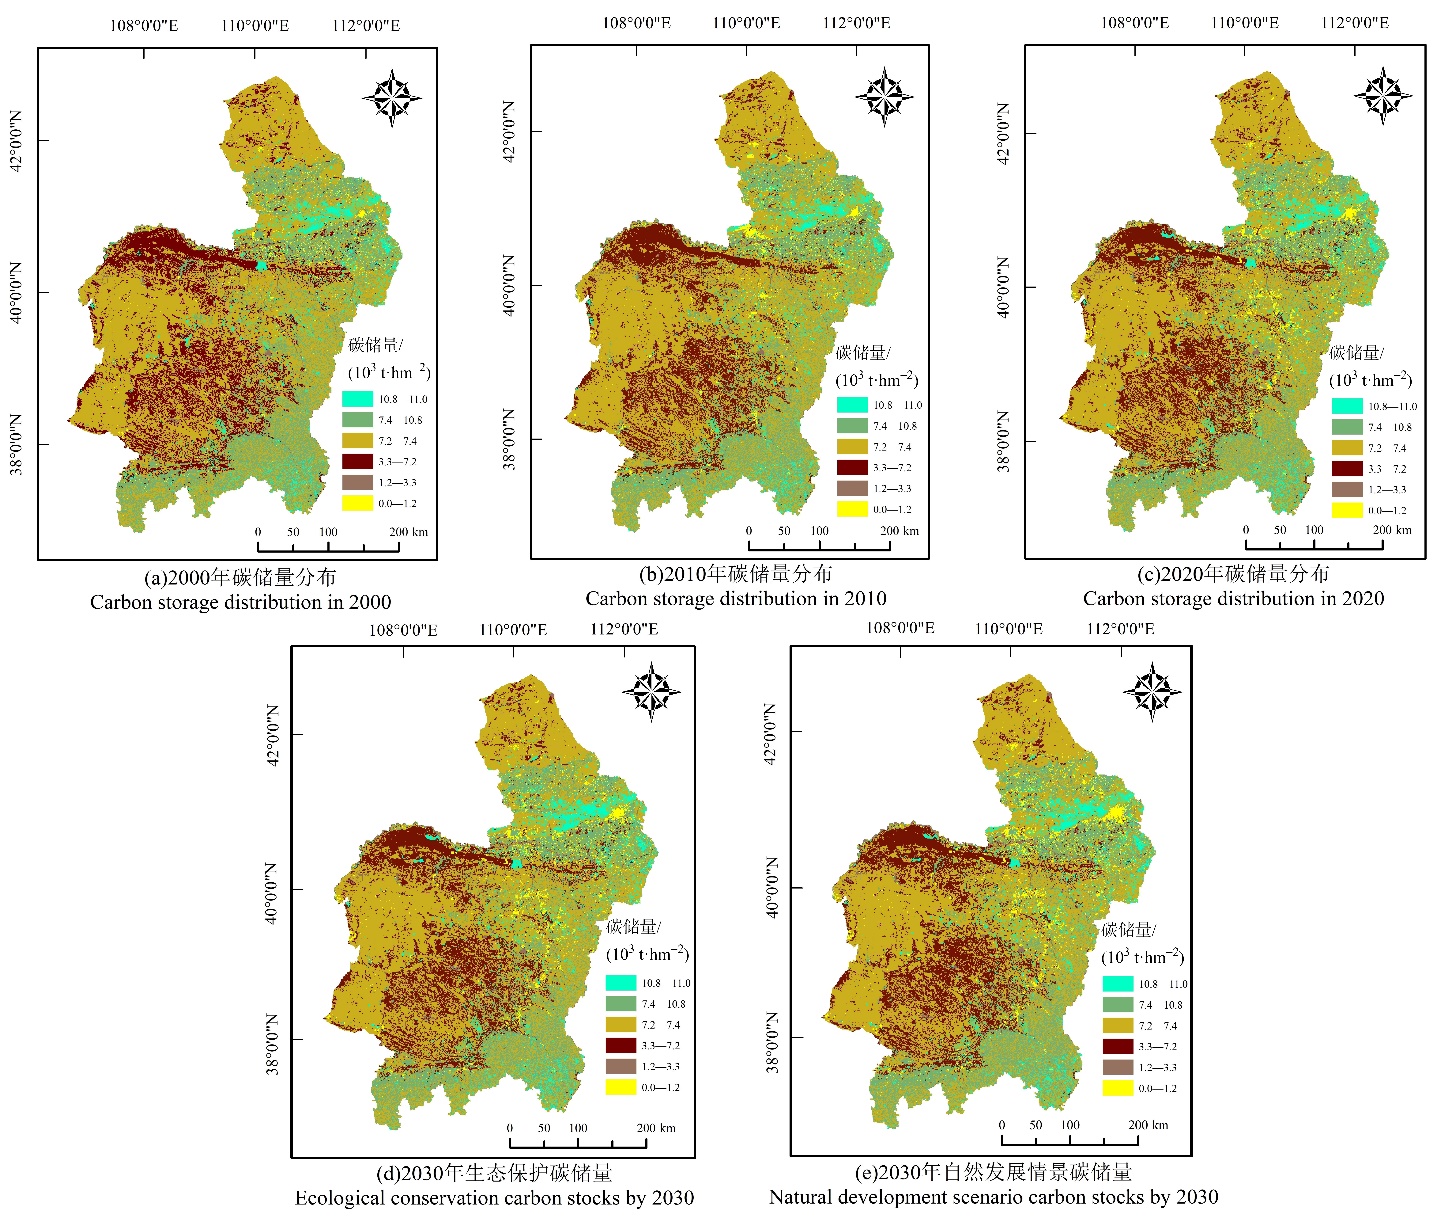
图5 各年份呼包鄂榆城市群碳储量空间格局分布图
Figure 5 The spatial pattern of carbon storage in regional urban agglomerations was studied in each year
| 土地利用类型 Land use type | 面积 Area/km2 | 碳储量变化 Change in carbon stock/(×106 t) | 总计 Total/(×106 t) | ||||||
|---|---|---|---|---|---|---|---|---|---|
| 转出 Converted from | 转入 Converted to | 自然发展 Natural development | 生态保护 Ecological protection | 自然发展 Natural development | 生态保护 Ecological protection | 自然发展 Natural development | 生态保护 Ecological protection | ||
| 耕地 Cultivated land | 林地 Forest | 464 | 94 | 1.962 | -0.587 | -15.132 | -17.878 | ||
| 草地 Grassland | 47 | 148 | -11.115 | -10.337 | |||||
| 水域 Water | 15 | 31 | -1.384 | -1.257 | |||||
| 建设用地 Construction land | 49 | 74 | -4.223 | -3.324 | |||||
| 未利用地 Unused land | 283 | 2 | -0.372 | -2.373 | |||||
| 林地 Forest | 耕地 Cultivated land | 494 | 173 | 3.832 | 0.376 | -1.717 | 1.250 | ||
| 草地 Grassland | 86 | 340 | -2.277 | 0.360 | |||||
| 水域 Water | 103 | 180 | -1.319 | 1.666 | |||||
| 建设用地 Construction land | 52 | 30 | -0.518 | -0.758 | |||||
| 未利用地 Unused land | 80 | 18 | -1.435 | -0.394 | |||||
| 草地 Grassland | 耕地 Cultivated land | 674 | 578 | -4.878 | -5.577 | -56.000 | -43.776 | ||
| 林地 Forest | 795 | 1089 | 1.132 | 3.013 | |||||
| 水域 Water | 58 | 102 | -2.412 | -1.344 | |||||
| 建设用地 Construction land | 2692 | 1898 | -27.207 | -21.517 | |||||
| 未利用地 Unused land | 609 | 28 | -22.635 | -18.351 | |||||
| 水域 Water | 耕地 Cultivated land | 52 | 33 | -0.036 | -0.070 | -0.095 | -0.347 | ||
| 林地 Forest | 45 | 3 | 0.041 | -0.017 | |||||
| 草地 Grassland | 127 | 25 | -0.026 | -0.171 | |||||
| 建设用地 Construction land | 34 | 23 | -0.037 | -0.058 | |||||
| 未利用地 Unused land | 61 | 77 | -0.037 | -0.031 | |||||
| 建设用地 Construction land | 耕地 Cultivated land | 218 | 34 | -0.162 | -0.367 | 0.627 | -0.124 | ||
| 林地 Forest | 1453 | 27 | 1.54 | -0.038 | |||||
| 草地 Grassland | 113 | 1062 | -0.654 | 0.363 | |||||
| 水域 Water | 92 | 73 | 0.072 | 0.049 | |||||
| 未利用地 Unused land | 2 | 58 | -0.169 | -0.131 | |||||
| 未利用地 Unused land | 耕地 Cultivated land | 272 | 61 | 0.299 | -0.763 | -4.748 | -7.156 | ||
| 林地 Forest | 216 | 12 | -0.796 | -1.444 | |||||
| 草地 Grassland | 207 | 197 | -3.76 | -3.787 | |||||
| 水域 Water | 224 | 37 | 0.475 | -0.118 | |||||
| 建设用地 Construction land | 69 | 44 | -0.966 | -1.044 | |||||
| 总计 Total/(×106 t) | -77.065×10⁶ t | -68.031×10⁶ t | |||||||
表7 2020—2030年自然发展情景与生态保护情景下地类转换引起的碳储量变化
Table 7 Carbon storage change caused by land type conversion under natural development scenario and ecological protection scenario in 2020-2030
| 土地利用类型 Land use type | 面积 Area/km2 | 碳储量变化 Change in carbon stock/(×106 t) | 总计 Total/(×106 t) | ||||||
|---|---|---|---|---|---|---|---|---|---|
| 转出 Converted from | 转入 Converted to | 自然发展 Natural development | 生态保护 Ecological protection | 自然发展 Natural development | 生态保护 Ecological protection | 自然发展 Natural development | 生态保护 Ecological protection | ||
| 耕地 Cultivated land | 林地 Forest | 464 | 94 | 1.962 | -0.587 | -15.132 | -17.878 | ||
| 草地 Grassland | 47 | 148 | -11.115 | -10.337 | |||||
| 水域 Water | 15 | 31 | -1.384 | -1.257 | |||||
| 建设用地 Construction land | 49 | 74 | -4.223 | -3.324 | |||||
| 未利用地 Unused land | 283 | 2 | -0.372 | -2.373 | |||||
| 林地 Forest | 耕地 Cultivated land | 494 | 173 | 3.832 | 0.376 | -1.717 | 1.250 | ||
| 草地 Grassland | 86 | 340 | -2.277 | 0.360 | |||||
| 水域 Water | 103 | 180 | -1.319 | 1.666 | |||||
| 建设用地 Construction land | 52 | 30 | -0.518 | -0.758 | |||||
| 未利用地 Unused land | 80 | 18 | -1.435 | -0.394 | |||||
| 草地 Grassland | 耕地 Cultivated land | 674 | 578 | -4.878 | -5.577 | -56.000 | -43.776 | ||
| 林地 Forest | 795 | 1089 | 1.132 | 3.013 | |||||
| 水域 Water | 58 | 102 | -2.412 | -1.344 | |||||
| 建设用地 Construction land | 2692 | 1898 | -27.207 | -21.517 | |||||
| 未利用地 Unused land | 609 | 28 | -22.635 | -18.351 | |||||
| 水域 Water | 耕地 Cultivated land | 52 | 33 | -0.036 | -0.070 | -0.095 | -0.347 | ||
| 林地 Forest | 45 | 3 | 0.041 | -0.017 | |||||
| 草地 Grassland | 127 | 25 | -0.026 | -0.171 | |||||
| 建设用地 Construction land | 34 | 23 | -0.037 | -0.058 | |||||
| 未利用地 Unused land | 61 | 77 | -0.037 | -0.031 | |||||
| 建设用地 Construction land | 耕地 Cultivated land | 218 | 34 | -0.162 | -0.367 | 0.627 | -0.124 | ||
| 林地 Forest | 1453 | 27 | 1.54 | -0.038 | |||||
| 草地 Grassland | 113 | 1062 | -0.654 | 0.363 | |||||
| 水域 Water | 92 | 73 | 0.072 | 0.049 | |||||
| 未利用地 Unused land | 2 | 58 | -0.169 | -0.131 | |||||
| 未利用地 Unused land | 耕地 Cultivated land | 272 | 61 | 0.299 | -0.763 | -4.748 | -7.156 | ||
| 林地 Forest | 216 | 12 | -0.796 | -1.444 | |||||
| 草地 Grassland | 207 | 197 | -3.76 | -3.787 | |||||
| 水域 Water | 224 | 37 | 0.475 | -0.118 | |||||
| 建设用地 Construction land | 69 | 44 | -0.966 | -1.044 | |||||
| 总计 Total/(×106 t) | -77.065×10⁶ t | -68.031×10⁶ t | |||||||
| [1] |
BAGSTAD K J, SEMMENS D J, WAAGE S, et al., 2013. A comparative assessment of decision-support tools for ecosystem services quantification and valuation[J]. Ecosystem Service, 5: 27-39.
DOI URL |
| [2] |
HAN Y W, ZHANG S, YIN L H, 2019. Quantifying the carbon storage capacity and its spatial distribution patterns of green spaces in a metropolitan area: A case study of Seoul, South Korea[J]. Landscape Architecture Frontiers, 7(2): 55-65.
DOI |
| [3] | HOUGHTON R A, 2003. Revised estimates of the annual net flux of carbon to the atmosphere from changes in land use and land management 1850-2000 [J]. Tellus, 55(2): 378-390. |
| [4] |
LIU X P, LIANG X, LI X, et al., 2017. A future land use simulation model (FLUS) for simulating multiple land use scenarios by coupling human and natural effects[J]. Landscape and Urban Planning, 168: 94-116.
DOI URL |
| [5] |
MCGUIRE A D, MELILLO J M, JOYCE L A, et al., 1992. Interactions between carbon and nitrogen dynamics in estimating net primary productivity for potential vegetation in North America[J]. Global Biogeochemical Cycles, 6(2): 101-124.
DOI URL |
| [6] |
NEILSON R P, 1995. A model for predicting continental-scale vegetation distribution and water balance[J]. Ecological Applications, 5(2): 362-385.
DOI URL |
| [7] |
NELSON E, MENDOZA G, REGETZ J, et al., 2009. Modeling multiple ecosystem services, biodiversity conservation, commodity production, and tradeoffs at landscape scales[J]. Frontiers in Ecology and the Environment, 7(1): 4-11.
DOI URL |
| [8] | OUBRAHIM H, BOULMANE M, BAKKKER M R, et al., 2015. Carbon storage in degraded cork oak (Quercus suber) forests on flat lowlands in Morocco[J]. Forest-Biogeosciences and Forestry, 9(1): 125-137. |
| [9] |
PAGIOLA S, 2008. Payments for environmental services in Costa Rica[J]. Ecological Economics, 65(4): 712-724.
DOI URL |
| [10] |
PIAO S L, FANG J Y, CIAIS P, et al., 2009. The carbon balance of terrestrial ecosystems in China[J]. Nature, 458(7241): 1009-1013.
DOI URL |
| [11] |
POSNE R S, VERUTES G, KOH I, et al., 2016. Global use of ecosystem service models[J]. Ecosystem Services, 17: 131-141.
DOI URL |
| [12] |
SITCH S, SMITH B, PRENTICE CI, et al., 2003. Evaluation of ecosystem dynamics, plant geography and terrestrial carbon cycling in the LPJ dynamic global vegetation model[J]. Global Change Biology, 9(2): 161-185.
DOI URL |
| [13] |
YU X H, LIANG Z F, FAN J J, et al., 2021. Spatial decomposition of city level CO2 emission changes in Beijing-Tianjin-Hebei[J]. Journal of Cleaner Production, DOI: 10.1016/j.jclepro.2021.126613.
DOI |
| [14] | 曹帅, 金晓斌, 杨绪红, 等, 2019. 耦合MOP与GeoSOS-FLUS模型的县级土地利用结构与布局复合优化[J]. 自然资源学报, 34(6): 1171-1185. |
|
CAO S, JIN X B, YANG X H, et al., 2019. Coupled MOP and GeoSOS-FLUS models research on optimization of land use structure and layout in Jintan district[J]. Journal of Natural Resources, 34(6): 1171-1185.
DOI URL |
|
| [15] | 曹世雄, 刘玉洁, 苏蔚, 等, 2018. 中国陆地生态系统服务净价值评估[J]. 中国科学: 地球科学, 48(3): 331-339. |
| CAO S X, LIU Y J, SU W, et al., 2018. The net ecosystem services value in mainland China[J]. Science China Earth Sciences, 48(3): 331-339. | |
| [16] | 方创琳, 2020. 黄河流域城市群形成发育的空间组织格局与高质量发展[J]. 经济地理, 40(6): 1-8. |
|
FANG C L, 2020. Spatial organization pattern and high-quality development of urban agglomeration in the Yellow River Basin[J]. Economic Geography, 40(6): 1-8.
DOI URL |
|
| [17] |
方创琳, 周成虎, 顾朝林, 等, 2016. 特大城市群地区城镇化与生态环境交互耦合效应解析的理论框架及技术路径[J]. 地理学报, 71(4): 531-550.
DOI |
|
FANG C L, ZHOU C H, GU C L, et al., 2016. Theoretical analysis of interactive coupled effects between urbanization and eco-environment in mega-urban agglomerations[J]. Acta Geographica Sinica, 71(4): 531-550.
DOI |
|
| [18] |
高周冰, 王晓瑞, 隋雪艳, 等, 2021. 基于FLUS和InVEST模型的南京市生境质量多情景预测[J]. 农业资源与环境学报, DOI: 10.13254/j.jare.2021.0411.
DOI |
|
GAO Z B, WANG X R, SUI X Y, et al., 2021. Multi-scenario prediction of habitat quality in Nanjing based on FLUS and InVEST models[J]. Journal of Agricultural Resources and Environment, DOI: 10.13254/j.jare.2021.0411.
DOI |
|
| [19] | 蒋欣阳, 2017. 锡林郭勒盟草原景观的时空动态和景观服务的权衡分析[D]. 呼和浩特: 内蒙古大学. |
| JIANG X Y, 2017. Spatial-temporal dynamics of grassland landscape and trade-offs of landscape services in Xilingol League[D]. Hohhot: Inner Mongolia University. | |
| [20] | 柯新利, 唐兰萍, 2019. 城市扩张与耕地保护耦合对陆地生态系统碳储量的影响--以湖北省为例[J]. 生态学报, 39(2): 672-683. |
| [21] | KE X L, TANG L P, 2019. Impact of cascading processes of urban expansion and cropland reclamation on the ecosystem of a carbon storage service in Hubei Province, China[J]. Acta Ecologica Sinica, 39(2): 672-683. |
| [22] |
李建豹, 黄贤金, 孙树臣, 等, 2019. 长三角地区城市土地与能源消费CO2排放的时空耦合分析[J]. 地理研究, 38(9): 2188-2201.
DOI |
|
LI J B, HUANG X J, SUN S C, et al., 2019. Spatio-temporal coupling analysis of urban land and carbon dioxide emissions from energy consumption in the Yangtze River Delta region[J]. Geographical Research, 38(9): 2188-2201.
DOI |
|
| [23] | 刘冠, 李国庆, 李洁, 等, 2021. 基于InVEST模型的1999-2016年麻塔流域碳储量变化及空间格局研究[J]. 干旱区研究, 38(1): 267-274. |
| LIU G, LI G Q, LI J, et al., 2021. Study on change in carbon storage and its spatial pattern in Mata Watershed from 1999 to 2016 based on InVEST model[J]. Arid Zone Research, 38(1): 267-274. | |
| [24] | 刘孟竹, 王彦芳, 裴宏伟, 2021. 退耕还林(草)背景下中国北方农牧交错带土地利用及碳储量变化[J]. 中国沙漠, 41(1): 174-182. |
| LIU M Z, WANG Y F, PEI H W, 2021. The changes of land use and carbon storage in the northern farming-pastoral ecotone under the background of returning farmland to forest (grass)[J]. Journal of Desert Research, 41(1): 174-182. | |
| [25] | 刘晓娟, 黎夏, 梁迅, 等, 2019. 基于FLUS-InVEST模型的中国未来土地利用变化及其对碳储量影响的模拟[J]. 热带地理, 39(3): 397-409. |
|
LIU X J, LI X, LIANG X, et al., 2019. Simulating the change of terrestrial carbon storage in China based on the FLUS-InVEST model[J]. Tropical Geography, 39(3): 397-409.
DOI |
|
| [26] | 刘玉斌, 王晓利, 侯西勇, 等, 2020. 四个时期和模拟情景下2025年黄河三角洲的土地利用格局和生态系统服务价值评估[J]. 湿地科学, 18(4): 424-436. |
| LIU Y B, WANG X L, HOU X Y, et al., 2020. Land use pattern and evaluation of ecosystem service values of Yellow River Delta for 4 periods and in 2025 under simulation scenarios[J]. Wetl and Science, 18(4): 424-436. | |
| [27] | 卢涵宇, 郭彩, 张涛, 等, 2020. 基于CA-Markov的盘州市土地利用变化研究[J]. 广西大学学报(自然科学版), 45(3): 550-557. |
| LU H Y, GUO C, ZHANG T, et al., 2020. Study on land use change of Panzhou city based on CA-Markov[J]. Journal of Guangxi University (Natural Science Edition), 45(3): 550-557. | |
| [28] | 欧阳晓, 贺清云, 朱翔, 2020. 多情景下模拟城市群土地利用变化对生态系统服务价值的影响--以长株潭城市群为例[J]. 经济地理, 40(1): 93-102. |
|
OU Y X, HE Q Y, ZHU X, 2020. Simulation of impacts of urban agglomeration land use change on ecosystem services value under multi-scenarios: Case study in Changsha-Zhuzhou-Xiangtan urban agglomeration[J]. Economic Geography, 40(1): 93-102.
DOI URL |
|
| [29] | 苏迎庆, 刘庚, 赵景波, 等, 2021. 基于FLUS模型的汾河流域生态空间多情景模拟预测[J]. 干旱区研究, 38(4): 1152-1161. |
| SU Y Q, LIU G, ZHAO J B, et al., 2021. Multi-scenario simulation prediction of ecological space in the Fenhe River Basin using the FLUS model[J]. Arid Zone Research, 38(4):1152-1161. | |
| [30] | 孙泽祥, 刘志锋, 何春阳, 等, 2016. 中国快速城市化干燥地区的生态系统服务权衡关系多尺度分析--以呼包鄂榆地区为例[J]. 生态学报, 36(15):4881-4891. |
| SUN Z X, LIU Z F, HE C Y, et al., 2016. Multi-scale analysis of ecosystem service trade-offs urbanizing drylands of China:A case study in the Hohhot-Baotou-Ordos-Yulin region[J]. Acta Ecologica Sinica, 36(15): 4881-4891. | |
| [31] |
王海军, 武悦, 邓羽, 等, 2021. 基于城市流和层级性的城市群扩展模型构建[J]. 地理学报, 76(12): 3012-3024.
DOI |
| WANG H J, WU Y, DENG Y, et al., 2021. Model construction of urban agglomeration expansion simulation considering urban flow and hierarchical characteristic[J]. Acta Geographica Sinica, 76(12): 3012-3024. | |
| [32] | 王绍强, 刘纪远, 于贵瑞, 2003. 中国陆地土壤有机碳蓄积量估算误差分析[J]. 应用生态学报, 14(5): 797-802. |
| WANG S Q, LIU J Y, YU G R, 2003. Error analysis of estimating terrestrial soil organic carbon storage in China[J]. Chinese Journal of Applied Ecology, 14(5): 797-802. | |
| [33] | 王绍强, 周成虎, 1999. 中国陆地土壤有机碳库的估算[J]. 地理研究, 18(4): 349-356. |
|
WANG S Q, ZHOU C H, 1999. Estimating soil carbon reservior of terrestrial ecosystem in China[J]. Geographical Research, 18(4): 349-356.
DOI |
|
| [34] | 王彦开, 赵渺希, 荣丽华, 2021. 基于夜间灯光数据的呼包鄂城市群空间扩张特征及驱动力研究[J]. 地域研究与开发, 40(3): 43-49. |
| WANG Y K, ZHAO M X, RONG L H, et al., 2021. Spatial expansion characteristics and driving forces of Hohhot-Baotou-Ordos urban agglomeration based on night light Data[J]. Areal Research and Development, 40(3): 43-49. | |
| [35] |
王志远, 张考, 丁志鹏, 等, 2020. 纳入动态数据的改进FLUS模型在城市增长边界划定中的应用[J]. 地球信息科学学报, 22(12): 2326-2337.
DOI |
| WANG Z Y, ZHANG K, DING Z P, et al., 2020. Delineation of urban growth boundary based on Improved FLUS model considering dynamic data[J]. Journal of Geo-information science, 22(12): 2326-2337. | |
| [36] | 吴晶晶, 2017. 基于GIS和CA-Markov模型的乌江下游地区土地利用变化情景模拟与生态环境效应评价[D]. 重庆: 西南大学. |
| WU J J, 2017. Scenario simulation of land use change and eco-environmental effect evaluation in the lower reaches of Wujiang River based on GIS and CA-Markov model[D]. Chongqing: Chongqing University. | |
| [37] | 吴佩君, 刘小平, 黎夏, 等, 2016. 基于InVEST模型和元胞自动机的城市扩张对陆地生态系统碳储量影响评估--以广东省为例[J]. 地理与地理信息科学, 32(5): 22-28, 36, 2. |
| WU P J, LIU X P, LI X, et al., 2016. Impact of urban expansion on carbon storage in terrestrial ecosystems based on InVEST model and CA:a case study of Guangdong Province, China[J]. Geography and Geo-Information Science, 32(5): 22-28, 36, 2. | |
| [38] | 奚小环, 杨忠芳, 崔玉军, 等, 2010. 东北平原土壤有机碳分布与变化趋势研究[J]. 地学前缘, 17(3): 213-221. |
| XI X H, YANG Z F, CUI Y J, et al., 2010. A study of soil carbon distribution and change in Northeast Plain[J]. Earth Science Frontiers, 17(3): 213-221. | |
| [39] | 解宪丽, 孙波, 周慧珍, 等, 2004. 中国土壤有机碳密度和储量的估算与空间分布分析[J]. 土壤学报, 41(1): 35-43. |
| XIE X L, SUN B, ZHOU H Z, et al., 2004. Estimation and spatial distribution of soil organic carbon density and storage in China[J]. Acta Pedologica Sinica, 41(1): 35-43. | |
| [40] | 杨洁, 谢保鹏, 张德罡, 2021. 基于InVEST和CA-Markov模型的黄河流域碳储量时空变化研究[J]. 中国生态农业学报(中英文), 29(6): 1018-1029. |
| YANG J, XIE B P, ZHANG D G, 2021. Spatio-temporal evolution of carbon stocks in the Yellow River Basin based on InVEST and CA-Markov models[J]. Chinese Journal of Eco-Agriculture, 29(6): 1018-1029. | |
| [41] |
于贵瑞, 张黎, 何洪林, 等, 2021. 大尺度陆地生态系统动态变化与空间变异的过程模型及模拟系统[J]. 应用生态学报, 32(8): 2653-2665.
DOI |
| YU G R, ZHANG L, HE H L, et al., 2021. A process-based model and simulation system of dynamic change and spatial variation in large-scale terrestrial ecosystems[J]. Chinese Journal of Applied Ecology, 32(8): 2653-2665. | |
| [42] | 张斌, 李璐, 夏秋月, 等, 2022. “三线”约束下的土地利用变化及其对碳储量影响研究--以武汉城市圈为例[J]. 生态学报, 42(6): 1-16. |
| ZHANG B, LI L, XIA Q Y, et al., 2022. Land use change and its impacts on carbon storage under the constrains of “three lines”: A case study of Wuhan City Circle[J]. Acta Ecologica Sinica, 42(6): 1-16. | |
| [43] |
张经度, 梅志雄, 吕佳慧, 等, 2020. 纳入空间自相关的FLUS模型在土地利用变化多情景模拟中的应用[J]. 地球信息科学学报, 22(3):531-542.
DOI |
| ZHANG J D, MEI Z X, LÜ J H, et al., 2020. Simulating multiple land use scenarios based on the FLUS model considering spatial autocorrelation[J]. Journal of Geo-information Science, 22(3): 531-542. | |
| [44] |
张世伟, 魏璐瑶, 金星星, 等, 2020. 基于FLUS-UGB 的县域土地利用模拟及城镇开发边界划定研究[J]. 地球信息科学学报, 22(9): 1848-1859.
DOI |
| ZHANG S W, WEI L Y, JIN X X, et al., 2020. The land use simulation and delimitation of urban development boundary in county area based on FLUS-UGB[J]. Journal of Geo-information Science, 22(9): 1848-1859. | |
| [45] | 张燕, 师学义, 唐倩, 2021. 不同土地利用情景下汾河上游地区碳储量评估[J]. 生态学报, 41(1): 360-373. |
| ZHANG Y, SHI X Y, TANG Q, et al., 2021. Carbon storage assessment in the upper reaches of the Fenhe River under different land use scenarios[J]. Acta Ecologica Sinica, 41(1): 360-373. | |
| [46] |
朱文博, 张静静, 崔耀平, 等, 2019. 基于土地利用变化情景的生态系统碳储量评估--以太行山淇河流域为例[J]. 地理学报, 74(3): 446-459.
DOI |
|
ZHU W B, ZHANG J J, CUI Y P, et al., 2019. Assessment of territorial ecosystem carbon storage based on land use change scenario: A case study in Qihe River Basin[J]. Acta Geographica Sinica, 74(3): 446-459.
DOI |
|
| [47] | 朱志强, 马晓双, 胡洪, 2021. 基于耦合FLUS-InVEST模型的广州市生态系统碳储量时空演变与预测[J]. 水土保持通报, 41(2):222-229, 239. |
| ZHU Z Q, MA X S, HU H, et al., 2021. Spatio-temporal evolution and prediction of ecosystem carbon stocks in Guangzhou city by coupling FLUS-InVEST models[J]. Bulletin of Soil and Water Conservation, 41(2): 222-229, 239. | |
| [48] | 邹文涛, 何友均, 叶兵, 等, 2020. 基于InVEST模型的森林生态系统服务功能评估研究进展[J]. 世界林业研究, 33(4): 19-24. |
| ZOU W T, HE Y J, YE B, et al., 2020. Research advances in forest ecosystem services evaluations based on the InVEST model[J]. World Forestry Research, 33(4): 19-24. |
| [1] | 王琳, 卫伟. 黄土高原典型县域生态系统服务变化特征及驱动因素[J]. 生态环境学报, 2023, 32(6): 1140-1148. |
| [2] | 刘霞, 郭澍, 王琳. 区域一体化地区的土地利用与生态服务价值研究——以双莱先行区为例[J]. 生态环境学报, 2023, 32(6): 1163-1172. |
| [3] | 王超, 杨倩楠, 张池, 刘同旭, 张晓龙, 陈静, 刘科学. 丹霞山不同土地利用方式土壤磷组分特征及其有效性[J]. 生态环境学报, 2023, 32(5): 889-897. |
| [4] | 张钧韦, 夏圣洁, 陈慧儒, 刘艳红. 山西中部城市群景观格局演变对其热环境的影响研究[J]. 生态环境学报, 2023, 32(5): 943-955. |
| [5] | 王铁铮, 瞿心悦, 刘春香, 李有志. 东江湖水质时空变化规律及其与流域土地利用的关系[J]. 生态环境学报, 2023, 32(4): 722-732. |
| [6] | 夏美君, 李健, 闫永蚕. 京津冀城市群生态福利绩效时空格局及演进特征[J]. 生态环境学报, 2023, 32(4): 814-824. |
| [7] | 张平江, 党国锋. 基于MCR模型与蚁群算法的洮河流域生态安全格局构建[J]. 生态环境学报, 2023, 32(3): 481-491. |
| [8] | 李语诗, 夏志业, 张蕾. 基于SSPs多情景目标的2030年成渝经济圈土地利用碳排放预测及其空间优化[J]. 生态环境学报, 2023, 32(3): 535-544. |
| [9] | 王成武, 罗俊杰, 唐鸿湖. 基于InVEST模型的太行山沿线地区生态系统碳储量时空分异驱动力分析[J]. 生态环境学报, 2023, 32(2): 215-225. |
| [10] | 陈治中, 昝梅, 杨雪峰, 董煜. 新疆森林植被碳储量预测研究[J]. 生态环境学报, 2023, 32(2): 226-234. |
| [11] | 盛美君, 李胜君, 杨昕玥, 王蕊, 李洁, 李刚, 修伟明. 华北潮土农田土壤酶活性对土地利用强度的响应特征探讨[J]. 生态环境学报, 2023, 32(2): 299-308. |
| [12] | 王全超, 吉恒宽, 李思敏, 李财生, 侯正伟, 邓万刚, 吴治澎, 王登峰. 海南东寨港流域土壤-溪流连续体溶解态黑碳分子特征及其界面转化机制[J]. 生态环境学报, 2023, 32(1): 139-149. |
| [13] | 陈科屹, 王建军, 何友均, 张立文. 黑龙江大兴安岭重点国有林区森林碳储量及固碳潜力评估[J]. 生态环境学报, 2022, 31(9): 1725-1734. |
| [14] | 吴胜义, 王飞, 徐干君, 马浩, 党禹杰, 吴菲. 川西北高山峡谷区森林碳储量及空间分布研究--以四川洛须自然保护区为例[J]. 生态环境学报, 2022, 31(9): 1735-1744. |
| [15] | 陈乐, 卫伟. 西北旱区典型流域土地利用与生境质量的时空演变特征[J]. 生态环境学报, 2022, 31(9): 1909-1918. |
| 阅读次数 | ||||||
|
全文 |
|
|||||
|
摘要 |
|
|||||