生态环境学报 ›› 2021, Vol. 30 ›› Issue (6): 1158-1167.DOI: 10.16258/j.cnki.1674-5906.2021.06.006
王金杰1( ), 赵安周2,3,*(), 胡小枫2
收稿日期:2021-01-14
出版日期:2021-06-18
发布日期:2021-09-10
通讯作者:
* 赵安周(1985年生),男,副教授,博士,主要从事城市扩张对植被影响等方面的研究。E-mail: zhaoanzhou@126.com作者简介:王金杰(1995年生),女,硕士,主要从事城市生态遥感研究。E-mail: wjj_0528@163.com
基金资助:
WANG Jinjie1(), ZHAO Anzhou2,3,*(), HU Xiaofeng2
Received:2021-01-14
Online:2021-06-18
Published:2021-09-10
摘要:
研究植被净初级生产力(Net Primary Productivity,NPP)的时空分布及其影响机制对全球陆地生态系统的变化及碳平衡有着重要的意义。基于MOD17A3HGF数据,综合气候、地形、土壤和植被4个方面的自然因子,利用趋势分析、变异系数及地理探测器等方法,探讨了2000—2019年京津冀NPP时空演变特征及空间分布的自然因子驱动机制。结果表明,(1)时间上,2000—2019年期间京津冀植被NPP整体呈显著增长趋势,增速为5.85 g∙(m2∙a)-1(以C计)。(2)空间上,NPP高值区主要集中在北部及西部的燕山和太行山脉,低值区主要集中在西北坝上高原以及东南部平原地区;京津冀植被整体恢复显著,2000—2019年期间80.29%的区域NPP呈显著增加趋势;NPP整体情况较为稳定,平均变异系数为17.25%,其稳定区域占京津冀总面积的36.31%。(3)2000—2019年期间,平均气温、海拔、土壤类型和坡度是影响植被NPP空间分布的最主要自然因素(q>30%,P<0.01),除平均风速外的其他因子对NPP的解释力呈上升趋势。(4)各自然因子的交互作用对NPP的影响表现出非线性增强及双因子增强作用,其中平均气温与土壤类型交互作用最强(q=0.6112)。
中图分类号:
王金杰, 赵安周, 胡小枫. 京津冀植被净初级生产力时空分布及自然驱动因子分析[J]. 生态环境学报, 2021, 30(6): 1158-1167.
WANG Jinjie, ZHAO Anzhou, HU Xiaofeng. Spatiotemporal Distribution of Vegetation Net Primary Productivity in Beijing-Tianjin-Hebei and Natural Driving Factors[J]. Ecology and Environment, 2021, 30(6): 1158-1167.
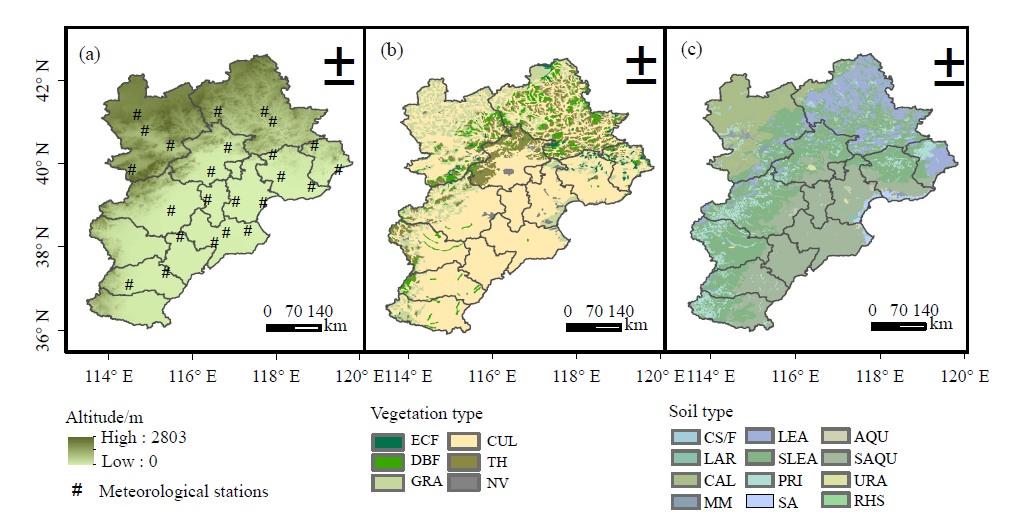
图1 京津冀地形图及气象站点分布(a)、植被类型图(b)、土壤类型图(c) ECF:常绿针叶林 Evergreen coniferous forest;DBF:落叶阔叶林 Deciduous broad-leaved forest;GRA:草地 Grasslands;CUL:耕地 Cultivated land;TH:灌丛 Thickets;NV:非植被Non-vegetated。CS/F:滨海盐场/养殖场 Coastal Saltworks/Farms;LAR:湖泊、水库 Lakes and reservoirs;CAL:钙层土 Calcareous soil;MM:人为土 Man-made soil;LEA:淋溶土 Leaching soil;SLEA:半淋溶土 Semi-leached soil;PRI:初育土 Primary soil;SA:盐碱土 Saline-alkali soil;AQU:水成土 Aquifer;SAQU:半水成土 Semi-aquifer;URA:城区 Urban area;RHS:江河内沙洲 River Hanoi Sandbar
Fig. 1 Topographic and meteorological stations distribution map (a), vegetation type map (b) and soil type map (c) of Beijing-Tianjin-Hebei
| 类型 Type | 影响因子 Impact factor | 指标 Index | 类型 Type | 影响因子 Impact factor | 指标 Index |
|---|---|---|---|---|---|
| 气候 Climate | X1 | 平均气温 Average temperature | 地形 Terrain | X6 | 海拔 Altitude |
| X2 | 降水量 Precipitation | X7 | 坡度 Slope | ||
| X3 | 平均风速 Average wind speed | X8 | 坡向 Aspect | ||
| X4 | 平均湿度 Average humidity | 植被 Vegetation | X9 | 植被类型 Vegetation type | |
| X5 | 太阳总辐射量 Total solar radiation | 土壤 Soil | X10 | 土壤类型 Soil type |
表1 指标选取
Table 1 Index selection
| 类型 Type | 影响因子 Impact factor | 指标 Index | 类型 Type | 影响因子 Impact factor | 指标 Index |
|---|---|---|---|---|---|
| 气候 Climate | X1 | 平均气温 Average temperature | 地形 Terrain | X6 | 海拔 Altitude |
| X2 | 降水量 Precipitation | X7 | 坡度 Slope | ||
| X3 | 平均风速 Average wind speed | X8 | 坡向 Aspect | ||
| X4 | 平均湿度 Average humidity | 植被 Vegetation | X9 | 植被类型 Vegetation type | |
| X5 | 太阳总辐射量 Total solar radiation | 土壤 Soil | X10 | 土壤类型 Soil type |
| 判断依据 Judgments based | 交互作用类型 Type of interaction |
|---|---|
| q(X1∩X2)<min(q(X1), q(X2)) | 非线性减弱 Non-linear reduction |
| min(q(X1), q(X2))<q(X1∩X2)< max(q(X1), q(X2)) | 单因子非线性减弱 Single-factor non-linear reduction |
| q(X1∩X2)max(q(X1), q(X2)) | 双因子增强 Two-factor enhancement |
| q(X1∩X2)=q(X1)+q(X2) | 独立 Independent |
| q(X1∩X2)q(X1)+q(X2) | 非线性增强 Non-linear enhancement |
表2 影响因子交互作用类型
Table 2 Types of the interaction between two influencing factors
| 判断依据 Judgments based | 交互作用类型 Type of interaction |
|---|---|
| q(X1∩X2)<min(q(X1), q(X2)) | 非线性减弱 Non-linear reduction |
| min(q(X1), q(X2))<q(X1∩X2)< max(q(X1), q(X2)) | 单因子非线性减弱 Single-factor non-linear reduction |
| q(X1∩X2)max(q(X1), q(X2)) | 双因子增强 Two-factor enhancement |
| q(X1∩X2)=q(X1)+q(X2) | 独立 Independent |
| q(X1∩X2)q(X1)+q(X2) | 非线性增强 Non-linear enhancement |
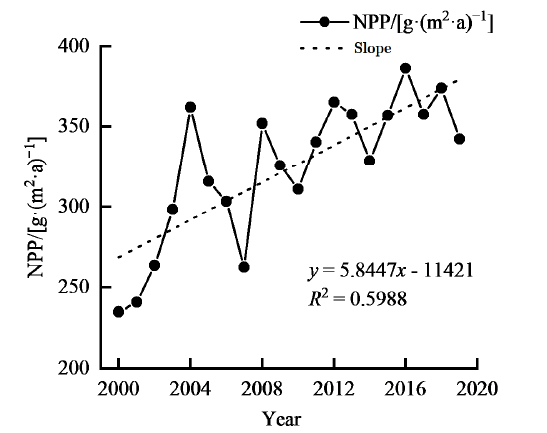
图2 2000—2019年京津冀年均NPP变化趋势
Fig. 2 Trend of annual average NPP in Beijing-Tianjin-Hebei from 2000 to 2019
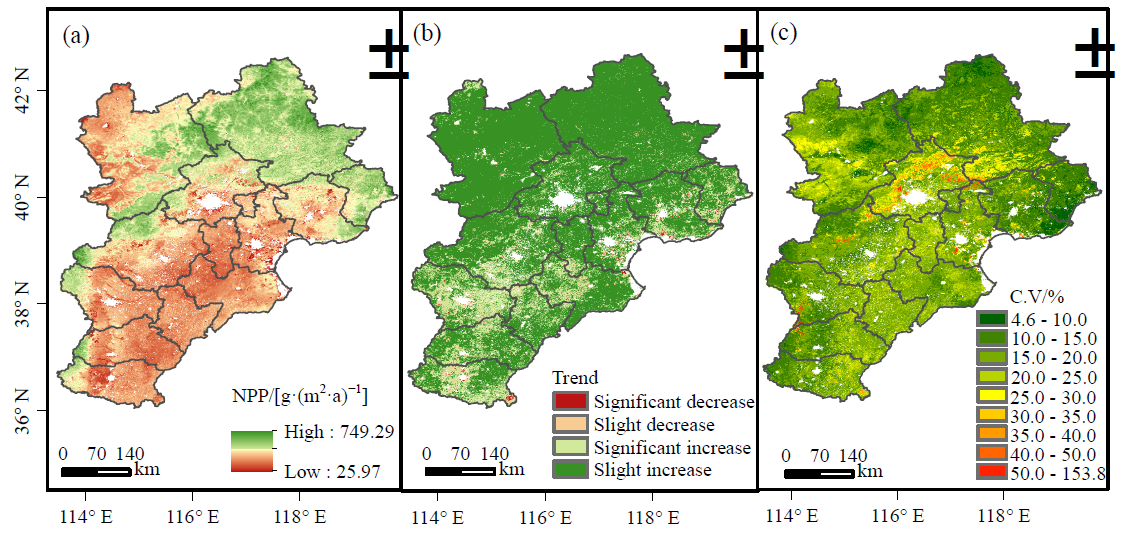
图3 2000—2019年京津冀NPP均值(a)、变化趋势(b)及变异系数(c)空间分布
Fig. 3 Spatial distribution of the mean (a), change trend (b), and coefficient of variation (c) of NPP in Beijing-Tianjin-Hebei from 2000 to 2019
| 影响因子 Impact factor | X1 | X2 | X3 | X4 | X5 | X6 | X7 | X8 | X9 | X10 |
|---|---|---|---|---|---|---|---|---|---|---|
| q | 0.4561 | 0.1063 | 0.1087 | 0.2650 | 0.2190 | 0.3635 | 0.3405 | 0.0112 | 0.1946 | 0.3434 |
| P | 0 | 0 | 0 | 0 | 0 | 0 | 0 | 0 | 0 | 0 |
表3 单影响因子q值
Table 3 q values of single impact factor
| 影响因子 Impact factor | X1 | X2 | X3 | X4 | X5 | X6 | X7 | X8 | X9 | X10 |
|---|---|---|---|---|---|---|---|---|---|---|
| q | 0.4561 | 0.1063 | 0.1087 | 0.2650 | 0.2190 | 0.3635 | 0.3405 | 0.0112 | 0.1946 | 0.3434 |
| P | 0 | 0 | 0 | 0 | 0 | 0 | 0 | 0 | 0 | 0 |
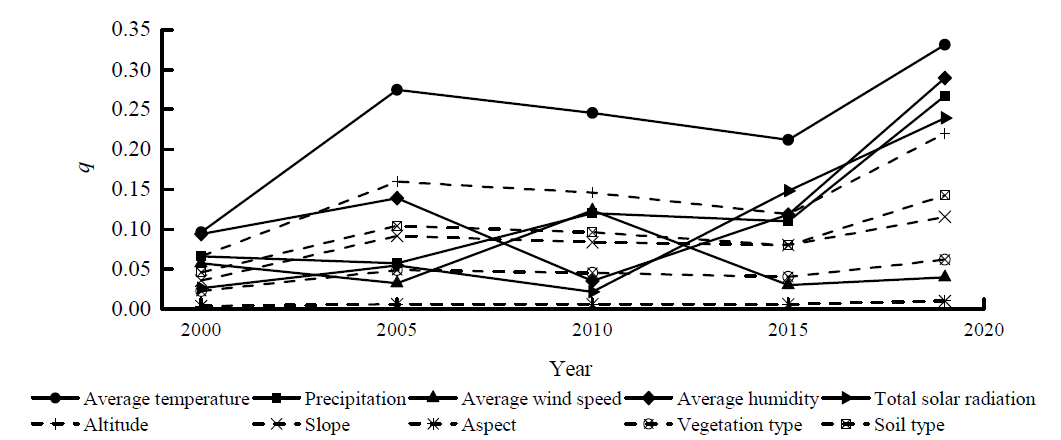
图4 2000—2019 年各影响因子q 值变化
Fig. 4 Changes in q values of impact factors in 2000?2019
| 影响因子 Impact factor | X1 | X2 | X3 | X4 | X5 | X6 | X7 | X8 | X9 | X10 |
|---|---|---|---|---|---|---|---|---|---|---|
| X1 | ||||||||||
| X2 | Y | |||||||||
| X3 | Y | N | ||||||||
| X4 | Y | Y | Y | |||||||
| X5 | Y | Y | Y | Y | ||||||
| X6 | Y | Y | Y | Y | Y | |||||
| X7 | Y | Y | Y | Y | Y | Y | ||||
| X8 | Y | Y | Y | Y | Y | Y | Y | |||
| X9 | Y | Y | Y | Y | Y | Y | Y | Y | ||
| X10 | Y | Y | Y | Y | Y | Y | N | Y | Y |
表4 影响因子显著性差异(置信水平95%)
Table 4 Significant difference of influencing factors (confidence level 95%)
| 影响因子 Impact factor | X1 | X2 | X3 | X4 | X5 | X6 | X7 | X8 | X9 | X10 |
|---|---|---|---|---|---|---|---|---|---|---|
| X1 | ||||||||||
| X2 | Y | |||||||||
| X3 | Y | N | ||||||||
| X4 | Y | Y | Y | |||||||
| X5 | Y | Y | Y | Y | ||||||
| X6 | Y | Y | Y | Y | Y | |||||
| X7 | Y | Y | Y | Y | Y | Y | ||||
| X8 | Y | Y | Y | Y | Y | Y | Y | |||
| X9 | Y | Y | Y | Y | Y | Y | Y | Y | ||
| X10 | Y | Y | Y | Y | Y | Y | N | Y | Y |
| 影响因子 Impact factor | X1 | X2 | X3 | X4 | X5 | X6 | X7 | X8 | X9 | X10 |
|---|---|---|---|---|---|---|---|---|---|---|
| X1 | 0.4561 | |||||||||
| X2 | 0.6028* | 0.1063 | ||||||||
| X3 | 0.5442 | 0.3339* | 0.1086 | |||||||
| X4 | 0.5666 | 0.4981* | 0.4609* | 0.2650 | ||||||
| X5 | 0.5899 | 0.4250* | 0.3832* | 0.4721 | 0.2190 | |||||
| X6 | 0.5430 | 0.5826* | 0.4987* | 0.4708 | 0.5273 | 0.3635 | ||||
| X7 | 0.5188 | 0.4513* | 0.3978 | 0.4385 | 0.4758 | 0.4334 | 0.3405 | |||
| X8 | 0.4639 | 0.1230* | 0.1252* | 0.2784* | 0.2357* | 0.3769* | 0.3494 | 0.0112 | ||
| X9 | 0.5319 | 0.3022* | 0.2836 | 0.3679 | 0.3577 | 0.4291 | 0.3984 | 0.2049 | 0.1946 | |
| X10 | 0.6112 | 0.4371 | 0.4406 | 0.4772 | 0.4952 | 0.5508 | 0.4770 | 0.3549* | 0.3961 | 0.3434 |
表5 影响因子交互作用q值
Table 5 q values of interaction factors
| 影响因子 Impact factor | X1 | X2 | X3 | X4 | X5 | X6 | X7 | X8 | X9 | X10 |
|---|---|---|---|---|---|---|---|---|---|---|
| X1 | 0.4561 | |||||||||
| X2 | 0.6028* | 0.1063 | ||||||||
| X3 | 0.5442 | 0.3339* | 0.1086 | |||||||
| X4 | 0.5666 | 0.4981* | 0.4609* | 0.2650 | ||||||
| X5 | 0.5899 | 0.4250* | 0.3832* | 0.4721 | 0.2190 | |||||
| X6 | 0.5430 | 0.5826* | 0.4987* | 0.4708 | 0.5273 | 0.3635 | ||||
| X7 | 0.5188 | 0.4513* | 0.3978 | 0.4385 | 0.4758 | 0.4334 | 0.3405 | |||
| X8 | 0.4639 | 0.1230* | 0.1252* | 0.2784* | 0.2357* | 0.3769* | 0.3494 | 0.0112 | ||
| X9 | 0.5319 | 0.3022* | 0.2836 | 0.3679 | 0.3577 | 0.4291 | 0.3984 | 0.2049 | 0.1946 | |
| X10 | 0.6112 | 0.4371 | 0.4406 | 0.4772 | 0.4952 | 0.5508 | 0.4770 | 0.3549* | 0.3961 | 0.3434 |
| 影响因子 Impact factor | NPP适宜范围 或类型 Suitable range or type of NPP | 区域NPP均值 Mean of regional NPP/ [(g∙(m2∙a)-1)] | 有显著差异的 分层组合百分比 Percentage of stratified combinations with significant differences/ % |
|---|---|---|---|
| X1/℃ | 8.37-9.31 | 400.95 | 91.67 |
| X2/mm | 602.46-655.64 | 396.04 | 91.67 |
| X3/(m∙s-1) | 1.56-1.82 | 392.25 | 94.44 |
| X4/% | 63.39-67.50 | 410.03 | 97.22 |
| X5/(MJ∙m-2) | 5415.28-5489.42 | 378.89 | 91.67 |
| X6/m | 1670-2803 | 436.23 | 88.89 |
| X7/(°) | 5.13-7.41 | 392.07 | 44.44 |
| X8/(°) | 202.50-247.50 | 332.92 | 48.89 |
| X9 | ECF | 407.70 | 80 |
| X10 | LEA | 430.03 | 86.67 |
表6 影响因子适宜范围或类型(置信水平95%)
Table 6 Suitable ranges or types of impact factors (confidence level 95%)
| 影响因子 Impact factor | NPP适宜范围 或类型 Suitable range or type of NPP | 区域NPP均值 Mean of regional NPP/ [(g∙(m2∙a)-1)] | 有显著差异的 分层组合百分比 Percentage of stratified combinations with significant differences/ % |
|---|---|---|---|
| X1/℃ | 8.37-9.31 | 400.95 | 91.67 |
| X2/mm | 602.46-655.64 | 396.04 | 91.67 |
| X3/(m∙s-1) | 1.56-1.82 | 392.25 | 94.44 |
| X4/% | 63.39-67.50 | 410.03 | 97.22 |
| X5/(MJ∙m-2) | 5415.28-5489.42 | 378.89 | 91.67 |
| X6/m | 1670-2803 | 436.23 | 88.89 |
| X7/(°) | 5.13-7.41 | 392.07 | 44.44 |
| X8/(°) | 202.50-247.50 | 332.92 | 48.89 |
| X9 | ECF | 407.70 | 80 |
| X10 | LEA | 430.03 | 86.67 |
| [1] |
BUTLER S M, MELILLO J M, JOHNSON J E, et al., 2012. Soil warming alters nitrogen cycling in a New England forest: Implications for ecosystem function and structure[J]. Oecologia, 168(3): 819-828.
DOI URL |
| [2] |
CHEN L, WANG X L, CAI X B, et al., 2021. Seasonal Variations of Daytime Land Surface Temperature and Their Underlying Drivers over Wuhan, China[J]. Remote Sensing, DOI: 10.3390/rs13020323.
DOI |
| [3] | CRAMER W, KICKLIGHTER D W, BONDEAU A, et al., 1999. The Participants of the Potsdam NPP Model. Comparing global models of terrestrial net primary productivity (NPP): Overview and key results[J]. Global Change Biology, 5(S1): 1-15. |
| [4] |
FIELD C B, BEHRENFELD M J, RANDERSON J T, et al., 1998. Primary production of the biosphere: integrating terrestrial and oceanic components[J]. Science, 281(5374): 237-240.
DOI URL |
| [5] |
GE W Y, DENG L Q, WANG F, et al., 2021. Quantifying the contributions of human activities and climate change to vegetation net primary productivity dynamics in China from 2001 to 2016 [J]. Science of the Total Environment, 773: 145648.
DOI URL |
| [6] |
ITO A, 2011. A historical meta-analysis of global terrestrial net primary productivity: Are estimates converging?[J]. Global Change Biology, 17(10): 3161-3175.
DOI URL |
| [7] |
KNORR W, PRENTICE I C, HOUSE J I, et al., 2005. Long-term sensitivity of soil carbon turnover to warming[J]. Nature, 433(7023): 298-301.
DOI URL |
| [8] | LIETH H, WHITTAKER R H, 1975. Primary productivity of the Biosphere[M]. New York: Springer-Verlag Press. |
| [9] |
LIU Y Y, YANG Y, WANG Q, et al., 2019. Evaluating the responses of net primary productivity and carbon use efficiency of global grassland to climate variability along an aridity gradient[J]. The Science of the total environment, 652: 671-682.
DOI URL |
| [10] |
MAO D H, WANG Z M, WU C S, et al., 2014. Examining Forest Net Primary Productivity Dynamics and Driving Forces in Northeastern China During 1982-2010 [J]. Chinese Geographical Science, 24(6): 631-646.
DOI URL |
| [11] |
RUIMY A, SAUGIER B, DEDIEU G, 1994. Methodology for the estimation of terrestrial net primary production from remotely sensed data[J]. Journal of Geophysical Research: Atmospheres, 99(D3): 5263-5283.
DOI URL |
| [12] | SHEPARD D, 1968. A two-dimensional interpolation function for irregularly-spaced data[C]. Proceedings of the 1968 23rd ACM National Conference, 517-524. |
| [13] |
VENTER Z S, HAWKINS H J, CRAMER M D, et al., 2021. Mapping soil organic carbon stocks and trends with satellite-driven high resolution maps over South Africa[J]. Science of the Total Environment, 771: 145384.
DOI URL |
| [14] |
WANG C D, LI W Q, SUN M X, et al., 2021. Exploring the formulation of ecological management policies by quantifying interregional primary ecosystem service flows in Yangtze River Delta region, China[J]. Journal of Environmental Management, 284: 112042.
DOI URL |
| [15] |
WANG J F, LI X H, CHRISTAKOS G, et al., 2010. Geographical Detectors-Based Health Risk Assessment and its Application in the Neural Tube Defects Study of the Heshun Region, China[J]. International Journal of Geographical Information Science, 24(1-2): 107.
DOI URL |
| [16] |
ZHANG J, YU L, LU X C, et al., 2020a. Exploring Annual Urban Expansions in the Guangdong-Hong Kong-Macau Greater Bay Area: Spatiotemporal Features and Driving Factors in 1986-2017 [J]. Remote Sensing, 12(16): 2615.
DOI URL |
| [17] | ZHANG Y, LI Y B, YANG B, et al., 2020b. Risk Assessment Of COVID-19 Based On Multisource Data From A Geographical View[J]. IEEE Access, PP (99): 1-1. |
| [18] | 陈福军, 沈彦俊, 李倩, 等, 2011. 中国陆地生态系统近30年NPP时空变化研究[J]. 地理科学, 31(11): 1409-1414. |
| CHEN F J, SHEN Y J, LI Q, et al., 2011. Spatio-temporal Variation Analysis of Ecological Systems NPP in China in Past 30 years[J]. Scientia Geographica Sinica, 31(11): 1409-1414. | |
| [19] |
陈晓玲, 曾永年, 2016. 亚热带山地丘陵区植被NPP时空变化及其与气候因子的关系——以湖南省为例[J]. 地理学报, 71(1): 35-48.
DOI |
| CHEN X L, ZENG Y N, 2016. Spatial and temporal variability of the net primary production (NPP) and its relationship with climate factors in subtropical mountainous and hilly regions of China: A case study in Hunan province[J]. Acta Geographica Sinica, 71(1): 35-48. | |
| [20] | 崔海宁, 2011. 基于退耕的环京津贫困地区土地利用变化生态效应分析[D]. 保定: 河北农业大学. |
| CUI H N, 2011. The Analysis on Ecological Effect of Land Use Change in Poverty Regions surrounding Beijing and Tianjin Based on Converting Cultivated Land back to Forest or Grassland[D]. Baoding: Hebei Agricultural University. | |
| [21] |
方创琳, 2017. 京津冀城市群协同发展的理论基础与规律性分析[J]. 地理科学进展, 36(1): 15-24.
DOI |
| FANG C L, 2017. Theoretical foundation and patterns of coordinated development of the Beijing-Tianjin-Hebei Urban Agglomeration[J]. Progress in Geography, 36(1): 15-24. | |
| [22] | 贺倩, 杨雪琴, 戴晓爱, 2020. 2010—2015年三江源地区植被净初级生产力变化特征及影响因素分析[J]. 长江科学院院报, 37(5): 59-66. |
| HE Q, YANG X Q, DAI X A, 2020. Variation Characteristics and Influence Factors of Net Primary Productivity of Vegetation in the Three-River Headwaters Region from 2010 to 2015 [J]. Journal of Yangtze River Scientific Research Institute, 7(5): 59-66. | |
| [23] | 侯英雨, 柳钦火, 延昊, 等, 2007. 我国陆地植被净初级生产力变化规律及其对气候的响应[J]. 应用生态学报, 18(7): 1546-1553. |
| HOU Y Y, LIU Q H, YAN H, et al., 2007. Variation trends of China terrestrial vegetation net primary productivity and its responses to climate factors in 1982-2000 [J]. Chinese Journal of Applied Ecology, 18(7): 1546-1553. | |
| [24] | 李金珂, 杨玉婷, 张会茹, 等, 2019. 秦巴山区近15年植被NPP时空演变特征及自然与人为因子解析[J]. 生态学报, 39(22): 8504-8515. |
| LI J K, YANG Y T, ZHANG H R, et al., 2019. Spatio-temporal variations of net primary productivity and its natural and human factors analysis in Qinling-Daba Mountains in the past 15 years[J]. Acta Ecologica Sinica, 39(22): 8504-8515. | |
| [25] | 刘广, 2008. 京津冀森林植被净初级生产力遥感估算研究[D]. 北京: 北京林业大学. |
| LIU G, 2008. Estimation of Forest Net Primary Production of Jing-Jin-Ji Region Based on Remote Sensing[D]. Beijing: Beijing Forestry University. | |
| [26] | 吕国旭, 陈艳梅, 邹长新, 等, 2017. 京津冀植被退化的空间格局及人为驱动因素分析[J]. 生态与农村环境学报, 33(5): 417-425. |
| LÜ G X, CHEN Y M, ZOU C X, et al., 2017. Spatial Pattern and Driving Factors of Vegetation Degradation in Beijing-Tianjin-Hebei[J]. Journal of Ecology and Rural Environment, 33(5): 417-425. | |
| [27] | 吕晓敏, 王玉辉, 周广胜, 等, 2015. 温度与降水协同作用对短花针茅生物量及其分配的影响[J]. 生态学报, 35(3): 752-760. |
| LÜ X M, WANG Y H, ZHOU G S, et al., 2015. Interactive effects of changing precipitation and elevated temperatures on plant biomass and its allocation of Stipa breviflora[J]. Acta Ecologica Sinica, 35(3): 752-760. | |
| [28] |
毛德华, 王宗明, 韩佶兴, 等, 2012. 1982—2010年中国东北地区植被NPP时空格局及驱动因子分析[J]. 地理科学, 32(9): 1106-1111.
DOI |
|
MAO D H, WANG Z M, HAN J X, et al., 2012. Spatio-temporal Pattern of Net Primary Productivity and Its Driven Factors in Northeast China in 1982-2010 [J]. Scientia Geographica Sinica, 32(9): 1106-1111.
DOI |
|
| [29] | 潘洪义, 黄佩, 徐婕, 2019. 基于地理探测器的岷江中下游地区植被NPP时空格局演变及其驱动力研究[J]. 生态学报, 39(20): 7621-7631. |
| PAN H Y, HUANG P, XU J, 2019. The spatial and temporal pattern evolution of vegetation NPP and its driving forces in middle-lower areas of the Min river based on geographical detector analyses[J]. Acta Ecologica Sinica, 39(20): 7621-7631. | |
| [30] | 彭少麟, 侯爱敏, 周国逸, 2000. 气候变化对陆地生态系统第一性生产力的影响研究综述[J]. 地球科学进展, 15(6): 717-722. |
| PENG S L, HOU A M, ZHOU G Y, 2000. Impact of climate change on the net primary productivity of terrestrial ecosystem[J]. Advances in Earth Science, 15(6): 717-722. | |
| [31] | 孙涛, 孙然好, 陈利顶, 2020. 京津冀城市群土地利用转化对植被净生产力的影响模式研究[J]. 环境生态学, 2(4): 1-8, 17. |
| SUN T, SUN R H, CHEN L D, 2020. Research on the relationship between changes in vegetation net productivity and land use type transformation in urban agglomeration[J]. Environmental Ecology, 2(4): 1-8, 17. | |
| [32] | 陶帅, 邝婷婷, 彭文甫, 等, 2020. 2000—2015年长江上游NDVI时空变化及驱动力——以宜宾市为例[J]. 生态学报, 40(14): 5029-5043. |
| TAO S, GUANG T T, PENG W F, et al., 2020. Analyzing the spatio-temporal variation and drivers of NDVI in upper reaches of the Yangtze River from 2000 to 2015: A case study of Yibin City[J]. Acta Ecologica Sinica, 40(14): 5029-5043. | |
| [33] |
王欢, 高江波, 侯文娟, 2018. 基于地理探测器的喀斯特不同地貌形态类型区土壤侵蚀定量归因[J]. 地理学报, 73(9): 1674-1686.
DOI |
|
WANG H, GAO J B, HOU W J, 2018. Quantitative attribution analysis of soil erosion in different morphological types of geomorphology in karst areas: Based on the geographical detector method[J]. Acta Geographica Sinica, 73(9): 1674-1686.
DOI |
|
| [34] |
王劲峰, 徐成东, 2017. 地理探测器: 原理与展望[J]. 地理学报, 72(1): 116-134.
DOI |
| WANG J F, XU C D, 2017. Geodetector: Principle and prospective[J]. Acta Geographica Sinica, 72(1): 116-134. | |
| [35] |
阎世杰, 王欢, 焦珂伟, 2019. 京津冀地区植被时空动态及定量归因[J]. 地球信息科学学报, 21(5): 767-780.
DOI |
| YAN S J, WANG H, JIAO K W, 2019. Spatiotemporal Dynamics of NDVI in the Beijing-Tianjin-Hebei Region based on MODIS Data and Quantitative Attribution[J]. Journal of Geo-information Science, 21(5): 767-780. | |
| [36] | 杨淑萍, 韩海东, 2019. 基于地理探测器的甘肃省NDVI驱动因子定量分析[J]. 甘肃农业大学学报, 54(4): 115-123. |
| YANG S P, HAN D M, 2019. Quantitative analysis of NDVI driving factors in Gansu Province based on geodetector[J]. Journal of Gansu Agricultural University, 54(4): 115-123. | |
| [37] | 尤玉虎, 周孝宽, 2005. 数字图像最佳插值算法研究[J]. 中国空间科学技术, 25(3): 14-18. |
| YOU Y H, ZHOU X K, 2005. Research of Optimal Interpolation Algorithm for Digital Image[J]. Chinese Space Science and Technology, 25(3): 14-18. | |
| [38] | 于成龙, 刘丹, 2019. 扎龙湿地NPP时空格局及其对气候因子变化的响应[J]. 生态环境学报, 28(4): 741-751. |
| YU C L, LIU D, 2019. Spatio-temporal evolution and climate effect of NPP in Zhalong Wetland[J]. Ecology and Environmental Sciences, 28(4): 741-751. | |
| [39] |
张弥, 于贵瑞, 张雷明, 等, 2009. 太阳辐射对长白山阔叶红松林净生态系统碳交换的影响[J]. 植物生态学报, 33(2): 270-282.
DOI |
| ZHANG M, YU G R, ZHANG L M, et al., 2009. Effects of solar radiation on net ecosystem exchange of broadleaved-korean pine mixed forest in Changbai Mountain, China[J]. Chinese Journal of Plant Ecology, 33(2): 270-282. | |
| [40] | 张锐, 2015. 基于遥感-过程耦合模型的重庆地区NPP时空模拟研究[D]. 重庆: 西南大学. |
| ZHANG R, 2015. Spatio-temporal Dynamics of the Net Primary Production (NPP) Using GLOPEM-CEVSA model in Chongqing Province[D]. Chongqing: Southwest University. | |
| [41] | 张莎, 2015. 基于长时间序列多源遥感数据的河北省植被NPP时空分布研究[D]. 石家庄: 河北师范大学. |
| ZHANG S, 2015. Research on Spatio-temporal Distribution of Vegetation Net Primary Productivity in Hebei Province Based on Long Time-series Muti-source Remote Sensing Data[D]. Shijiazhuang: Hebei Normal University. | |
| [42] | 张笑鹤, 2011. 西南地区NDVI和NPP时空动态及其与气候因子相关性分析[D]. 北京: 中国林业科学研究院. |
| ZHANG X H, 2011. Spatio-temporal dynamic of NDVI and NPP and their Correlation with Climatic Factors in Southwest China[D]. Beijing: Chinese Academy of Forestry. | |
| [43] | 赵国帅, 王军邦, 范文义, 等, 2011. 2000—2008年中国东北地区植被净初级生产力的模拟及季节变化[J]. 应用生态学报, 22(3): 621-630. |
| ZHAO G S, WANG J B, FAN Y W, et al., 2011. Vegetation net primary productivity in Northeast China in 2000-2008: Simulation and seasonal change [J]. Chinese Journal of Applied Ecology, 22(3): 621-630. | |
| [44] | 朱利欣, 2018. 基于MODIS数据的京津冀NPP及生态足迹和生态承载力时空分布研究[D]. 石家庄: 河北师范大学. |
| ZHU L X, 2018. Research on Spatio-temporal Distribution of NPP and Ecological Footprint and Ecological Capacity in Beijing- Tianjin-Hebei Region Based on MODIS Data[D]. Shijiazhuang: Hebei Normal University. | |
| [45] | 朱利欣, 袁金国, 2019. 京津冀地区植被净初级生产力时空分布及其与地形因子的关系[J]. 科技通报, 35(6): 197-203. |
| ZHU L X, YUAN L G, 2019. Spatiotemporal Distribution of Vegetation Net Primary Productivity and Its Relationship with Topographic Factors in Beijing-tianjin-hebei Region[J]. Bulletin of Science and Technology, 35(6): 197-203. | |
| [46] | 朱士华, 艳燕, 邵华, 等, 2017. 1980—2014年中亚地区植被净初级生产力对气候和CO2变化的响应[J]. 自然资源学报, 32(11): 1844-1856. |
| ZHU S H, YAN Y, SHAO H, et al., 2017. The Responses of the Net Primary Productivity of the Dryland Ecosystems in Central Asia to the CO2 and Climate Changes during the Past 35 Years[J]. Journal of Natural Resources, 32(11): 1844-1856. | |
| [47] | 朱文泉, 陈云浩, 徐丹, 等, 2005. 陆地植被净初级生产力计算模型研究进展[J]. 生态学杂志, 24(3): 296-300. |
| ZHU W Q, CHEN Y H, XU D, et al., 2005. Advances in terrestrial net primary productivity (NPP) estimation models[J]. Chinese Journal of Ecology, 24(3): 296-300. | |
| [48] | 左丽媛, 高江波, 2020. 基于地理探测器的喀斯特植被NPP定量归因[J]. 生态环境学报, 29(4): 686-694. |
| ZUO L Y, GAO J B, 2020. Quantitative attribution analysis of NPP in Karst peak cluster depression based on geographical detector[J]. Ecology and Environmental Sciences, 29(4): 686-694. |
| [1] | 王琳, 卫伟. 黄土高原典型县域生态系统服务变化特征及驱动因素[J]. 生态环境学报, 2023, 32(6): 1140-1148. |
| [2] | 李建辉, 党争, 陈琳. 黄河几字弯都市圈PM2.5时空特征及影响因素分析[J]. 生态环境学报, 2023, 32(4): 697-705. |
| [3] | 夏美君, 李健, 闫永蚕. 京津冀城市群生态福利绩效时空格局及演进特征[J]. 生态环境学报, 2023, 32(4): 814-824. |
| [4] | 吴雅睿, 王美景, 王涛, 杨梅焕. 新冠疫情下NO2时空变化特征——以陕西省为例[J]. 生态环境学报, 2023, 32(3): 514-524. |
| [5] | 郝金虎, 韦玮, 李胜男, 马牧源, 李肖夏, 杨洪国, 姜琦宇, 柴沛东. 基于GEE平台的京津冀长时序水体时空格局及其影响因素[J]. 生态环境学报, 2023, 32(3): 556-566. |
| [6] | 王成武, 罗俊杰, 唐鸿湖. 基于InVEST模型的太行山沿线地区生态系统碳储量时空分异驱动力分析[J]. 生态环境学报, 2023, 32(2): 215-225. |
| [7] | 付蓉, 武新梅, 陈斌. 城市地表温度空间分异及驱动因子差异性分析——以合肥市为例[J]. 生态环境学报, 2023, 32(1): 110-122. |
| [8] | 孙正, 曹亚非, 王德彩, 刘峰, 宋效东, 张甘霖, 吴华勇. 近30年京津冀电镀场地时空演变特征及趋势预测[J]. 生态环境学报, 2023, 32(1): 183-194. |
| [9] | 陈文裕, 夏丽华, 徐国良, 余世钦, 陈行, 陈金凤. 2000—2020年珠江流域NDVI动态变化及影响因素研究[J]. 生态环境学报, 2022, 31(7): 1306-1316. |
| [10] | 李梦华, 韩颖娟, 赵慧, 王云霞. 基于地理探测器的宁夏植被覆盖度时空变化特征及其驱动因子分析[J]. 生态环境学报, 2022, 31(7): 1317-1325. |
| [11] | 李登科, 王钊. 气候变化和人类活动对陕西省植被NPP影响的定量分析[J]. 生态环境学报, 2022, 31(6): 1071-1079. |
| [12] | 贺斌, 胡茂川. 广东省各区县农业面源污染负荷估算及特征分析[J]. 生态环境学报, 2022, 31(4): 771-776. |
| [13] | 高思琦, 董国涛, 蒋晓辉, 聂桐, 郭欣伟, 党素珍, 李心宇, 李昊洋. 黄河源植被覆盖度变化及空间分布自然驱动力分析[J]. 生态环境学报, 2022, 31(3): 429-439. |
| [14] | 赵锐, 詹梨苹, 周亮, 张军科. 地理探测联合地理加权岭回归的PM2.5驱动因素分析[J]. 生态环境学报, 2022, 31(2): 307-317. |
| [15] | 杨艳, 周德成, 宫兆宁, 刘子源, 张良侠. 基于植被生产力的黄土高原地区生态脆弱性及其控制因子分析[J]. 生态环境学报, 2022, 31(10): 1951-1958. |
| 阅读次数 | ||||||
|
全文 |
|
|||||
|
摘要 |
|
|||||