生态环境学报 ›› 2021, Vol. 30 ›› Issue (11): 2223-2231.DOI: 10.16258/j.cnki.1674-5906.2021.11.013
余楚1( ), 李剑锋1, 吕敦玉1,2,*()
收稿日期:2021-03-30
出版日期:2021-11-18
发布日期:2021-12-29
通讯作者:
* 吕敦玉(1984年生),男,副研究员,博士,研究方向为城市化进程中的地质环境效应研究。E-mail: lvdunyu@foxmail.com作者简介:余楚(1989年生),女,助理研究员,硕士,研究方向为地下水环境保护研究。E-mail: yuchu_1112@163.com
基金资助:
YU Chu1(), LI Jianfeng1, LV Dunyu1,2,*()
Received:2021-03-30
Online:2021-11-18
Published:2021-12-29
摘要:
大兴安岭南段长期矿产开发对该地区河流生态环境造成了巨大压力,评估河流沉积物中重金属的污染状况及潜在生态风险对该地区河流生态环境保护具有重要意义。以大兴安岭南段某铅锌矿区为研究区,在流经矿区河流的上、中、下段沿流向采集了6组表层沉积物样品,测试了其中19种金属与主量元素的含量,通过相关性和聚类分析确定了受主要影响的重金属元素,利用土壤环境质量标准和沉积物质量基准对重金属的含量特征进行了评估,并进一步采用地质累积指数(Igeo)和潜在生态风险指数(Iperi)对重金属的污染程度和潜在生态风险进行了评价。结果表明,(1)研究矿区河流沉积物中As、Cd、Cu、Pb、Zn、CaO与MnO含量两两之间呈显著正相关,Pearon相关系数均大于0.85,Ward系统聚类分析属于一类,指示这些元素在沉积物中很可能具有相似的来源。7种元素在沉积物中的含量均大于其背景值,且变异系数较大(>60%),表明其含量受矿山开发活动影响显著。(2)沉积物各采样点的Cu含量均低于土壤污染风险筛选值(RSV)和临界效应浓度(TEL)。河流上、下段沉积物的As、Cd、Pb、Zn含量均低于RSV,中段的含量均高于RSV,其中As、Pb、Zn含量高于可能效应浓度(PEL)。(3)沉积物重金属的Igeo从小到大依次为Cu<As<Zn<Pb<Cd,Cd的Igeo为4.29,属重度污染等级。重金属的潜在生态风险因子(Er)从小到大依次为Cu<Zn<As<Pb<Cd,Cd的Er为2633.69,属极高风险等级,占Iperi的81.21%—91.65%,表明Cd是沉积物的主要污染和风险来源。(4)河流中段沉积物重金属元素属偏中度-严重污染等级,其Iperi高达5619.87,属极高风险等级,污染程度和生态风险都明显高于上、下河段,表明河流中段受矿山开发活动的影响最为显著。
中图分类号:
余楚, 李剑锋, 吕敦玉. 大兴安岭南段某矿区河流表层沉积物重金属污染及风险评价[J]. 生态环境学报, 2021, 30(11): 2223-2231.
YU Chu, LI Jianfeng, LV Dunyu. Heavy Metal Pollution and Risk Assessment in River Surface Sediments of Mining Area in the South of the Da Hinggan Mountains[J]. Ecology and Environment, 2021, 30(11): 2223-2231.

图1 研究区采样点位示意图
Fig. 1 Distribution of sampling sites in the study mine
| 污染程度 Pollution status | Igeo | 级别 Classification |
|---|---|---|
| 无污染 Unpolluted | ≤0 | 0 |
| 轻度污染 Unpolluted to moderate polluted | 0‒1 | 1 |
| 偏中度污染 Moderate polluted | 1‒2 | 2 |
| 中度污染 Moderate to strongly polluted | 2‒3 | 3 |
| 偏重度污染 Strongly polluted | 3‒4 | 4 |
| 重度污染 Strongly to extremely polluted | 4‒5 | 5 |
| 严重污染 Extremely polluted | >5 | 6 |
表1 地质累积指数Igeo与污染程度分级
Table 1 Classification of geo-accumulation index Igeo
| 污染程度 Pollution status | Igeo | 级别 Classification |
|---|---|---|
| 无污染 Unpolluted | ≤0 | 0 |
| 轻度污染 Unpolluted to moderate polluted | 0‒1 | 1 |
| 偏中度污染 Moderate polluted | 1‒2 | 2 |
| 中度污染 Moderate to strongly polluted | 2‒3 | 3 |
| 偏重度污染 Strongly polluted | 3‒4 | 4 |
| 重度污染 Strongly to extremely polluted | 4‒5 | 5 |
| 严重污染 Extremely polluted | >5 | 6 |
| 元素 Elements | As | Cd | Cu | Pb | Zn | Cr | Co | Ni | V |
|---|---|---|---|---|---|---|---|---|---|
| 背景值 Background value/(μg∙g-1) | 10.8 | 0.069 | 18.9 | 21.2 | 66.9 | 54 | 11.1 | 23.6 | 58.4 |
表2 栗钙土重金属元素背景值
Table 2 Background value of heavy metals of chestnut soil
| 元素 Elements | As | Cd | Cu | Pb | Zn | Cr | Co | Ni | V |
|---|---|---|---|---|---|---|---|---|---|
| 背景值 Background value/(μg∙g-1) | 10.8 | 0.069 | 18.9 | 21.2 | 66.9 | 54 | 11.1 | 23.6 | 58.4 |
| 多种重金属 All factors | 单一重金属 Single regulator | |||
|---|---|---|---|---|
| Iperi | 分级 Ranking | | 分级 Ranking | |
| ≤150 | 低风险 Low risk | ≤40 | 低风险 Low risk | |
| (150, 300] | 中等风险 Medium risk | (40, 80] | 中等风险 Medium risk | |
| (300, 600] | 较高风险 Considerable risk | (80, 160] | 较高风险 Considerable risk | |
| >600 | 极高风险 Very high risk | (160, 320] | 高风险 High risk | |
| — | — | >320 | 极高风险 Very high risk | |
表3 综合潜在生态风险指Iperi和潜在生态风险因子$E_r^i$分级标准
Table 3 Ranking of comprehensive potential ecological risk index Iperi and potential ecological risk factors $E_r^i$
| 多种重金属 All factors | 单一重金属 Single regulator | |||
|---|---|---|---|---|
| Iperi | 分级 Ranking | | 分级 Ranking | |
| ≤150 | 低风险 Low risk | ≤40 | 低风险 Low risk | |
| (150, 300] | 中等风险 Medium risk | (40, 80] | 中等风险 Medium risk | |
| (300, 600] | 较高风险 Considerable risk | (80, 160] | 较高风险 Considerable risk | |
| >600 | 极高风险 Very high risk | (160, 320] | 高风险 High risk | |
| — | — | >320 | 极高风险 Very high risk | |
| 元素 Elements | As | Cd | Cu | Pb | Zn | CaO | MnO | TFe2O3 | MgO | P2O5 | TiO2 | Cr | Co | Ni | V | Na2O | K2O | SiO2 | Al2O3 |
|---|---|---|---|---|---|---|---|---|---|---|---|---|---|---|---|---|---|---|---|
| As | 1.000 | ||||||||||||||||||
| Cd | 0.862* | 1.000 | |||||||||||||||||
| Cu | 0.898* | 0.946** | 1.000 | ||||||||||||||||
| Pb | 0.905* | 0.990** | 0.978** | 1.000 | |||||||||||||||
| Zn | 0.854* | 0.999** | 0.952** | 0.991** | 1.000 | ||||||||||||||
| CaO | 0.858* | 0.858* | 0.977** | 0.916* | 0.870* | 1.000 | |||||||||||||
| MnO | 0.987** | 0.927** | 0.933** | 0.956** | 0.920** | 0.880* | 1.000 | ||||||||||||
| TFe2O3 | 0.975** | 0.872* | 0.839* | 0.888* | 0.857* | 0.754 | 0.971** | 1.000 | |||||||||||
| MgO | 0.806 | 0.849* | 0.952** | 0.888* | 0.860* | 0.947** | 0.821* | 0.727 | 1.000 | ||||||||||
| P2O5 | 0.894* | 0.802 | 0.709 | 0.795 | 0.780 | 0.588 | 0.893* | 0.965** | 0.578 | 1.000 | |||||||||
| TiO2 | -0.167 | -0.116 | -0.194 | -0.175 | -0.122 | -0.290 | -0.209 | -0.064 | 0.015 | -0.007 | 1.000 | ||||||||
| Cr | 0.783 | 0.690 | 0.657 | 0.686 | 0.676 | 0.548 | 0.746 | 0.838* | 0.696 | 0.836* | 0.464 | 1.000 | |||||||
| Co | 0.802 | 0.761 | 0.699 | 0.749 | 0.749 | 0.591 | 0.788 | 0.861* | 0.694 | 0.813* | 0.398 | 0.934** | 1.000 | ||||||
| Ni | 0.669 | 0.517 | 0.529 | 0.525 | 0.504 | 0.447 | 0.601 | 0.706 | 0.631 | 0.688 | 0.598 | 0.966** | 0.885* | 1.000 | |||||
| V | 0.115 | -0.013 | 0.018 | -0.019 | -0.020 | -0.032 | 0.024 | 0.156 | 0.246 | 0.165 | 0.902* | 0.652 | 0.531 | 0.808 | 1.000 | ||||
| Na2O | -0.894* | -0.773 | -0.897* | -0.832* | -0.774 | -0.894* | -0.863* | -0.819* | -0.933** | -0.711 | 0.000 | -0.793 | -0.714 | -0.744 | -0.328 | 1.000 | |||
| K2O | -0.881* | -0.859* | -0.943** | -0.898* | -0.863* | -0.916* | -0.879* | -0.824* | -0.972** | -0.719 | -0.034 | -0.801 | -0.748 | -0.725 | -0.298 | 0.981** | 1.000 | ||
| SiO2 | -0.899* | -0.860* | -0.978** | -0.920** | -0.868* | -0.994** | -0.908* | -0.803 | -0.952** | -0.650 | 0.246 | -0.620 | -0.640 | -0.525 | -0.037 | 0.934** | 0.944** | 1.000 | |
| Al2O3 | -0.811 | -0.799 | -0.937** | -0.866* | -0.811 | -0.979** | -0.834* | -0.689 | -0.892* | -0.535 | 0.432 | -0.435 | -0.440 | -0.322 | 0.159 | 0.861* | 0.871* | 0.969** | 1.000 |
表4 研究区河流表层沉积物地球化学元素相关关系矩阵
Table 4 Correlation matrix of geochemical elements in river surface sediments
| 元素 Elements | As | Cd | Cu | Pb | Zn | CaO | MnO | TFe2O3 | MgO | P2O5 | TiO2 | Cr | Co | Ni | V | Na2O | K2O | SiO2 | Al2O3 |
|---|---|---|---|---|---|---|---|---|---|---|---|---|---|---|---|---|---|---|---|
| As | 1.000 | ||||||||||||||||||
| Cd | 0.862* | 1.000 | |||||||||||||||||
| Cu | 0.898* | 0.946** | 1.000 | ||||||||||||||||
| Pb | 0.905* | 0.990** | 0.978** | 1.000 | |||||||||||||||
| Zn | 0.854* | 0.999** | 0.952** | 0.991** | 1.000 | ||||||||||||||
| CaO | 0.858* | 0.858* | 0.977** | 0.916* | 0.870* | 1.000 | |||||||||||||
| MnO | 0.987** | 0.927** | 0.933** | 0.956** | 0.920** | 0.880* | 1.000 | ||||||||||||
| TFe2O3 | 0.975** | 0.872* | 0.839* | 0.888* | 0.857* | 0.754 | 0.971** | 1.000 | |||||||||||
| MgO | 0.806 | 0.849* | 0.952** | 0.888* | 0.860* | 0.947** | 0.821* | 0.727 | 1.000 | ||||||||||
| P2O5 | 0.894* | 0.802 | 0.709 | 0.795 | 0.780 | 0.588 | 0.893* | 0.965** | 0.578 | 1.000 | |||||||||
| TiO2 | -0.167 | -0.116 | -0.194 | -0.175 | -0.122 | -0.290 | -0.209 | -0.064 | 0.015 | -0.007 | 1.000 | ||||||||
| Cr | 0.783 | 0.690 | 0.657 | 0.686 | 0.676 | 0.548 | 0.746 | 0.838* | 0.696 | 0.836* | 0.464 | 1.000 | |||||||
| Co | 0.802 | 0.761 | 0.699 | 0.749 | 0.749 | 0.591 | 0.788 | 0.861* | 0.694 | 0.813* | 0.398 | 0.934** | 1.000 | ||||||
| Ni | 0.669 | 0.517 | 0.529 | 0.525 | 0.504 | 0.447 | 0.601 | 0.706 | 0.631 | 0.688 | 0.598 | 0.966** | 0.885* | 1.000 | |||||
| V | 0.115 | -0.013 | 0.018 | -0.019 | -0.020 | -0.032 | 0.024 | 0.156 | 0.246 | 0.165 | 0.902* | 0.652 | 0.531 | 0.808 | 1.000 | ||||
| Na2O | -0.894* | -0.773 | -0.897* | -0.832* | -0.774 | -0.894* | -0.863* | -0.819* | -0.933** | -0.711 | 0.000 | -0.793 | -0.714 | -0.744 | -0.328 | 1.000 | |||
| K2O | -0.881* | -0.859* | -0.943** | -0.898* | -0.863* | -0.916* | -0.879* | -0.824* | -0.972** | -0.719 | -0.034 | -0.801 | -0.748 | -0.725 | -0.298 | 0.981** | 1.000 | ||
| SiO2 | -0.899* | -0.860* | -0.978** | -0.920** | -0.868* | -0.994** | -0.908* | -0.803 | -0.952** | -0.650 | 0.246 | -0.620 | -0.640 | -0.525 | -0.037 | 0.934** | 0.944** | 1.000 | |
| Al2O3 | -0.811 | -0.799 | -0.937** | -0.866* | -0.811 | -0.979** | -0.834* | -0.689 | -0.892* | -0.535 | 0.432 | -0.435 | -0.440 | -0.322 | 0.159 | 0.861* | 0.871* | 0.969** | 1.000 |
| 分析项目 Items | 取值范围 Ranges | 平均值 Mean | 标准差 Std. Dev | 变异系数 CV/% |
|---|---|---|---|---|
| pH | 6.67‒8.52 | 7.51 | 0.72 | 10 |
| As | 7.06‒67.40 | 35.17 | 26.92 | 77 |
| Cd | 0.26‒17.06 | 6.06 | 6.98 | 115 |
| Cu | 12.41‒53.19 | 32.25 | 19.21 | 60 |
| Pb | 36.63‒2294.25 | 906.50 | 983.42 | 108 |
| Zn | 107.51‒3877.78 | 1432.90 | 1589.87 | 111 |
| Cr | 22.29‒51.75 | 38.71 | 9.71 | 25 |
| Co | 5.50‒11.46 | 8.48 | 2.01 | 24 |
| Ni | 9.54‒18.11 | 15.20 | 3.02 | 20 |
| V | 32.72‒52.91 | 45.49 | 7.29 | 16 |
| SiO2 | 54.59‒72.30 | 63.45 | 8.09 | 13 |
| Al2O3 | 10.25‒13.01 | 11.71 | 1.14 | 10 |
| CaO | 0.94‒13.10 | 6.29 | 5.45 | 87 |
| TFe2O3 | 2.44‒7.50 | 4.46 | 2.03 | 45 |
| Na2O | 1.57‒2.82 | 2.07 | 0.50 | 24 |
| K2O | 2.03‒3.71 | 2.69 | 0.69 | 26 |
| MgO | 0.47‒1.49 | 1.02 | 0.38 | 37 |
| MnO | 0.08‒1.24 | 0.55 | 0.51 | 94 |
| P2O5 | 0.08‒0.16 | 0.11 | 0.03 | 29 |
| TiO2 | 0.39‒0.55 | 0.47 | 0.06 | 13 |
表5 研究区河流表层沉积物pH值及地球化学元素参数统计
Table 5 Parametric statistics of geochemical elements in river surface sediments
| 分析项目 Items | 取值范围 Ranges | 平均值 Mean | 标准差 Std. Dev | 变异系数 CV/% |
|---|---|---|---|---|
| pH | 6.67‒8.52 | 7.51 | 0.72 | 10 |
| As | 7.06‒67.40 | 35.17 | 26.92 | 77 |
| Cd | 0.26‒17.06 | 6.06 | 6.98 | 115 |
| Cu | 12.41‒53.19 | 32.25 | 19.21 | 60 |
| Pb | 36.63‒2294.25 | 906.50 | 983.42 | 108 |
| Zn | 107.51‒3877.78 | 1432.90 | 1589.87 | 111 |
| Cr | 22.29‒51.75 | 38.71 | 9.71 | 25 |
| Co | 5.50‒11.46 | 8.48 | 2.01 | 24 |
| Ni | 9.54‒18.11 | 15.20 | 3.02 | 20 |
| V | 32.72‒52.91 | 45.49 | 7.29 | 16 |
| SiO2 | 54.59‒72.30 | 63.45 | 8.09 | 13 |
| Al2O3 | 10.25‒13.01 | 11.71 | 1.14 | 10 |
| CaO | 0.94‒13.10 | 6.29 | 5.45 | 87 |
| TFe2O3 | 2.44‒7.50 | 4.46 | 2.03 | 45 |
| Na2O | 1.57‒2.82 | 2.07 | 0.50 | 24 |
| K2O | 2.03‒3.71 | 2.69 | 0.69 | 26 |
| MgO | 0.47‒1.49 | 1.02 | 0.38 | 37 |
| MnO | 0.08‒1.24 | 0.55 | 0.51 | 94 |
| P2O5 | 0.08‒0.16 | 0.11 | 0.03 | 29 |
| TiO2 | 0.39‒0.55 | 0.47 | 0.06 | 13 |
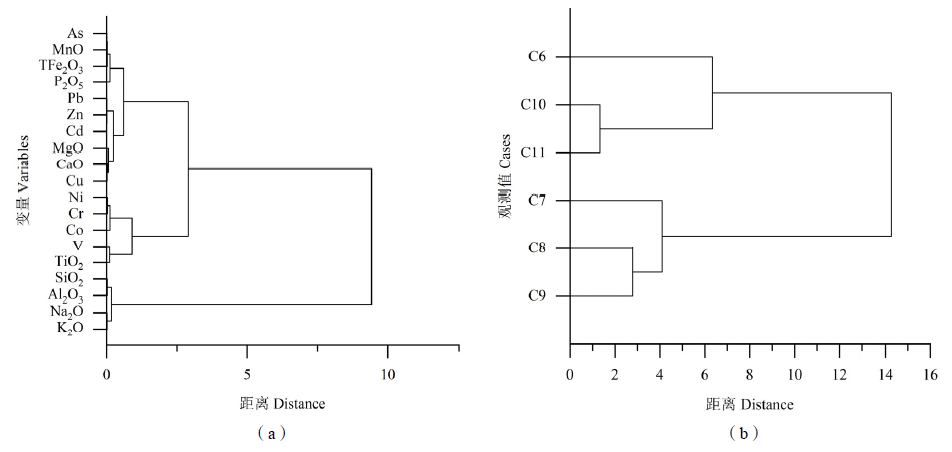
图2 研究区河流表层沉积物地球化学元素及采样点系统聚类结果
Fig. 2 Hierarchical cluster analysis of geochemical elements in the sampling sites
| 元素 Elements | RSV | TEL | PEL | |
|---|---|---|---|---|
| 6.5<pH≤7.5 | pH>7.5 | |||
| As | 30 | 25 | 11 | 48 |
| Cd | 0.3 | 0.6 | 2.58 | 19.6 |
| Cu | 100 | 100 | 56.20 | 141.00 |
| Pb | 120 | 170 | 47.30 | 200.00 |
| Zn | 250 | 300 | 79.90 | 461.00 |
表6 研究区河流表层沉积物中重金属的取值标准
Table 6 Contents of heavy metals in the surface sediments
| 元素 Elements | RSV | TEL | PEL | |
|---|---|---|---|---|
| 6.5<pH≤7.5 | pH>7.5 | |||
| As | 30 | 25 | 11 | 48 |
| Cd | 0.3 | 0.6 | 2.58 | 19.6 |
| Cu | 100 | 100 | 56.20 | 141.00 |
| Pb | 120 | 170 | 47.30 | 200.00 |
| Zn | 250 | 300 | 79.90 | 461.00 |
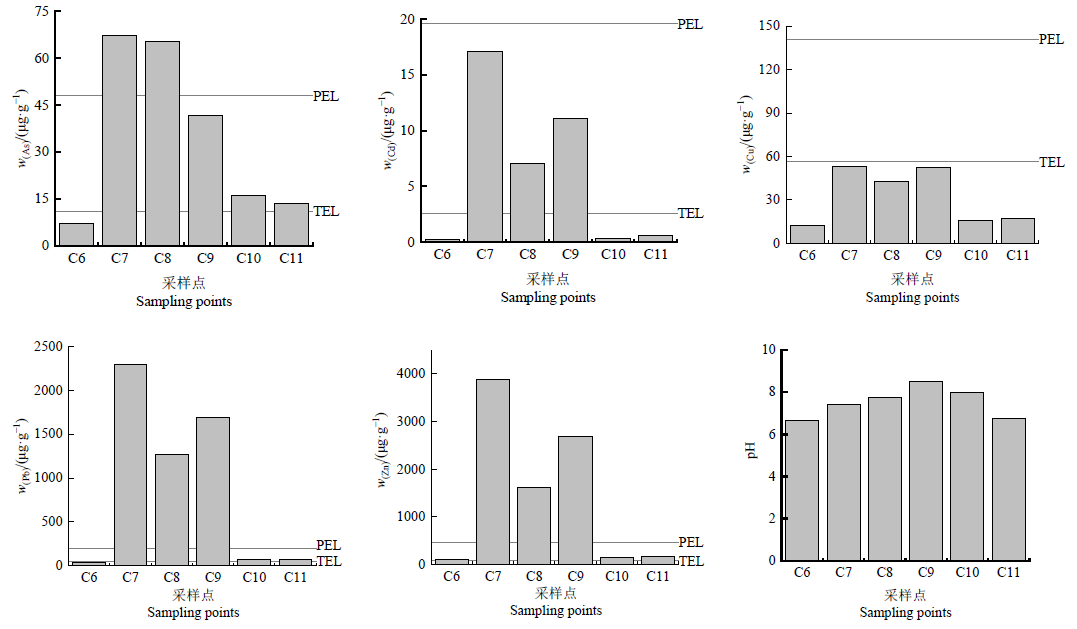
图3 研究区河流表层沉积物重金属含量与质量基准
Fig. 3 Heavy metal content and SQC of the surface sediments
| Igeo | C6 | C7 | C8 | C9 | C10 | C11 | 平均值 Mean |
|---|---|---|---|---|---|---|---|
| As | -1.2 | 2.06 | 2.01 | 1.37 | -0.02 | -0.28 | 0.66 |
| Cd | 1.32 | 7.37 | 6.09 | 6.74 | 1.84 | 2.38 | 4.29 |
| Cu | -1.19 | 0.91 | 0.58 | 0.89 | -0.83 | -0.74 | -0.06 |
| Pb | 0.2 | 6.17 | 5.33 | 5.73 | 1.09 | 1.18 | 3.29 |
| Zn | 0.1 | 5.27 | 4.02 | 4.74 | 0.47 | 0.68 | 2.55 |
表7 研究区河流表层沉积物中重金属地质累积指数
Table 7 Geo-accumulation indices of heavy metals in the surface sediments
| Igeo | C6 | C7 | C8 | C9 | C10 | C11 | 平均值 Mean |
|---|---|---|---|---|---|---|---|
| As | -1.2 | 2.06 | 2.01 | 1.37 | -0.02 | -0.28 | 0.66 |
| Cd | 1.32 | 7.37 | 6.09 | 6.74 | 1.84 | 2.38 | 4.29 |
| Cu | -1.19 | 0.91 | 0.58 | 0.89 | -0.83 | -0.74 | -0.06 |
| Pb | 0.2 | 6.17 | 5.33 | 5.73 | 1.09 | 1.18 | 3.29 |
| Zn | 0.1 | 5.27 | 4.02 | 4.74 | 0.47 | 0.68 | 2.55 |
| 元素 Elements | As | Cd | Cu | Pb | Zn |
|---|---|---|---|---|---|
| 平均含量 Mean concentration (Cr)/(μg∙g-1) | 35.17 | 6.06 | 32.25 | 906.50 | 1432.90 |
| 污染系数 Contamination factor (Cf) | 3.26 | 87.79 | 1.71 | 42.76 | 21.42 |
| 潜在生态风险因子 Potential ecological risk factor (Er) | 32.56 | 2633.69 | 8.53 | 213.80 | 21.42 |
表8 研究区河流表层沉积物重金属的潜在生态风险因子
Table 8 Potential ecological risk factors of heavy metals in the surface sediments
| 元素 Elements | As | Cd | Cu | Pb | Zn |
|---|---|---|---|---|---|
| 平均含量 Mean concentration (Cr)/(μg∙g-1) | 35.17 | 6.06 | 32.25 | 906.50 | 1432.90 |
| 污染系数 Contamination factor (Cf) | 3.26 | 87.79 | 1.71 | 42.76 | 21.42 |
| 潜在生态风险因子 Potential ecological risk factor (Er) | 32.56 | 2633.69 | 8.53 | 213.80 | 21.42 |
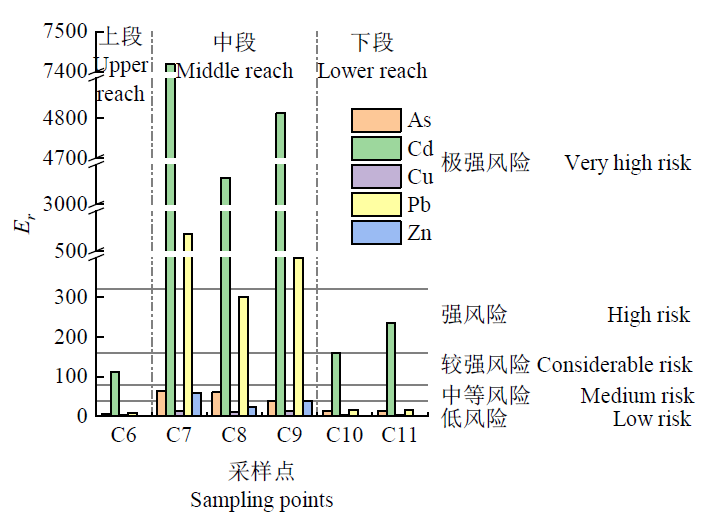
图4 研究区河流表层沉积物重金属潜在生态风险因子Er
Fig. 4 Potential ecological risk index Er of heavy metals in the surface sediments
| [1] |
DOTANIYA M L, MEENA V D, RAJENDIRAN S, et al., 2017. Geo-accumulation indices of heavy metals in soil and groundwater of Kanpur, India under long term irrigation of tannery effluent[J]. Bulletin of Environmental Contamination and Toxicology, 98: 706-711.
DOI URL |
| [2] |
SINGH K P, MOHAN D, SINGH V K, et al., 2005. Studies on distribution and fractionation of heavy metals in Gomti river sediments-a tributary of the Ganges, India[J]. Journal of Hydrology, 312(1-4): 14-27.
DOI URL |
| [3] |
KARBASSI A R, MONAVARI S M, NABI BIDHENDI GH R, et al., 2008. Metal pollution assessment of sediment and water in the Shur River[J]. Environmental Monitoring and Assessment, 147(1-3): 107-116.
DOI URL |
| [4] |
ZOHRA B S, HABIB A, 2016. Assessment of heavy metal contamination levels and toxicity in sediments and fishes from the Mediterranean Sea (southern coast of Sfax, Tunisia)[J]. Environmental Science and Pollution Research International, 23: 13954-13963.
DOI URL |
| [5] |
WEBER P, BEHR E R, KNORR C D L, et al., 2013. Metals in the water, sediment, and tissues of two fish species from different trophic levels in a subtropical Brazilian river[J]. Microchemical Journal, 106(5): 61-66.
DOI URL |
| [6] |
KE X, GUI S F, HUANG H, et al., 2017. Ecological risk assessment and source identification for heavy metals in surface sediment from the Liaohe River protected area, China[J]. Chemosphere, 175: 473-481.
DOI URL |
| [7] |
ARCO-LÁZARO E, AGUDO I, CLEMENTE R, et al., 2016. Arsenic(V) adsorption-desorption in agricultural and mine soils: Effects of organic matter addition and phosphate competition[J]. Environmental Pollution, 216: 71-79.
DOI URL |
| [8] |
INGERSOLL C G, HAVERLAND P S, BRUNSON E L, et al., 1996. Calculation and evaluation of sediment effect concentrations for the amphipod Hyalella azteca and the Midge Chironomus riparius[J]. Journal of Great Lakes Research, 22(3): 602-623.
DOI URL |
| [9] |
WU F Z, YANG W Q, ZHANG J, et al., 2010. Cadmium accumulation and growth responses of a poplar (Populus deltoids×Populus nigra) in cadmium contaminated purple soil and alluvial soil[J]. Journal of Hazardous Materials, 177(1-3): 268-273.
DOI URL |
| [10] | 宝虎, 赵鹏武, 周梅, 等, 2020. 大兴安岭南段典型天然林枯枝落叶层及土壤层持水特性研究[J]. 干旱区资源与环境, 34(2): 175-181. |
| BAO H, ZHAO P W, ZHOU M, et al., 2020. Water holding capacit of litters and soils in typical natural forests in south of Da Xing’an Mountains[J]. Journal of Arid Land Resources and Environment, 34(2): 175-181. | |
| [11] | 蔡敬怡, 谭科艳, 路国慧, 等, 2019. 贵州万山废弃矿区小流域系统沉积物及悬浮物重金属的空间分布特征[J]. 岩矿测试, 38(3): 305-315. |
| CAI J Y, TAN K Y, LU G H, et al., 2019. The Spatial distribution characteristics of heavy metals in river sediments and suspended matter in small tributaries of the abandoned Wanshan mercury mines, Guizhou province[J]. Rock and Mineral Analysis, 38(3): 305-315. | |
| [12] | 段明, 李志丹, 王国明, 等, 2016. 内蒙古赤峰市白音诺尔铅锌矿二长花岗岩地球化学及锆石U-Pb年代学研究[J]. 地质调查与研究, 39(3): 161-168. |
| DUAN M, LI Z D, WANG G M, et al., 2016. Zircon LA-ICP-MS U-Pb ages and geochemical characteristics of monzonitic granite from Baiyinnuoer Pb-Zn deposit, Chifeng city, Inner Mongolia[J]. Geological Survey and Research, 39(3): 161-168. | |
| [13] | 方志青, 陈秋禹, 尹德良, 等, 2018. 三峡库区支流河口沉积物重金属分布特征及风险评价[J]. 环境科学, 39(6): 2607-2614. |
| aFANG Z Q, CHEN Q Y, YI D L, et al., 2018. Distribution characteristics and risk assessment of heavy metals in the sediments of the estuary of the tributaries in the Three Gorges Reservoir, SW China[J]. Environmental Science, 39(6): 2607-2614. | |
| [1] | 郭祥义, 王永康, 张必敏, 等, 2018. 内蒙古半干旱草原某铅锌矿区土壤性质及重金属污染生态风险评价[J]. 环境化学, 37(4): 851-859. |
| GUO X Y, WANG Y K, ZHANG B M, et al., 2018. Soil properties and pollution assessment of heavy metals in a lead-zinc mining area of semiarid grassland in Inner Mongolia[J]. Environmental Chemistry, 37(4): 851-859. | |
| [2] | 国家环境保护局, 1990. 中国土壤元素背景值[M]. 北京: 中国环境科学出版社: 21-22. |
| State Environmental Protection Administration, 1990. Background values of soil elements in China[M]. Beijing: China Environmental Science Press: 21-22. | |
| [3] | 江彪, 张通, 王登红, 等, 2020. 中国银矿床地质控矿规律及若干找矿方向[J]. 地质学报, 94(1): 113-126. |
| JIANG B, ZHANG T, WANG D H, et al., 2020. Factors controlling ore formation, regularity and some prospecting strategies for silver deposits in China[J]. Acta Geologica Sinica, 94(1): 113-126. | |
| [4] | 李真真, 秦克章, 赵俊兴, 等, 2019. 锡-银多金属成矿系统的基本特征、研究进展与展望[J]. 岩石学报, 35(7): 1979-1998. |
|
LI Z Z, QIN K Z, ZHAO J X, et al., 2019. Basic characteristics, research progresses and prospects of Sn-ag-base metal metallogenic system[J]. Acta Petrologica Sinica, 35(7): 1979-1998.
DOI URL |
|
| [5] | 刘大超, 徐秋萍, 张浏, 等, 2018. 基于逸度方法评价巢湖流域PAHs在水体-沉积物间扩散过程[J]. 环境科学学报, 38(3): 930-939. |
| LIU D C, XU Q P, ZHANG L, et al., 2018. Assessing the water-sediment infusive process of PAHS in Chaohu Lake watershed: A fugacity based approach[J]. Acta Scientiae Circumstantiae, 38(3): 930-939. | |
| [6] | 马明真, 高扬, 宋贤威, 等, 2019. 鄱阳湖地区多尺度流域水体重金属输送特征及其污染风险评价[J]. 生态学报, 39(17): 6404-6415. |
| MA M Z, GAO Y, SONG X W, et al., 2019. Transport characteristics and risk assessment of heavy metals in multi-scale watersheds in the Poyang Lake area, China[J]. Acta Ecologica Sinica, 39(17): 6404-6415. | |
| [7] | 聂硕, 张福平, 燕玉超, 等, 2020. 基于GIS的县域土壤重金属空间分布及污染评价分析[J]. 兰州大学学报(自然科学版), 56(1): 81-89. |
| NIE S, ZHANG F P, YAN Y C, et al., 2020. Pollution analysis and spatial distribution of heavy metals in soil based on GIS[J]. Journal of Lanzhou University (Natural Sciences), 56(1): 81-89. | |
| [8] | 齐月, 李俊生, 马艺文, 等, 2020. 黄河三角洲滨海滩涂湿地沉积物重金属空间分布及生态风险评价[J]. 环境科学研究, 33(6): 1488-1496. |
| QI Y, LI J S, MA Y W, et al., 2020. Distribution and risk assessment of heavy metals of surface sediments in intertidal flats of the Yellow River Delta, China[J]. Research of Environmental Sciences, 33(6): 1488-1496. | |
| [9] | 尚洁, 2015. 内蒙古大兴安岭林区矿产资源开发对植被的影响[D]. 呼和浩特: 内蒙古农业大学: 2. |
| SHANG J, 2015. Effect of mineral exploitation on vegetation in Daxinganling Forest Areas in Inner Mongolia[D]. Hohhot: Inner Mongolia Agricultural University: 2. | |
| [10] | 孙德尧, 臧淑英, 孙华杰, 等, 2018. 近150年呼伦湖重金属污染历史及潜在生态风险[J]. 农业环境科学学报, 37(1): 137-147. |
| SUN D Y, ZANG S Y, SUN H J, et al., 2018. Pollution history and potential ecological risk assessment of heavy metals in core sediments in Hulun Lake during the past 150 years[J]. Journal of Agro-Environment Science, 37(1): 137-147. | |
| [11] | 孙厚云, 王晨昇, 卫晓锋, 等, 2020. 大兴安岭南段巴音高勒流域水化学特征及驱动因子[J]. 环境化学, 39(9): 2507-2519. |
| SUN H Y, WANG C S, WEI X F, et al., 2020. Hydrochemical characteristics and driving factors in the water of the Bayingaole Basin, Southern Great Xing’an Range[J]. Environmental Chemistry, 39(9): 2507-2519. | |
| [12] | 徐争启, 倪师军, 庹先国, 等, 2008. 潜在生态危害指数法评价中重金属毒性系数计算[J]. 环境科学与技术, 31(2): 112-115. |
| XU Z Q, NI X J, TUO X G, et al., 2008. Calculation of heavy metals' toxicity coefficient in the evalution of potential ecological risk index[J]. Environmental Science and Technology, 31(2): 112-115. | |
| [13] | 闫晓露, 郑欢, 赵烜杭, 等, 2020. 辽东湾北部河口区土壤重金属污染源识别及健康风险评价[J]. 环境科学学报, 40(8): 3028-3039. |
| YAN X L, ZHENG H, ZHAO X H, et al., 2020. Source identification and health risk assessment of soil heavy metal in the estuary of Northern Liaodong Bay, China[J]. Acta Scientiae Circumstantiae, 40(8): 3028-3039. | |
| [14] | 么相姝, 赵文吉, 杨振宇, 等, 2021. 基于Ward系统聚类的京津冀城市群空气质量时空变化特征与成因分析[J]. 生态环境学报, 30(2): 340-350. |
| YAO X S, ZHAO W J, YANG Z Y, et al., 2021. Spatial-temporal variation characteristics of air quality and its influencing factors of the Beijing-Tianjin-Hebei urban agglomeration based on ward hierarchical clustering[J]. Ecology and Environmental Sciences, 30(2): 340-350. | |
| [15] | 叶霖, 李朝阳, 刘铁庚, 等, 2006. 铅锌矿床中镉的表生地球化学研究现状[J]. 地球与环境, 34(1): 55-60. |
| YE L, LI C Y, LIU T G, et al., 2006. The status-quo of research on supergenic geochemistry of cadmium in Pb-Zn deposits[J]. Earth and Environment, 34(1): 55-60. | |
| [16] | 余楚, 张翼龙, 李剑锋, 等, 2019. 白音诺尔铅锌矿区河流沉积物重金属的形态分布特征[J]. 水文地质工程地质, 46(3): 162-168. |
| YU C, ZHANG Y L, LI J F, et al., 2019. Morphological Characteristics of Heavy Metals in River Sediments in Baiyinnuoer Lead-zinc Deposit[J]. Hydrogeology & Engineering Geology, 46(3): 162-168. | |
| [17] | 于靖, 张华, 蔡永兵, 等, 2015. 金矿污染河流的水体和沉积物中重金属分布特征及生态风险评价[J]. 环境污染与防治, 37(12): 1-9. |
| YU J, ZHANG H, CAI Y B, et al., 2015. Distribution and ecological risk of heavy metals in water and sediments of a river polluted by gold mining[J]. Environmental Pollution & Control, 37(12): 1-9. | |
| [18] | 于瑞莲, 胡恭任, 郑志敏, 2013. 泉州湾洛阳江河口潮间带沉积物中重金属来源分析[J]. 矿物学报, 33(1): 10-18. |
| YU R L, HU G R, ZHENG Z M, 2013. Source analysis of heavy metals in the sediment cores from the intertidal flat of Luoyang river estuary in Quanzhou bay, China[J]. Acta Mieralogica Sinica, 33(1): 10-18. | |
| [19] | 张婷, 2011. 淡水水体沉积物重金属质量基准的研究[D]. 天津: 南开大学: 4. |
| ZHANG T, 2011. Sediment heavy metals quality criteria for fresh waters[D]. Tianjin: Nankai University: 4. | |
| [20] | 张婷, 钟文珏, 曾毅, 等, 2012. 应用生物效应数据库法建立淡水水体沉积物重金属质量基准[J]. 应用生态学报, 23(9): 2587-2594. |
| ZHANG T, ZHONG W J, ZENG Y, et al., 2012. Sediment heavy metals quality criteria for fresh waters based on biological effect database approach[J]. Chinese Journal of Applied Ecology, 23(9): 2587-2594. | |
| [21] | 周艳, 陈樯, 邓绍坡, 等, 2018. 西南某铅锌矿区农田土壤重金属空间主成分分析及生态风险评价[J]. 环境科学, 39(6): 2884-2892. |
| ZHOU Y, CHEN Q, DENG S P, et al., 2018. Principal component analysis and ecological risk assessment of heavy metals in farmland soils around a Pb-Zn mine in southwestern China[J]. Environmental Science, 39(6): 2884-2892. | |
| [22] | 周海燕, 邓一荣, 林龙勇, 等, 2019. 铁锰氧化物在不同水分条件下对土壤As的稳定化作用[J]. 环境科学, 40(8): 3792-3798. |
| ZHOU H Y, DENG Y R, LIN L Y, et al., 2019. Stabilization of arsenic-contaminated soils using Fe-Mn oxide under different water conditions[J]. Environmental Science, 40(8): 3792-3798. | |
| [23] | 钟晓宇, 吴天生, 李杰, 等, 2020. 柳江流域沉积物重金属生态风险评价及来源分析[J]. 物探与化探, 44(1): 191-198. |
| ZHONG X Y, WU T S, LI J, et al., 2020. Ecological risk assessment and source analysis of heavy metals in sediments of Liujiang River Catchment[J]. Geophysical and Geochemical Exploration, 44(1): 191-198. |
| [1] | 杜丹丹, 高瑞忠, 房丽晶, 谢龙梅. 旱区盐湖盆地土壤重金属空间变异及对土壤理化因子的响应[J]. 生态环境学报, 2023, 32(6): 1123-1132. |
| [2] | 冯树娜, 吕家珑, 何海龙. KI淋洗对黄绵土汞污染的去除效果及土壤理化性状的影响[J]. 生态环境学报, 2023, 32(4): 776-783. |
| [3] | 陈敏毅, 朱航海, 佘伟铎, 尹光彩, 黄祖照, 杨巧玲. 珠三角某遗留造船厂场地土壤重金属人体健康风险评估及源解析[J]. 生态环境学报, 2023, 32(4): 794-804. |
| [4] | 肖洁芸, 周伟, 石佩琪. 土壤重金属含量高光谱反演[J]. 生态环境学报, 2023, 32(1): 175-182. |
| [5] | 黄宏, 郑欣芸, 李迎东, 赵旭, 俞锦辰, 汪振华. 大陈岛海域不同年龄褐菖鲉对重金属富集作用研究[J]. 生态环境学报, 2022, 31(9): 1885-1891. |
| [6] | 马闯, 王雨阳, 周通, 吴龙华. 污染土壤颗粒态有机质镉锌富集特征及其解吸行为研究[J]. 生态环境学报, 2022, 31(9): 1892-1900. |
| [7] | 陶玲, 黄磊, 周怡蕾, 李中兴, 任珺. 污泥-凹凸棒石共热解生物炭对矿区土壤重金属生物有效性和环境风险的影响[J]. 生态环境学报, 2022, 31(8): 1637-1646. |
| [8] | 李莹, 张洲, 杨高明, 祖艳群, 李博, 陈建军. 湿地植物根系泌氧能力和根表铁膜与根系吸收重金属的关系[J]. 生态环境学报, 2022, 31(8): 1657-1666. |
| [9] | 罗松英, 李秋霞, 邱锦坤, 邓素炎, 李一锋, 陈碧珊. 南三岛土壤-红树植物系统中重金属形态特征及迁移转化规律[J]. 生态环境学报, 2022, 31(7): 1409-1416. |
| [10] | 董乐恒, 王旭刚, 陈曼佳, 王子豪, 孙丽蓉, 石兆勇, 吴琪琪. 光照和避光条件下石灰性水稻土Fe氧化还原与Cu活性关系研究[J]. 生态环境学报, 2022, 31(7): 1448-1455. |
| [11] | 彭红丽, 谭海霞, 王颖, 魏建梅, 冯阳. 不同种植模式下土壤重金属形态分布差异与生态风险评价[J]. 生态环境学报, 2022, 31(6): 1235-1243. |
| [12] | 黄敏, 赵晓峰, 梁荣祥, 王鹏忠, 戴安然, 何晓曼. 3种螯合剂对Cd、Cu复合污染土壤淋洗修复的对比研究[J]. 生态环境学报, 2022, 31(6): 1244-1252. |
| [13] | 朱立安, 张会化, 程炯, 李婷, 林梓, 李俊杰. 珠江三角洲林业用地土壤重金属潜在生态风险格局分析[J]. 生态环境学报, 2022, 31(6): 1253-1262. |
| [14] | 施建飞, 靳正忠, 周智彬, 王鑫. 额尔齐斯河流域典型尾矿库区周边土壤重金属污染评价[J]. 生态环境学报, 2022, 31(5): 1015-1023. |
| [15] | 钱学诗, 李勇, 钱壮壮, 葛晓敏, 唐罗忠. 北亚热带东部次生阔叶林降水过程中的镉、铅、砷含量变化[J]. 生态环境学报, 2022, 31(5): 979-989. |
| 阅读次数 | ||||||
|
全文 |
|
|||||
|
摘要 |
|
|||||