生态环境学报 ›› 2021, Vol. 30 ›› Issue (6): 1229-1239.DOI: 10.16258/j.cnki.1674-5906.2021.06.014
褚荣浩1( ), 李萌2,*(), 谢鹏飞2, 倪锋2, 蒋跃林2, 申双和3
收稿日期:2021-01-10
出版日期:2021-06-18
发布日期:2021-09-10
通讯作者:
* 李萌(1988年生),女,讲师,博士,主要从事农业气象研究。E-mail: mengli@ahau.edu.cn作者简介:褚荣浩(1991年生),男,工程师,博士,主要从事农业气象研究。E-mail: ronghao_chu@163.com
基金资助:
CHU Ronghao1(), LI Meng2,*(), XIE Pengfei2, NI Feng2, JIANG Yuelin2, SHEN Shuanghe3
Received:2021-01-10
Online:2021-06-18
Published:2021-09-10
摘要:
蒸散(ET)在地表水平衡和水文循环过程中起着至关重要的作用。采用2000—2019年第6版MODIS遥感产品数据中的蒸散产品数据(MOD16 ET和PET)、土地覆盖类型数据(MCD12Q1)以及安徽省77个气象站点常规气象观测数据,结合水分亏缺指数(CWSI)、变异系数、Theil-Sen's趋势估算方法以及Mann-Kendall(M-K)检验,探讨了安徽省近20年ET、PET和CWSI时空变化特征及其影响因素。结果表明,安徽省近20年ET总体呈现显著增加趋势(6.98 mm∙a-1),PET呈不显著增加趋势(3.24 mm∙a-1),而CWSI呈现显著下降趋势(-0.004 a-1)。空间上,ET介于285—1282 mm,南部高、北部低,变化趋势介于-25.5—50.6 mm∙a-1,总体呈较低和中等波动性变化特征;PET介于1118—1673 mm,西部高、东部低,变化趋势介于-34.4—23.5 mm∙a-1,总体呈较低和低波动性变化特征;CWSI与ET分布特征相反,介于0.17—0.80,总体呈中等和较低波动性变化特征。各土地利用类型对应ET大小依次为:林地>草地>农田>湿地>水体>裸地>城镇,而各土地利用类型对应PET差异较小,且CWSI与ET排序总体相反。水分条件(即降水量和相对湿度的增加)是安徽省近20年ET增加和CWSI下降的主要原因,进而使得干旱化趋势有所缓解,而辐射条件可能是PET增加的主要原因。
中图分类号:
褚荣浩, 李萌, 谢鹏飞, 倪锋, 蒋跃林, 申双和. 安徽省近20年地表蒸散和干旱变化特征及其影响因素分析[J]. 生态环境学报, 2021, 30(6): 1229-1239.
CHU Ronghao, LI Meng, XIE Pengfei, NI Feng, JIANG Yuelin, SHEN Shuanghe. Characteristics and Influencing Factors of Surface Evapotranspiration and Drought in Anhui Province during Recent 20 Years[J]. Ecology and Environment, 2021, 30(6): 1229-1239.
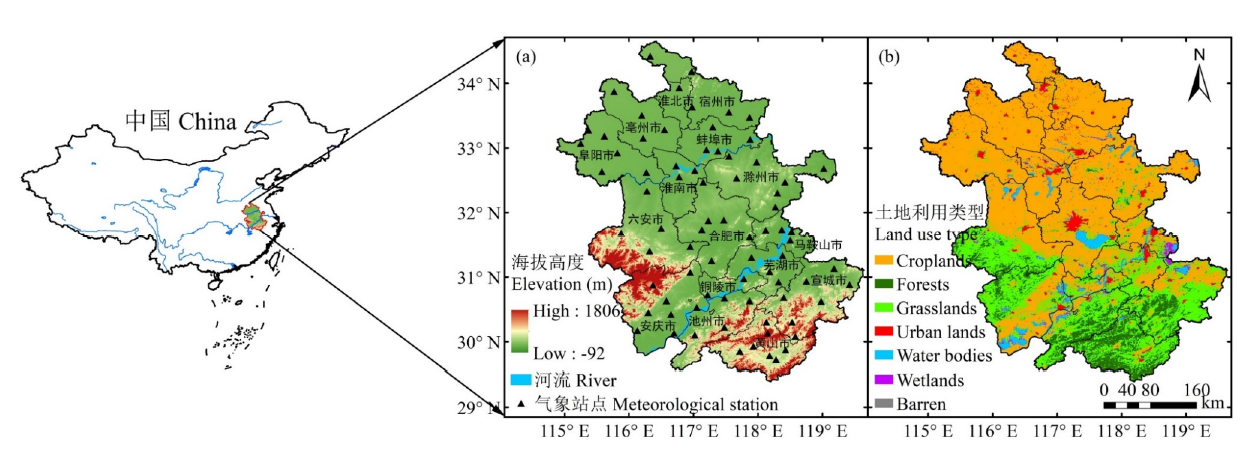
图1 安徽省地理位置、(a)气象站点分布和(b)土地利用类型(2019年)特征
Fig. 1 Characteristics of geographical location, (a) meteorological station distribution and (b) land use types (2019) of Anhui province

图2 MOD16 PET产品数据在安徽省的适用性验证
Fig. 2 Applicability verification of MOD16 PET product data in Anhui province
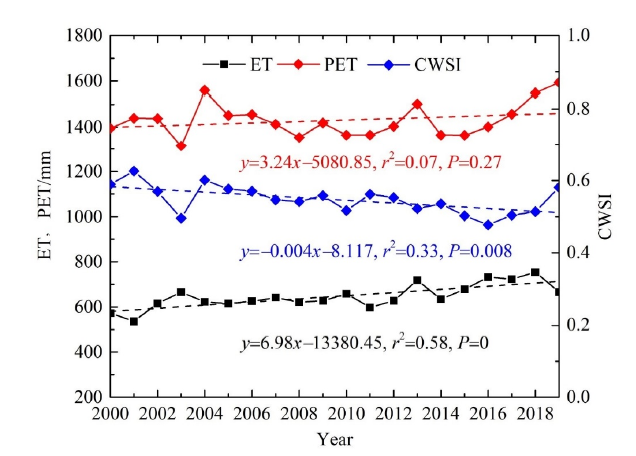
图3 安徽省2000—2019年ET、PET和CWSI年变化特征
Fig. 3 Annual change characteristics of ET, PET and CWSI in Anhui province during 2000-2019

图4 安徽省2000—2019年ET、PET和CWSI空间分布特征
Fig. 4 Spatial distribution characteristics of ET, PET and CWSI in Anhui Province during 2000-2019
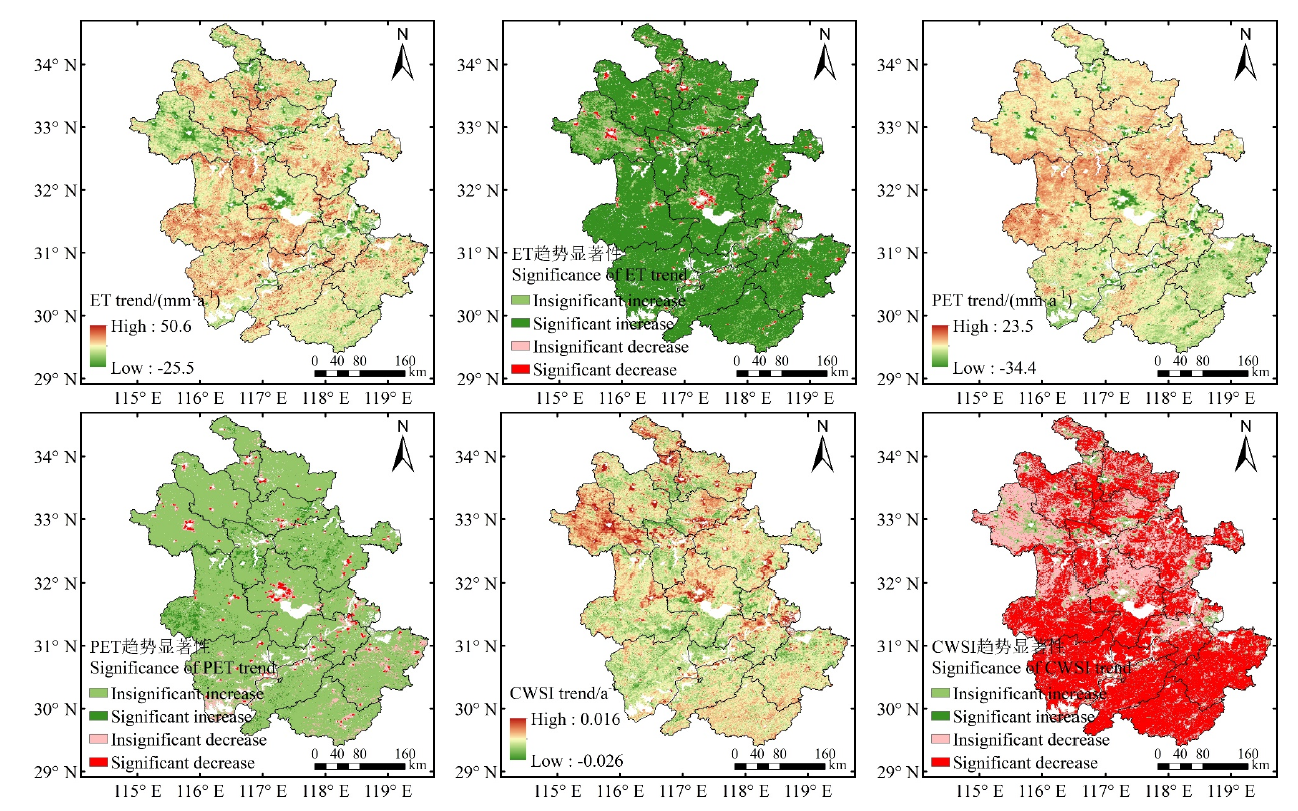
图5 安徽省2000—2019年ET、PET和CWSI变化趋势和显著性空间分布
Fig. 5 Spatial distribution of ET, PET and CWSI trends and their significance in Anhui province during 2000-2019
| 变化趋势 Change trend | 不显著增加 Insignificant increase | 显著增加 Significant increase | 不显著减少 Insignificant decrease | 显著减少 Significant decrease |
|---|---|---|---|---|
| ET | 14.71% | 80.71% | 3.00% | 1.58% |
| PET | 87.84% | 4.63% | 6.20% | 1.33% |
| CWSI | 4.55% | 0.55% | 32.79% | 62.11% |
表1 安徽省2000—2019年ET、PET和CWSI变化趋势显著性检验(占总面积的百分比)
Table 1 Significance test of variation trends of ET, PET and CWSI in Anhui Province during 2000-2019 (percentage of total area)
| 变化趋势 Change trend | 不显著增加 Insignificant increase | 显著增加 Significant increase | 不显著减少 Insignificant decrease | 显著减少 Significant decrease |
|---|---|---|---|---|
| ET | 14.71% | 80.71% | 3.00% | 1.58% |
| PET | 87.84% | 4.63% | 6.20% | 1.33% |
| CWSI | 4.55% | 0.55% | 32.79% | 62.11% |
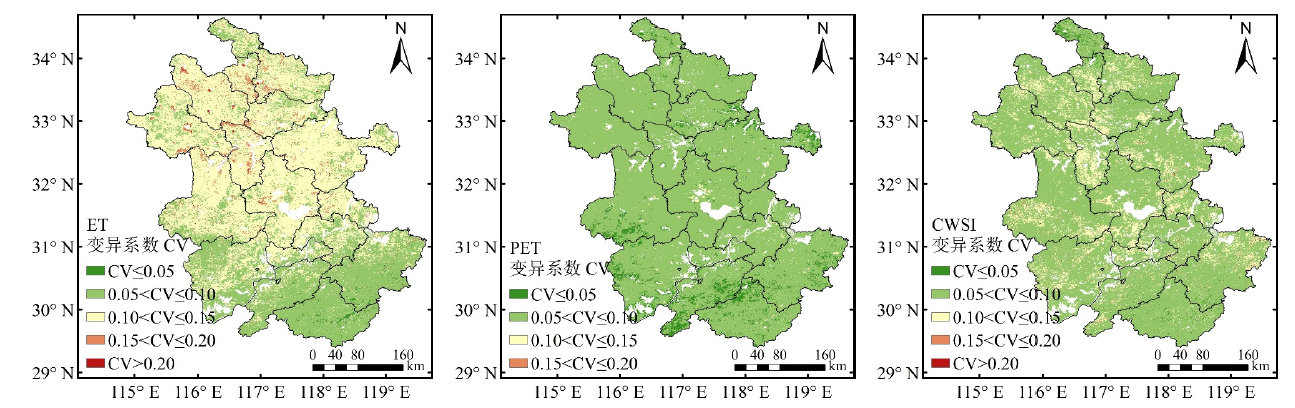
图6 安徽省2000—2019年ET、PET和CWSI变异系数空间分布
Fig. 6 Spatial distribution of the CV of ET, PET and CWSI in Anhui Province during 2000-2019
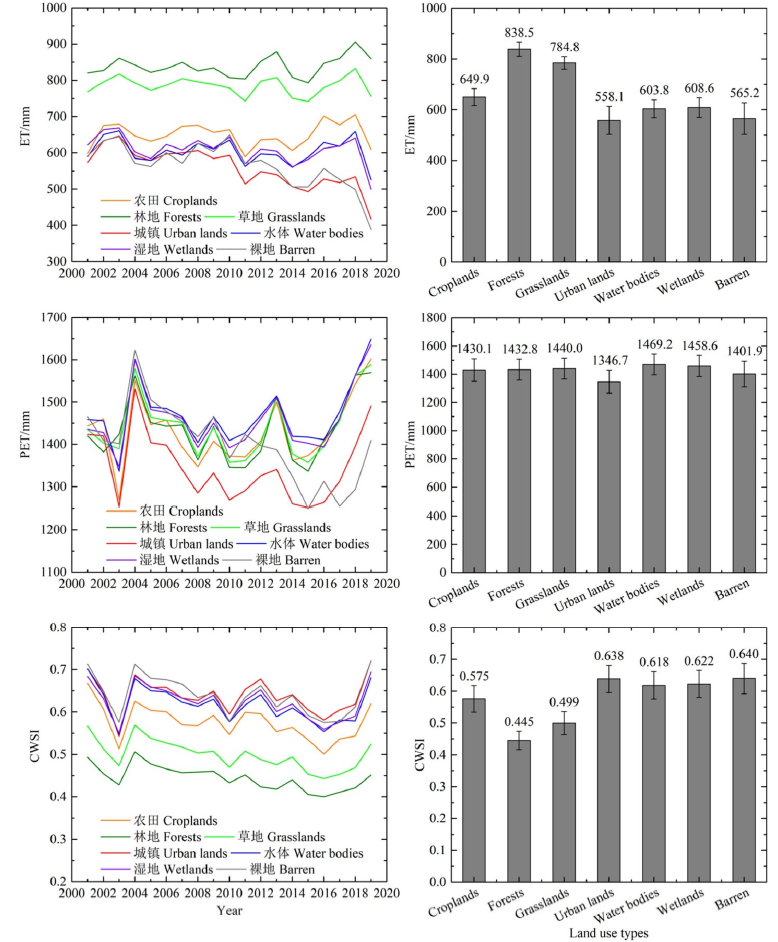
图7 不同土地利用类型ET、PET和CWSI变化特征
Fig. 7 Variation characteristics of ET, PET and CWSI in different land use types
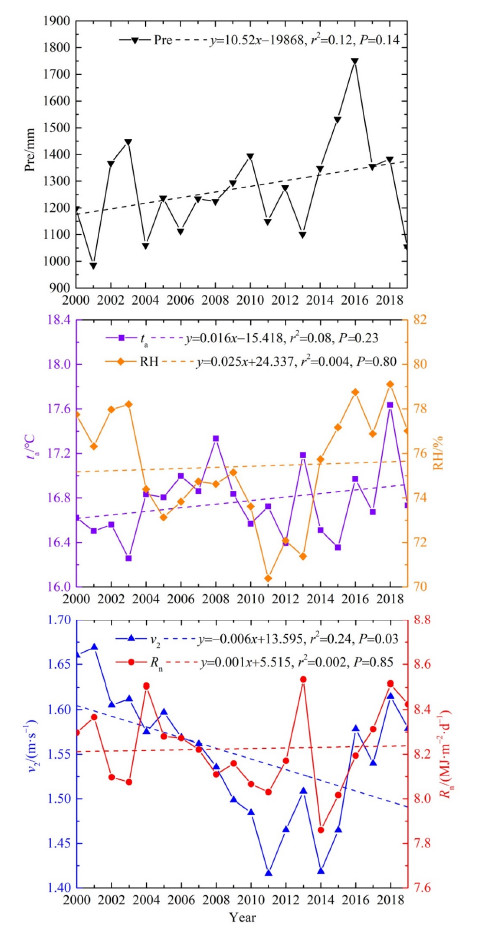
图8 安徽省2000—2019年气象要素变化趋势
Fig. 8 Change trends of meteorological factors in Anhui province during 2000-2019

图9 安徽省ET、PET和CWSI与气象要素之间的相关性 以上各分图中样本量n均为740
Fig. 9 Correlation relationship between ET, PET, CWSI and meteorological factors in Anhui province The sample size n in the above subgraphs is 740
| [1] | BASTIAANSSEN W G M, MENENTI M, FEDDES R A, et al., 1998a. A remote sensing surface energy balance algorithm for land (SEBAL): 1. Formulation[J]. Journal of Hydrology, 212-213: 198-212. |
| [2] | BASTIAANSSEN W G M, PELGRUM H, WANG J, et al., 1998b. A remote sensing surface energy balance algorithm for land (SEBAL): Part 2: Validation[J]. Journal of Hydrology, 212-213: 213-229. |
| [3] |
DU J, SONG K, 2017. Validation of global evapotranspiration product (MOD16) using flux tower data from Panjin Coastal Wetland, northeast China[J]. Chinese Geographical Science, 28(3): 420-429.
DOI URL |
| [4] |
GOWDA P H, CHAVEZ J L, COLAIZZI P D, et al., 2008. ET mapping for agricultural water management: Present status and challenges[J]. Irrigation Science, 26(3): 223-237.
DOI URL |
| [5] | HUANG K, LU Y, WEI Z, et al., 2019. Effects of land use and climate change on spatiotemporal changes of evapotranspiration in Haihe River Basin[J]. Journal of Geographical Sciences, 21(12): 1888-1902. |
| [6] |
JACKSON R D, IDSO S B, REGINATO R J, et al., 1981. Canopy temperature as a crop water stress indicator[J]. Water Resources Research, 17(4): 1133-1138.
DOI URL |
| [7] |
JACKSON R D, KUSTAS W P, CHOUDHURY B J, 1988. A reexamination of the crop water stress index[J]. Irrigation Science, 9(4): 309-317.
DOI URL |
| [8] |
JHAJHARIA D, SHRIVASTAVA S K, SARKAR D, et al., 2009. Temporal characteristics of pan evaporation trends under the humid conditions of northeast India[J]. Agricultural and Forest Meteorology, 149(5): 763-770.
DOI URL |
| [9] | KENDALL M G, 1975. Rank Correlation Methods[M]. London: Griffin. |
| [10] |
LI M, CHU R H, SHEN S H, et al., 2018. Quantifying climatic impact on reference evapotranspiration trends in the Huai River basin of eastern China[J]. Water, 10(2): 144.
DOI URL |
| [11] |
LI Y Z, LIANG K, BAI P, et al., 2016. The spatiotemporal variation of reference evapotranspiration and the contribution of its climatic factors in the Loess Plateau, China[J]. Environmental Earth Sciences, 75(4): 1-14.
DOI URL |
| [12] |
MANN H B, 1945. Nonparametric test against trend[J]. Econometrica, 13(3): 245-259.
DOI URL |
| [13] |
MIRALLES D G, HOLMES T R H, JEU R A M D, et al., 2011. Global land-surface evaporation estimated from satellite-based observations[J]. Hydrology and Earth System Sciences, 15(2): 453-469.
DOI URL |
| [14] |
MU Q Z, ZHAO M S, RUNNING S W, 2011. Improvements to a MODIS global terrestrial evapotranspiration algorithm[J]. Remote Sensing of Environment, 115(8): 1781-1800.
DOI URL |
| [15] |
NORMAN J M, KUSTAS W P, HUMES K S, 1995. Source approach for estimating soil and vegetation energy fluxes in observations of directional radiometric surface temperature[J]. Agricultural and Forest Meteorology, 77(3-4): 263-293.
DOI URL |
| [16] |
ROERINK G J, SU Z, MENENTI M, 2000. S-SEBI: A simple remote sensing algorithm to estimate the surface energy balance[J]. Physics and Chemistry of the Earth (B), 25: 147-157.
DOI URL |
| [17] |
SANCHEZ J M, KUSTAS W P, CASELLES V, et al., 2008. Modelling surface energy fluxes over maize using a two-source patch model and radiometric soil and canopy temperature observations[J]. Remote Sensing of Environment, 112(3): 1130-1143.
DOI URL |
| [18] |
SEN P K, 1968. Estimates of the regression coefficient based on Kendall's Tau[J]. Journal of the American Statistical Association, 63(324): 1379-1389.
DOI URL |
| [19] |
SHEFFIELD J, WOOD E F, RODERICK M L, 2012. Little change in global drought over the past 60 years[J]. Nature, 491(7424): 435-438.
DOI URL |
| [20] |
SU Z, 2002. The Surface Energy Balance System (SEBS) for estimation of turbulent heat fluxes[J]. Hydrology and Earth System Sciences, 6(1): 85-99.
DOI URL |
| [21] |
TABARI H, MAROFI S, 2011. Changes of pan evaporation in the west of Iran[J]. Water Resources Management, 25(1): 97-111.
DOI URL |
| [22] | THEIL H, 1992. A Rank-Invariant Method of Linear and Polynomial Regression Analysis[M]. Dordrecht: Springer: 345-381. |
| [23] |
THOMAS A, 2008. Development and properties of 0.25 degree gridded evapotranspiration data fields of China for hydrological studies[J]. Journal of Hydrology, 358(3-4): 145-158.
DOI URL |
| [24] |
WALTER M T, WILKS D S, PARLANGE J Y, 2004. Increasing evapotranspiration from the conterminous united states[J]. Journal of Hydrometeorology, 5(3): 405-408.
DOI URL |
| [25] |
XU C Y, GONG L, JIANG T, et al., 2006. Analysis of spatial distribution and temporal trend of reference evapotranspiration and pan evaporation in Changjiang (Yangtze River) catchment[J]. Journal of Hydrology, 327(1-2): 81-93.
DOI URL |
| [26] | 邓兴耀, 刘洋, 刘志辉, 等, 2017. 中国西北干旱区蒸散发时空动态特征[J]. 生态学报, 37(9): 2994-3008. |
| DENG X Y, LIU Y, LIU Z H, et al., 2017. Temporal-spatial dynamic change characteristics of evapotranspiration in arid region of northwest China[J]. Acta Ecologica Sinica, 37(9): 2994-3008. | |
| [27] | 范建忠, 李登科, 高茂盛, 2014. 基于MOD16的陕西省蒸散量时空分布特征[J]. 生态环境学报, 23(9): 1536-1543. |
| FAN J Z, LI D K, GAO M S, 2014. Spatio-temporal variations of evapotranspiration in Shaanxi province using MOD16 products[J]. Ecology and Environmental Sciences, 23(9): 1536-1543. | |
| [28] | 冯飞, 姚云军, 张彦彬, 等, 2015. 基于MOD16产品的三江平原蒸散量时空分布特征分析[J]. 生态环境学报, 24(11): 1858-1864. |
| FENG F, YAO Y J, ZHANG Y B, et al., 2015. Spatio-temporal Variations of Evapotranspiration in Sanjiang Plain Using MOD16 Products[J]. Ecology and Environmental Sciences, 24(11): 1858-1864. | |
| [29] | 何慧娟, 卓静, 李红梅, 等, 2016. 基于MOD16 产品的陕西关中地区干旱时空分布特征[J]. 干旱地区农业研究, 34(1): 236-241. |
| HE H J, ZHUO J, LI H M, et al., 2016. Spatial-temporal distribution characteristics of drought in Guanzhong region of Shaanxi Province based on MOD16 products[J]. Agricultural Research in the Arid Areas, 34(1): 236-241. | |
| [30] | 马梓策, 于红博, 张巧凤, 2020. 2000—2017年锡林河流域地表蒸散量的时空特征及其影响因素[J]. 中国农村水利水电 (3): 18-24. |
| MA Z C, YU H B, ZHANG Q F, 2020. Spatio-temporal characteristics of evapotranspiration and its influencing factors in Xilin River Basin from 2000 to 2017 [J]. China Rural Water and Hydropower (3): 18-24. | |
| [31] | 田义超, 梁铭忠, 胡宝清, 2015. 2000—2013年北部湾海岸带蒸散量时空动态特征[J]. 农业机械学报, 46(8): 146-158. |
| TIAN Y C, LIANG M Z, HU B Q, 2015. Temporal-spatial dynamic change characteristics of evapotranspiration in Beibu Gulf Coastal Zone during 2000-2013 [J]. Transactions of the Chinese Society for Agricultural Machinery, 46(8): 146-158. | |
| [32] | 王鹏涛, 延军平, 蒋冲, 等, 2016. 2000—2012年陕甘宁黄土高原区地表蒸散时空分布及影响因素[J]. 中国沙漠, 36(2): 499-507. |
| WANG P T, YAN J P, JIANG C, et al., 2016. Spatial and temporal variations of evapotranspiration and its influencing factors in the Loess Plateau in Shaanxi-Gansu-Ningxia region[J]. Journal of Desert Research, 36(2): 499-507. | |
| [33] | 位贺杰, 张艳芳, 朱妮, 等, 2015. 基于MOD16数据的渭河流域地表实际蒸散发时空特征[J]. 中国沙漠, 35(2): 414-422. |
| WEI H J, ZHANG Y F, ZHU N, et al., 2015. Spatial and temporal characteristic of ET in the Weihe river basin based on MOD16 data[J]. Journal of Desert Research, 35(2): 414-422 | |
| [34] | 吴必文, 温华洋, 叶朗明, 等, 2009. 安徽地区近45年蒸发皿蒸发量变化特征及影响因素初探[J]. 长江流域资源与环境, 18(7): 620-624. |
| WU B W, WEN H Y, YE L M, et al., 2009. Variation and influencing factors of pan evaporation in Anhui province in latest 45 years[J]. Resources and Environment in the Yangtze Basin, 18(7): 620-624. | |
| [35] | 吴桂平, 刘元波, 赵晓松, 等, 2013. 基于MOD16产品的鄱阳湖流域地表蒸散量时空分布特征[J]. 地理研究, 32(4): 617-627. |
| WU G P, LIU Y B, ZHAO X S, et al., 2013. Spatio-temporal variations of evapotranspiration in Poyang Lake Basin using MOD16 products[J]. Geographical Research, 32(4): 617-627. | |
| [36] | 吴文玉, 孔芹芹, 王晓东, 等, 2013. 安徽省近40年参考作物蒸散量的敏感性分析[J]. 生态环境学报, 22(7): 1160-1166. |
| WU W Y, KONG Q Q, WANG X D, et al., 2013. Sensitivity analysis of reference crop evapotranspiration in Anhui province in the recent 40 years[J]. Ecology and Environmental Sciences, 22(7): 1160-1166. | |
| [37] | 杨炳玉, 申双和, 张富存, 等, 2015. 不同尺寸蒸渗仪测定作物蒸散的田间试验研究[J]. 中国农业气象, 36(2): 161-169. |
| YANG B Y, SHEN S H, ZHANG F C, et al., 2015. Field experiment on crop evapotranspiration measurements via lysimeters with different scales[J]. Chinese Journal of Agrometeorology, 36(2): 161-169. | |
| [38] |
叶红, 张廷斌, 易桂花, 2018. 2000—2014年黄河源区ET时空特征及其与气候因子关系[J]. 地理学报, 73(11): 2117-2134.
DOI |
| YE H, ZHANG T B, YI G H, et al., 2018. Spatio-temporal characteristics of evapotranspiration and its relationship with climate factors in the source region of the Yellow River from 2000 to 2014 [J]. Acta Geographica Sinica, 73(11): 2117-2134. | |
| [39] | 喻元, 白建军, 王建博, 等, 2015. 基于MOD16的关中地区实际蒸散发时空特征分析[J]. 干旱地区农业研究, 33(3): 245-253. |
| YU Y, BAI J J, WANG J B, et al., 2015. Analysis on sptio-temporal characteristics of ET based on MOD16 in Guanzhong Region. Agricultural Research in the Arid Areas, 33(3): 245-253. | |
| [40] | 张猛, 曾永年, 齐玥, 2018. 基于MOD16的洞庭湖流域2000—2014年地表蒸散时空变化分析[J]. 农业工程学报, 34(20): 160-168. |
| ZHANG M, ZENG Y N, QI Y, 2018. Analyzing spatio-temporal variations of evapotranspiration in Dongting Lake Basin during 2000-2014 based on MOD16[J]. Transactions of the Chinese Society of Agricultural Engineering (Transactions of the CSAE), 34(20): 160-168. | |
| [41] | 张特, 刘冀, 董晓华, 等, 2018. 基于MOD16的澴河流域蒸散发时空分布特征[J]. 灌溉排水学报, 37(8): 121-128. |
| ZHANG T, LIU J, DONG X H, et al., 2018. Spatiotemporal variation of evapotranspiration in Huan River basin using the MOD16 dataset[J]. Journal of Irrigation and Drainage, 37(8): 121-128. |
| [1] | 胡启瑞, 吉春容, 李迎春, 王雪姣, 杨明凤, 郭燕云. 膜下滴灌棉花蕾期干旱胁迫对光合特性及产量的影响[J]. 生态环境学报, 2023, 32(6): 1045-1052. |
| [2] | 王超, 杨倩楠, 张池, 刘同旭, 张晓龙, 陈静, 刘科学. 丹霞山不同土地利用方式土壤磷组分特征及其有效性[J]. 生态环境学报, 2023, 32(5): 889-897. |
| [3] | 葛元凯, 赵龙龙, 陈劲松, 任彦霓, 李洪忠. 1983-2020年西南地区气象干旱时空演变趋势及干旱事件识别[J]. 生态环境学报, 2023, 32(5): 920-932. |
| [4] | 李建辉, 党争, 陈琳. 黄河几字弯都市圈PM2.5时空特征及影响因素分析[J]. 生态环境学报, 2023, 32(4): 697-705. |
| [5] | 张林, 齐实, 周飘, 伍冰晨, 张岱, 张岩. 北京山区针阔混交林地土壤有机碳含量的影响因素研究[J]. 生态环境学报, 2023, 32(3): 450-458. |
| [6] | 何艳虎, 龚镇杰, 吴海彬, 蔡宴朋, 杨志峰, 陈晓宏. 粤港澳大湾区城市生态效率时空演变及影响因素[J]. 生态环境学报, 2023, 32(3): 469-480. |
| [7] | 郝金虎, 韦玮, 李胜男, 马牧源, 李肖夏, 杨洪国, 姜琦宇, 柴沛东. 基于GEE平台的京津冀长时序水体时空格局及其影响因素[J]. 生态环境学报, 2023, 32(3): 556-566. |
| [8] | 张莉, 李铖, 谭皓泽, 韦家怡, 程炯, 彭桂香. 广州典型城市林地对大气颗粒物的削减效应及影响因素[J]. 生态环境学报, 2023, 32(2): 341-350. |
| [9] | 郑晓豪, 陈颖彪, 郑子豪, 郭城, 黄卓男, 周泳诗. 湖北省生态系统服务价值动态变化及其影响因素演变[J]. 生态环境学报, 2023, 32(1): 195-206. |
| [10] | 袁林江, 李梦博, 冷钢, 钟冰冰, 夏大朋, 王景华. 厌氧环境下硫酸盐还原与氨氧化的协同作用[J]. 生态环境学报, 2023, 32(1): 207-214. |
| [11] | 刘希林, 卓瑞娜. 崩岗崩积体坡面初始产流时间影响因素及其临界阈值[J]. 生态环境学报, 2023, 32(1): 36-46. |
| [12] | 李威闻, 黄金权, 齐瑜洁, 刘小岚, 刘纪根, 毛治超, 高绣纺. 土壤侵蚀条件下土壤微生物生物量碳含量变化及其影响因素的Meta分析[J]. 生态环境学报, 2023, 32(1): 47-55. |
| [13] | 韩翠, 康扬眉, 余海龙, 李冰, 黄菊莹. 荒漠草原凋落物分解过程中降水量对土壤酶活性的影响[J]. 生态环境学报, 2022, 31(9): 1802-1812. |
| [14] | 陈乐, 卫伟. 西北旱区典型流域土地利用与生境质量的时空演变特征[J]. 生态环境学报, 2022, 31(9): 1909-1918. |
| [15] | 苏泳松, 宋松, 陈叶, 叶子强, 钟润菲, 王昭尧. 珠江三角洲人类活动净氮输入时空特征及其影响因素[J]. 生态环境学报, 2022, 31(8): 1599-1609. |
| 阅读次数 | ||||||
|
全文 |
|
|||||
|
摘要 |
|
|||||