Ecology and Environmental Sciences ›› 2025, Vol. 34 ›› Issue (8): 1240-1254.DOI: 10.16258/j.cnki.1674-5906.2025.08.009
• Research Article [Ecology] • Previous Articles Next Articles
ZHANG Shengbo1( ), WU Zuohang2,3, DANG Haofei2, LIAO Kuo2, LU Dengsheng1, LI Dengqiu1,*()
Received:2025-02-19
Online:2025-08-18
Published:2025-08-01
张晟博1(), 吴作航2,3, 党皓飞2, 廖廓2, 陆灯盛1, 李登秋1,*()
通讯作者:
*E-mail: 作者简介:张晟博(2002年生),男,硕士研究生,研究方向为极端气候、森林碳循环。E-mail: 572042526@qq.com
基金资助:CLC Number:
ZHANG Shengbo, WU Zuohang, DANG Haofei, LIAO Kuo, LU Dengsheng, LI Dengqiu. The Response and Differences of Different Remote Sensing Vegetation Indices to Extreme Climate Events in the Wuyi Mountain Region over the Last 20 Years[J]. Ecology and Environmental Sciences, 2025, 34(8): 1240-1254.
张晟博, 吴作航, 党皓飞, 廖廓, 陆灯盛, 李登秋. 近20年武夷山地区不同遥感指标对极端气候事件的响应及差异[J]. 生态环境学报, 2025, 34(8): 1240-1254.
Add to citation manager EndNote|Ris|BibTeX
URL: https://www.jeesci.com/EN/10.16258/j.cnki.1674-5906.2025.08.009

Figure 1 Geographical location, topography, and distribution of meteorological stations in the study area
| 类别 | 名称 | 数据 | 原始分辨率 | 本研究 | 来源 |
|---|---|---|---|---|---|
| 气象 数据 | 气象数据 | 逐日最高最低气温、降水量 | 基于站点,日尺度 | 基于站点,日尺度 | |
| 遥感 指标 | 核归一化植被指数(kNDVI) | MODIS/061/ MOD13Q1 | 250 m×250 m, 16 d | 250 m×250 m, 年尺度 | |
| 增强型植被指数(EVI) | |||||
| 净初级生产力(NPP) | MODIS/061/ MOD17A3HGF | 500 m×500 m, 年尺度 | 250 m×250 m, 年尺度 | | |
| 森林压力指数(FSI) | MODIS/006/ MOD11A1 | 1 km×1 km, 日尺度 | 250 m×250 m, 年尺度 | | |
| MODIS/006/ MOD16A2 | 500 m×500 m, 8 d | 250 m×250 m, 年尺度 | | ||
| 中国1 km分辨率逐月降水数据集 (1901-2021) | 0.0083°×0.0083°, 月尺度 | 250 m×250 m, 年尺度 | Peng et al., | ||
| 环境 变量 | 高程 | USGS/ SRTMGL1_003 | 30 m×30 m, 静态变量 | 30 m×30 m, 静态变量 | |
| 坡度 | |||||
| 坡向 | |||||
| 土壤类型 | 中国土壤类型空间分布数据集 | 1 km×1 km, 静态变量 | 1 km×1 km, 静态变量 | | |
| 土壤质地 (砂土、粉砂土、黏土) | 中国土壤质地空间分布数据集 | 1 km×1 km, 静态变量 | 1 km×1 km, 静态变量 | ||
| 冠层高度 | ETH Global Sentinel-2 | 10 m×10 m, 静态变量 | 10 m×10 m, 静态变量 | Lang et al., | |
| 土地覆盖类型 | GLC_FCS30 | 30 m×30 m,年尺度 | 30 m×30 m,年尺度 | Zhang et al., |
Table 1 Data source
| 类别 | 名称 | 数据 | 原始分辨率 | 本研究 | 来源 |
|---|---|---|---|---|---|
| 气象 数据 | 气象数据 | 逐日最高最低气温、降水量 | 基于站点,日尺度 | 基于站点,日尺度 | |
| 遥感 指标 | 核归一化植被指数(kNDVI) | MODIS/061/ MOD13Q1 | 250 m×250 m, 16 d | 250 m×250 m, 年尺度 | |
| 增强型植被指数(EVI) | |||||
| 净初级生产力(NPP) | MODIS/061/ MOD17A3HGF | 500 m×500 m, 年尺度 | 250 m×250 m, 年尺度 | | |
| 森林压力指数(FSI) | MODIS/006/ MOD11A1 | 1 km×1 km, 日尺度 | 250 m×250 m, 年尺度 | | |
| MODIS/006/ MOD16A2 | 500 m×500 m, 8 d | 250 m×250 m, 年尺度 | | ||
| 中国1 km分辨率逐月降水数据集 (1901-2021) | 0.0083°×0.0083°, 月尺度 | 250 m×250 m, 年尺度 | Peng et al., | ||
| 环境 变量 | 高程 | USGS/ SRTMGL1_003 | 30 m×30 m, 静态变量 | 30 m×30 m, 静态变量 | |
| 坡度 | |||||
| 坡向 | |||||
| 土壤类型 | 中国土壤类型空间分布数据集 | 1 km×1 km, 静态变量 | 1 km×1 km, 静态变量 | | |
| 土壤质地 (砂土、粉砂土、黏土) | 中国土壤质地空间分布数据集 | 1 km×1 km, 静态变量 | 1 km×1 km, 静态变量 | ||
| 冠层高度 | ETH Global Sentinel-2 | 10 m×10 m, 静态变量 | 10 m×10 m, 静态变量 | Lang et al., | |
| 土地覆盖类型 | GLC_FCS30 | 30 m×30 m,年尺度 | 30 m×30 m,年尺度 | Zhang et al., |
| 类别 | 指数代码 | 指数名称 | 定义 | 单位 |
|---|---|---|---|---|
| 极端气温指数 | TX90p | 暖昼日数 | 最高气温>90%分位值的日数比例 | % |
| TN90p | 暖夜日数 | 最低气温>90%分位值的日数比例 | % | |
| TX10p | 冷昼日数 | 最高气温<10%分位值的日数比例 | % | |
| TN10p | 冷夜日数 | 最低气温<10%分位值的日数比例 | % | |
| TXx | 年最大日最高气温 | 年内日最高气温的最大值 | ℃ | |
| TNx | 年最大日最低气温 | 年内日最低气温的最大值 | ℃ | |
| TXn | 年最小日最高气温 | 年内日最高气温的最小值 | ℃ | |
| TNn | 年最小日最低气温 | 年内日最低气温的最小值 | ℃ | |
| CSDI3 | 持续冷日指数 | 连续3 d最低气温<90%分位值日数 | d | |
| WSDI3 | 持续暖日指数 | 连续3 d最高气温>90%分位值日数 | d | |
| SU | 夏日日数 | 年内日最高气温>25 ℃的日数 | d | |
| TR | 热夜日数 | 年内日最低气温>20 ℃的日数 | d | |
| DTR | 气温日较差 | 年内日最高气温与最低气温的差值 | ℃ | |
| 极端干旱指数 | SPEI | 标准化降水蒸散发指数 | 使用降水和气温数据计算得到的表征干湿状态的指数 | 无 |
| 极端降水指数 | CDD | 持续干旱日数 | 日降水量<1 mm持续日数的最大值 | d |
| CWD | 持续降水日数 | 日降水量≥1 mm持续日数的最大值 | d | |
| Rx1-d | 最大1日降水量 | 年最大日降水量 | mm | |
| Rx5-d | 最大5日降水量 | 年最大连续5日的降水量 | mm | |
| R10-mm | 中雨日数 | 年日降水量>10 mm的总日数 | d | |
| R20-mm | 极端大雨日数 | 年日降水量>20 mm的总日数 | d | |
| R50-mm | 极端暴雨日数 | 年日降水量>50 mm的总日数 | d | |
| R95p | 强降水总量 | 日降水量>95%分位值的年累积降水量 | mm | |
| SDII | 年均雨日降水强度 | 日降水量≥1 mm的总量与总日数之比 | mm∙d−1 | |
| PRCPTOT | 总降水量 | 日降水量>1 mm的年累积降水量 | mm |
Table 2 Definition of extreme climate indicators
| 类别 | 指数代码 | 指数名称 | 定义 | 单位 |
|---|---|---|---|---|
| 极端气温指数 | TX90p | 暖昼日数 | 最高气温>90%分位值的日数比例 | % |
| TN90p | 暖夜日数 | 最低气温>90%分位值的日数比例 | % | |
| TX10p | 冷昼日数 | 最高气温<10%分位值的日数比例 | % | |
| TN10p | 冷夜日数 | 最低气温<10%分位值的日数比例 | % | |
| TXx | 年最大日最高气温 | 年内日最高气温的最大值 | ℃ | |
| TNx | 年最大日最低气温 | 年内日最低气温的最大值 | ℃ | |
| TXn | 年最小日最高气温 | 年内日最高气温的最小值 | ℃ | |
| TNn | 年最小日最低气温 | 年内日最低气温的最小值 | ℃ | |
| CSDI3 | 持续冷日指数 | 连续3 d最低气温<90%分位值日数 | d | |
| WSDI3 | 持续暖日指数 | 连续3 d最高气温>90%分位值日数 | d | |
| SU | 夏日日数 | 年内日最高气温>25 ℃的日数 | d | |
| TR | 热夜日数 | 年内日最低气温>20 ℃的日数 | d | |
| DTR | 气温日较差 | 年内日最高气温与最低气温的差值 | ℃ | |
| 极端干旱指数 | SPEI | 标准化降水蒸散发指数 | 使用降水和气温数据计算得到的表征干湿状态的指数 | 无 |
| 极端降水指数 | CDD | 持续干旱日数 | 日降水量<1 mm持续日数的最大值 | d |
| CWD | 持续降水日数 | 日降水量≥1 mm持续日数的最大值 | d | |
| Rx1-d | 最大1日降水量 | 年最大日降水量 | mm | |
| Rx5-d | 最大5日降水量 | 年最大连续5日的降水量 | mm | |
| R10-mm | 中雨日数 | 年日降水量>10 mm的总日数 | d | |
| R20-mm | 极端大雨日数 | 年日降水量>20 mm的总日数 | d | |
| R50-mm | 极端暴雨日数 | 年日降水量>50 mm的总日数 | d | |
| R95p | 强降水总量 | 日降水量>95%分位值的年累积降水量 | mm | |
| SDII | 年均雨日降水强度 | 日降水量≥1 mm的总量与总日数之比 | mm∙d−1 | |
| PRCPTOT | 总降水量 | 日降水量>1 mm的年累积降水量 | mm |

Figure 2 Temporal trends of kNDVI, EVI, NPP, and FSI during 2001-2021
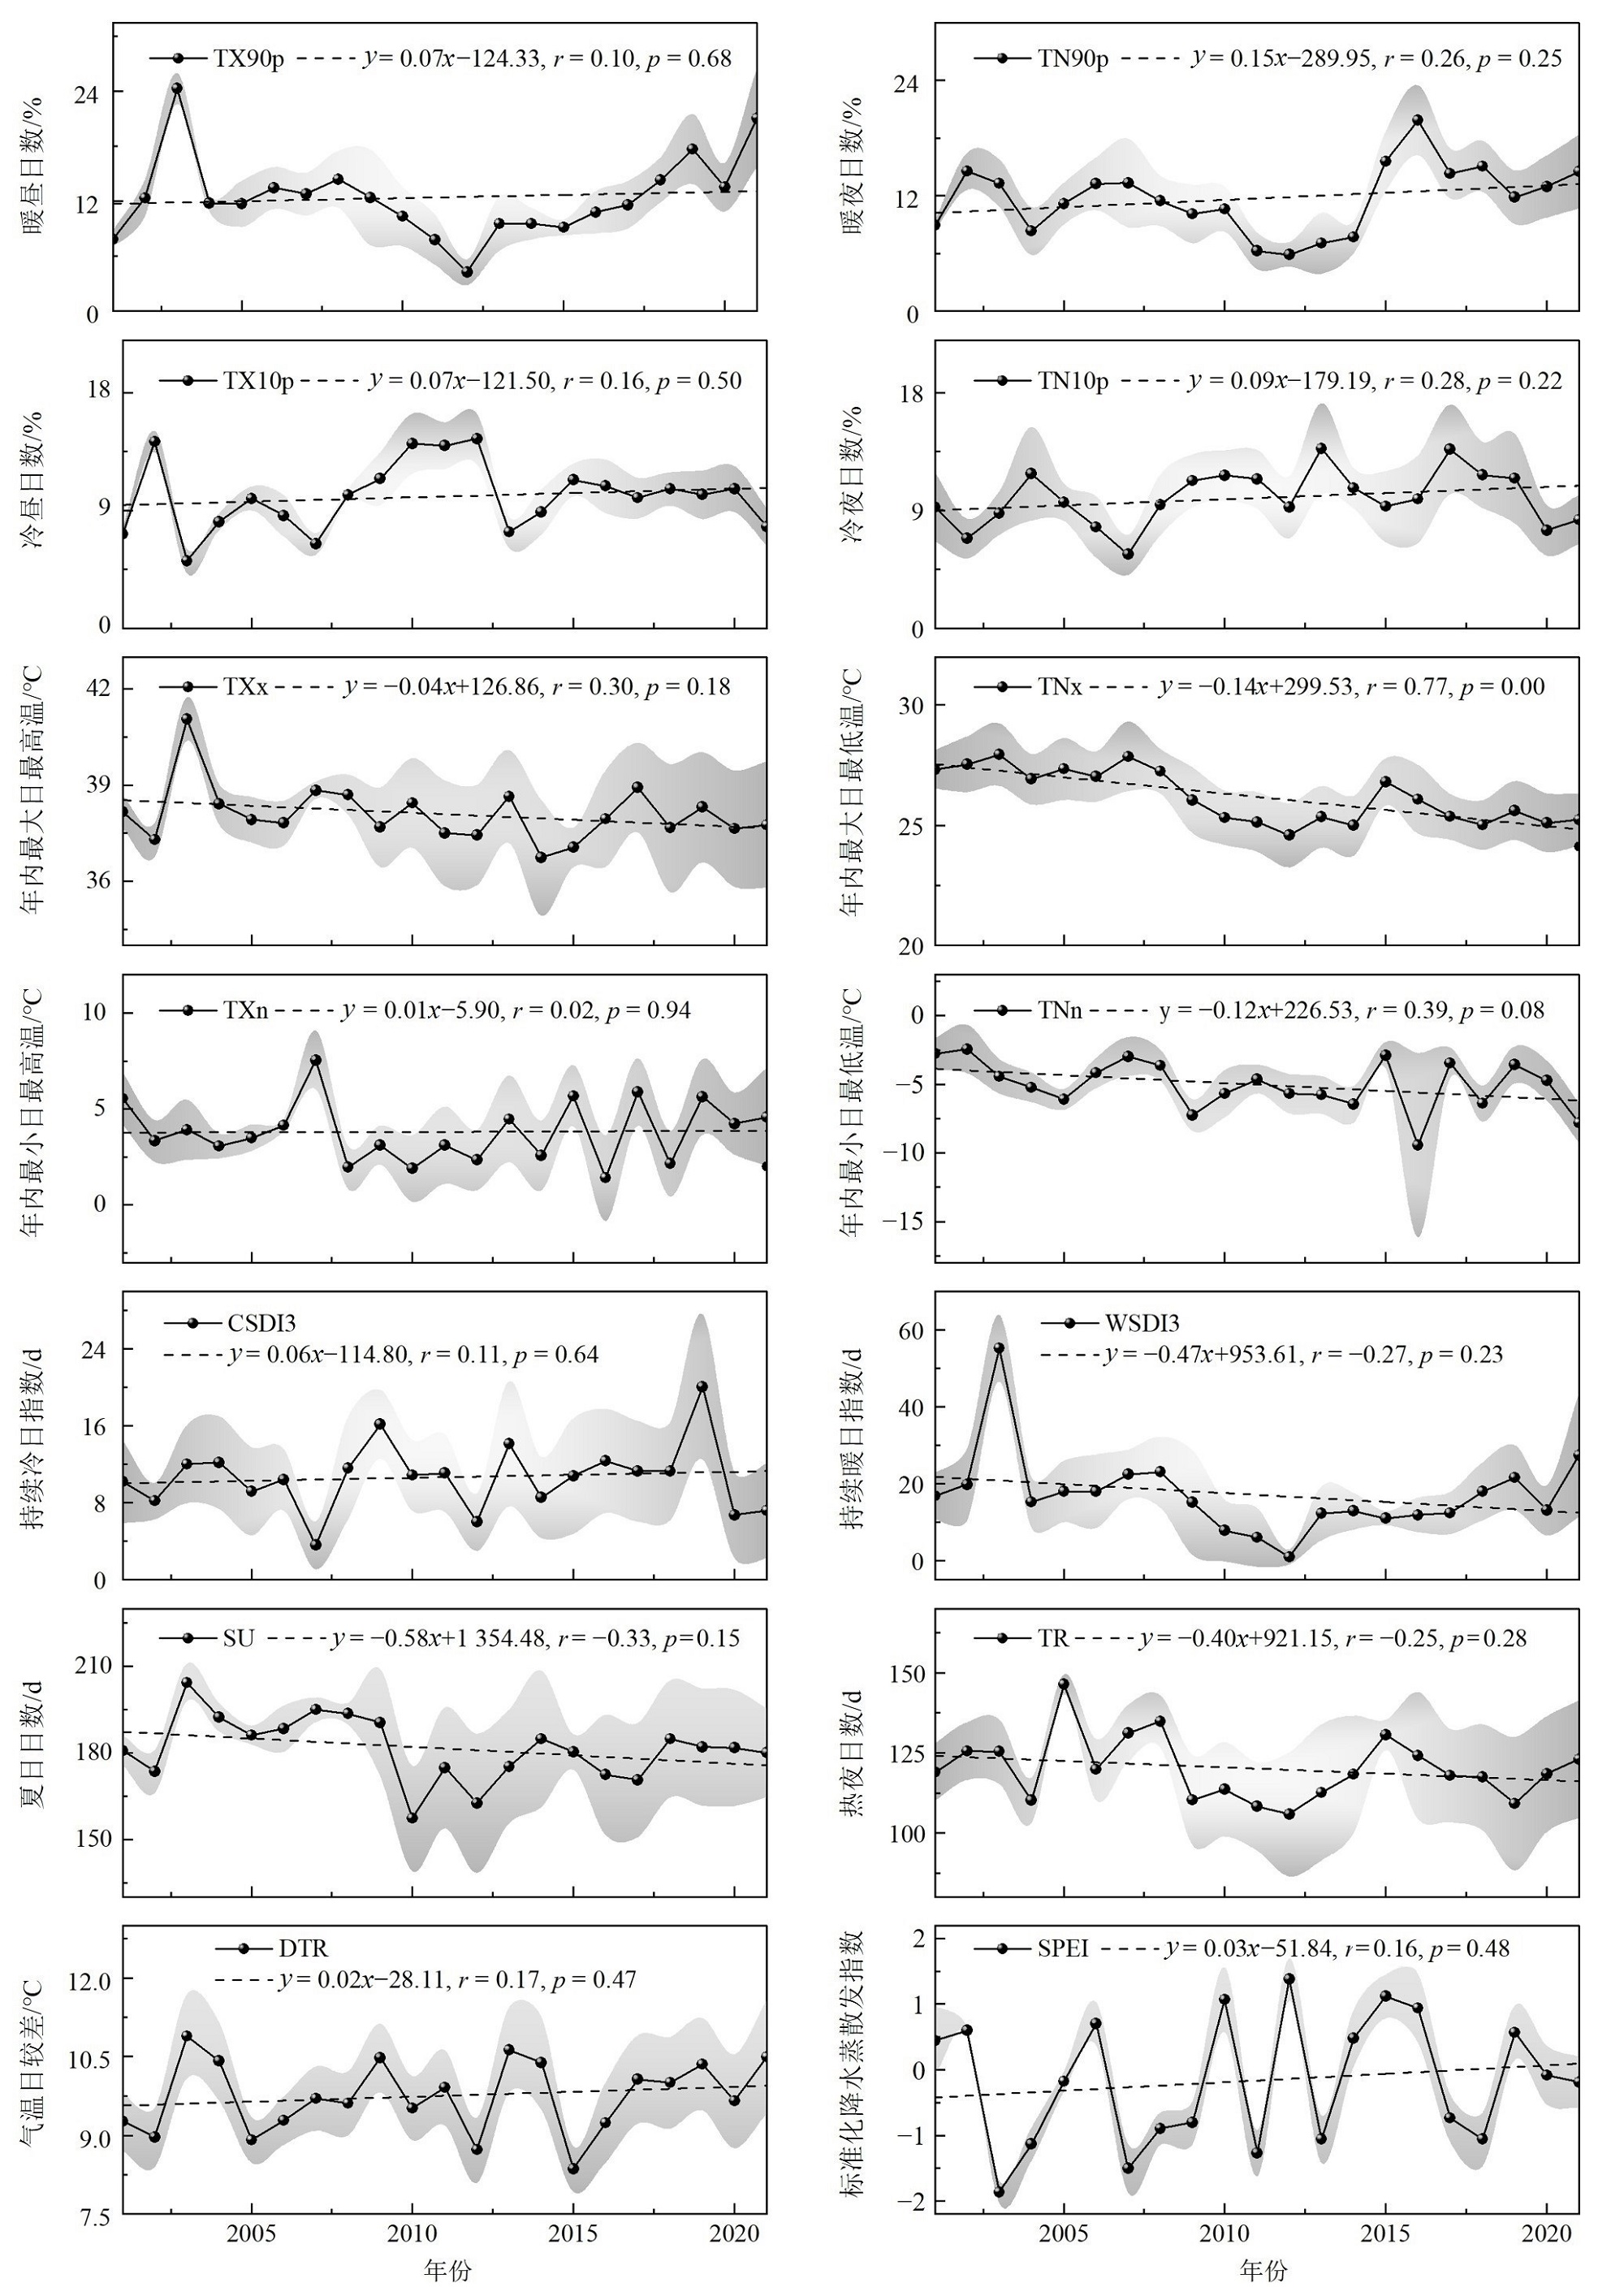
Figure 3 Interannual variation trend of extreme temperature and extreme drought indices from 2001 to 2021
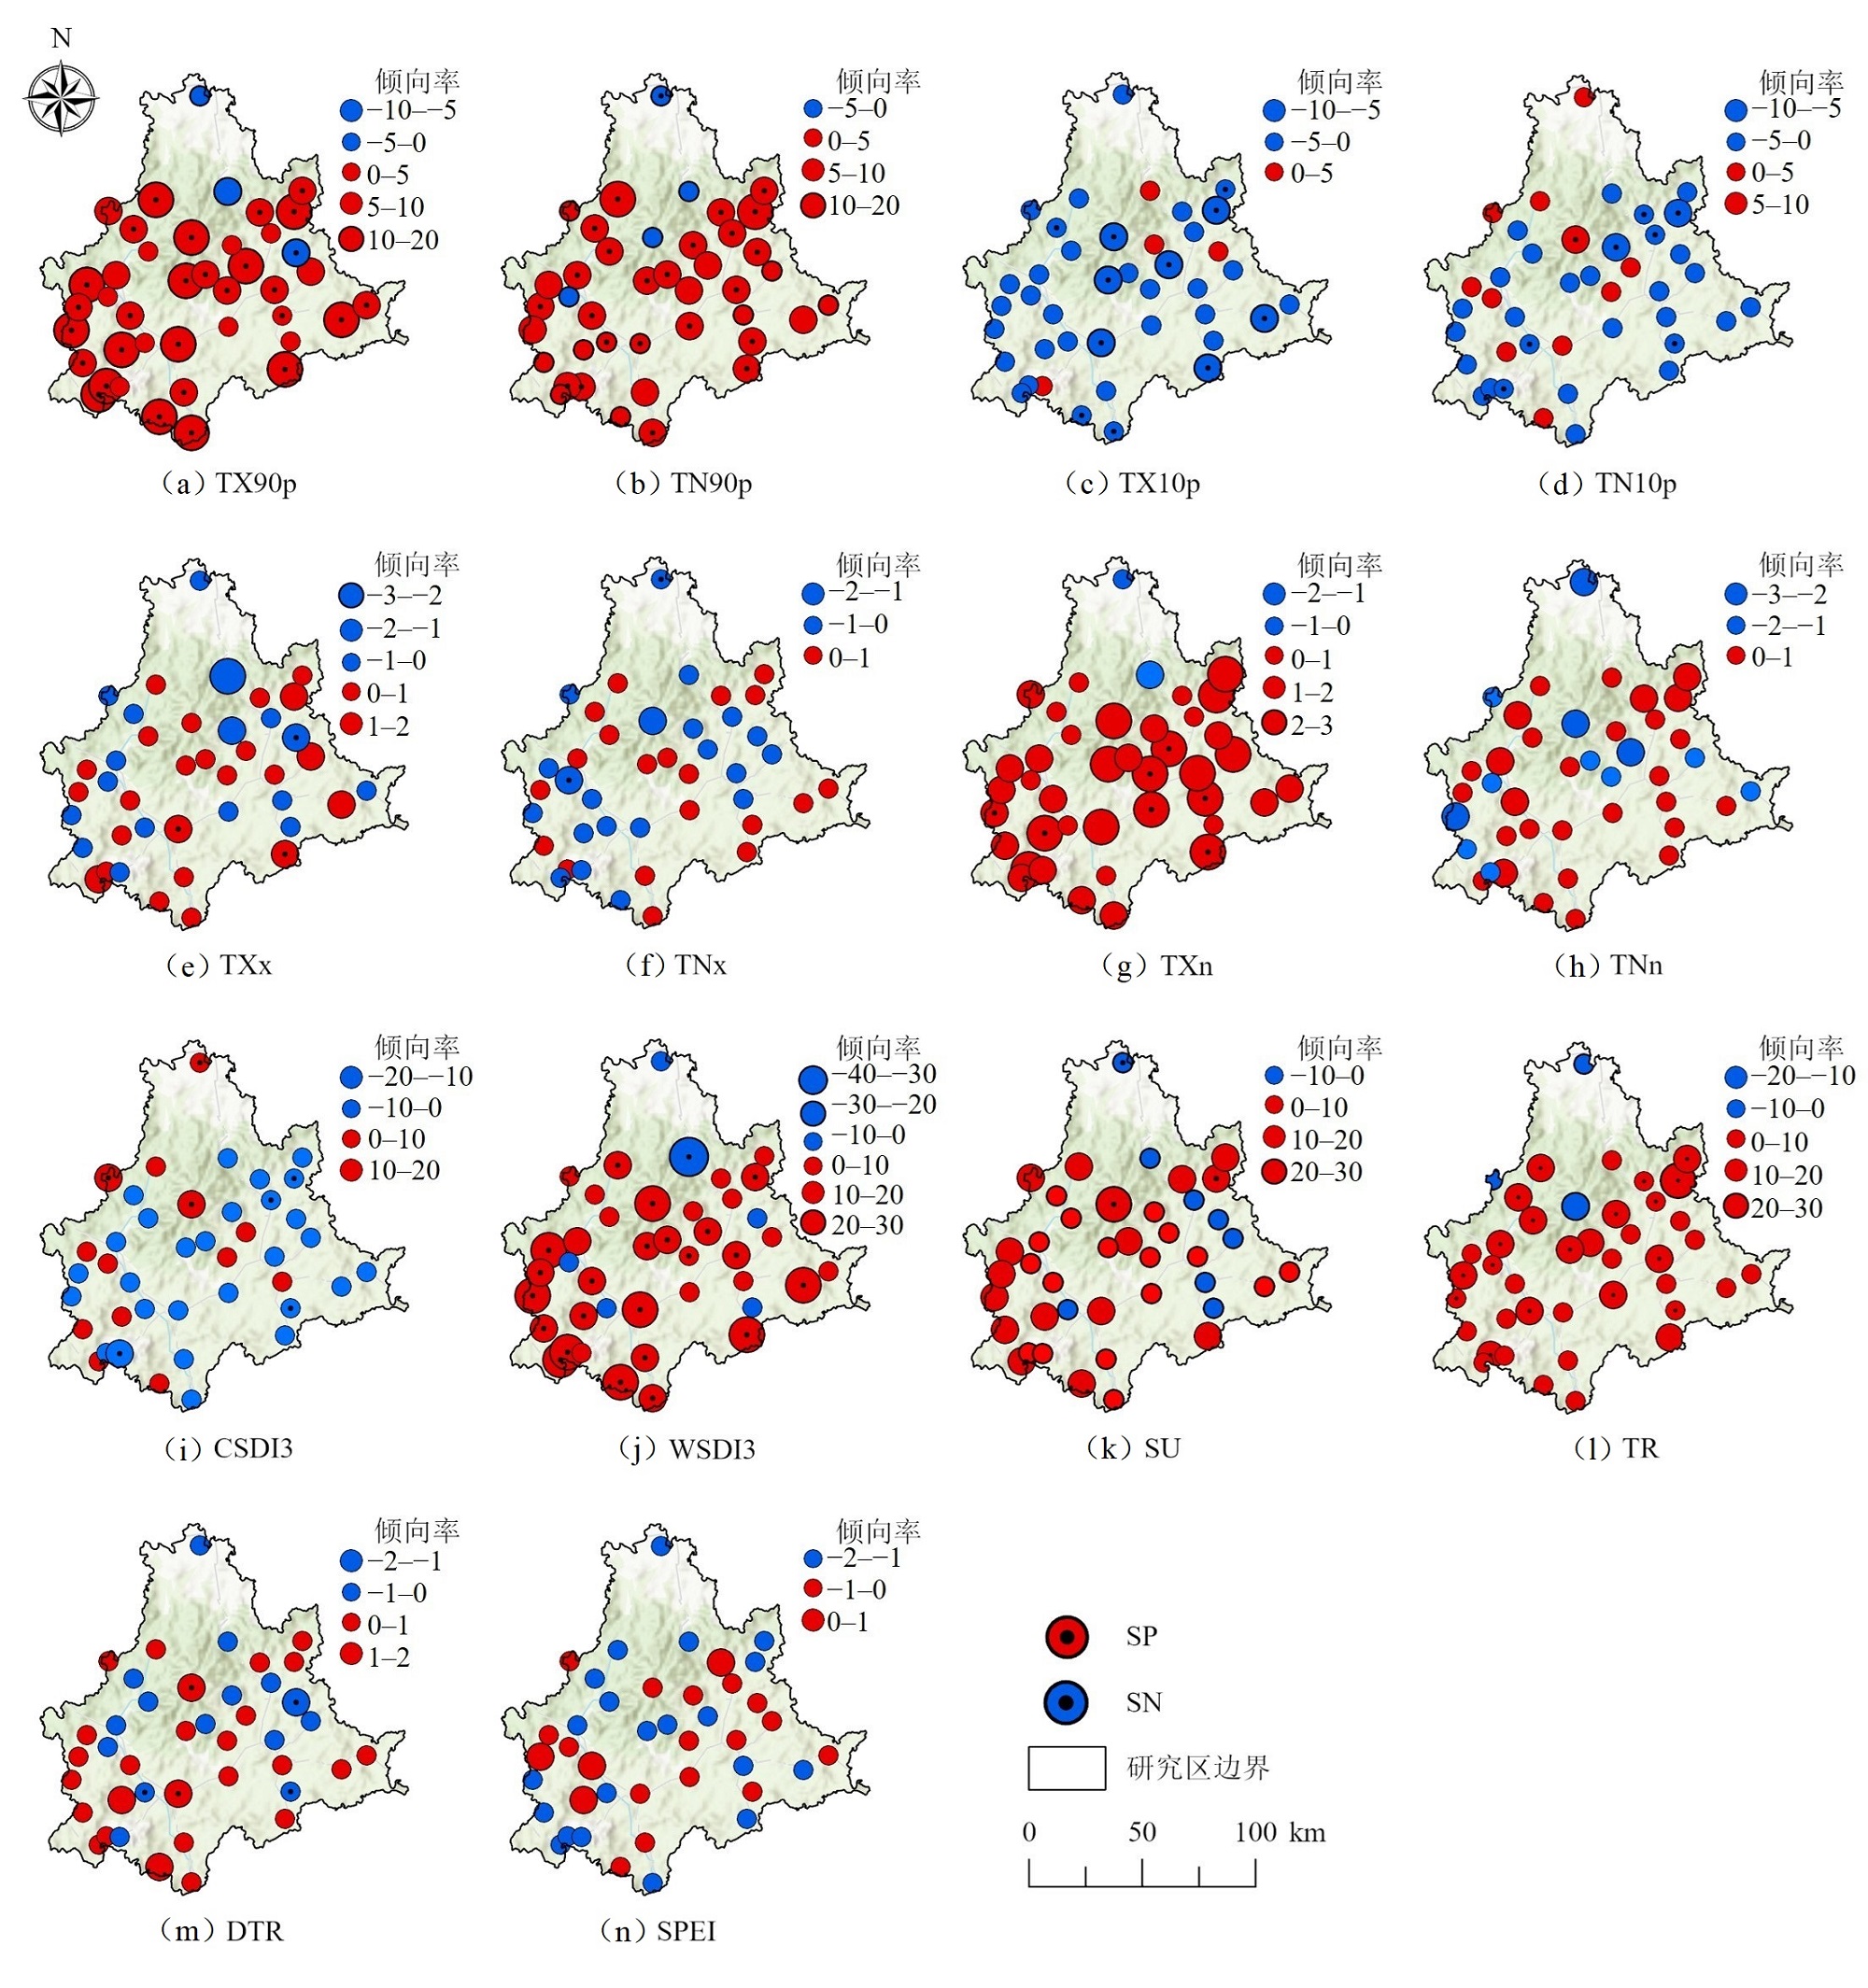
Figure 4 Spatial distribution of interannual trends of extreme temperature and drought indices in the study area from 2001 to 2021
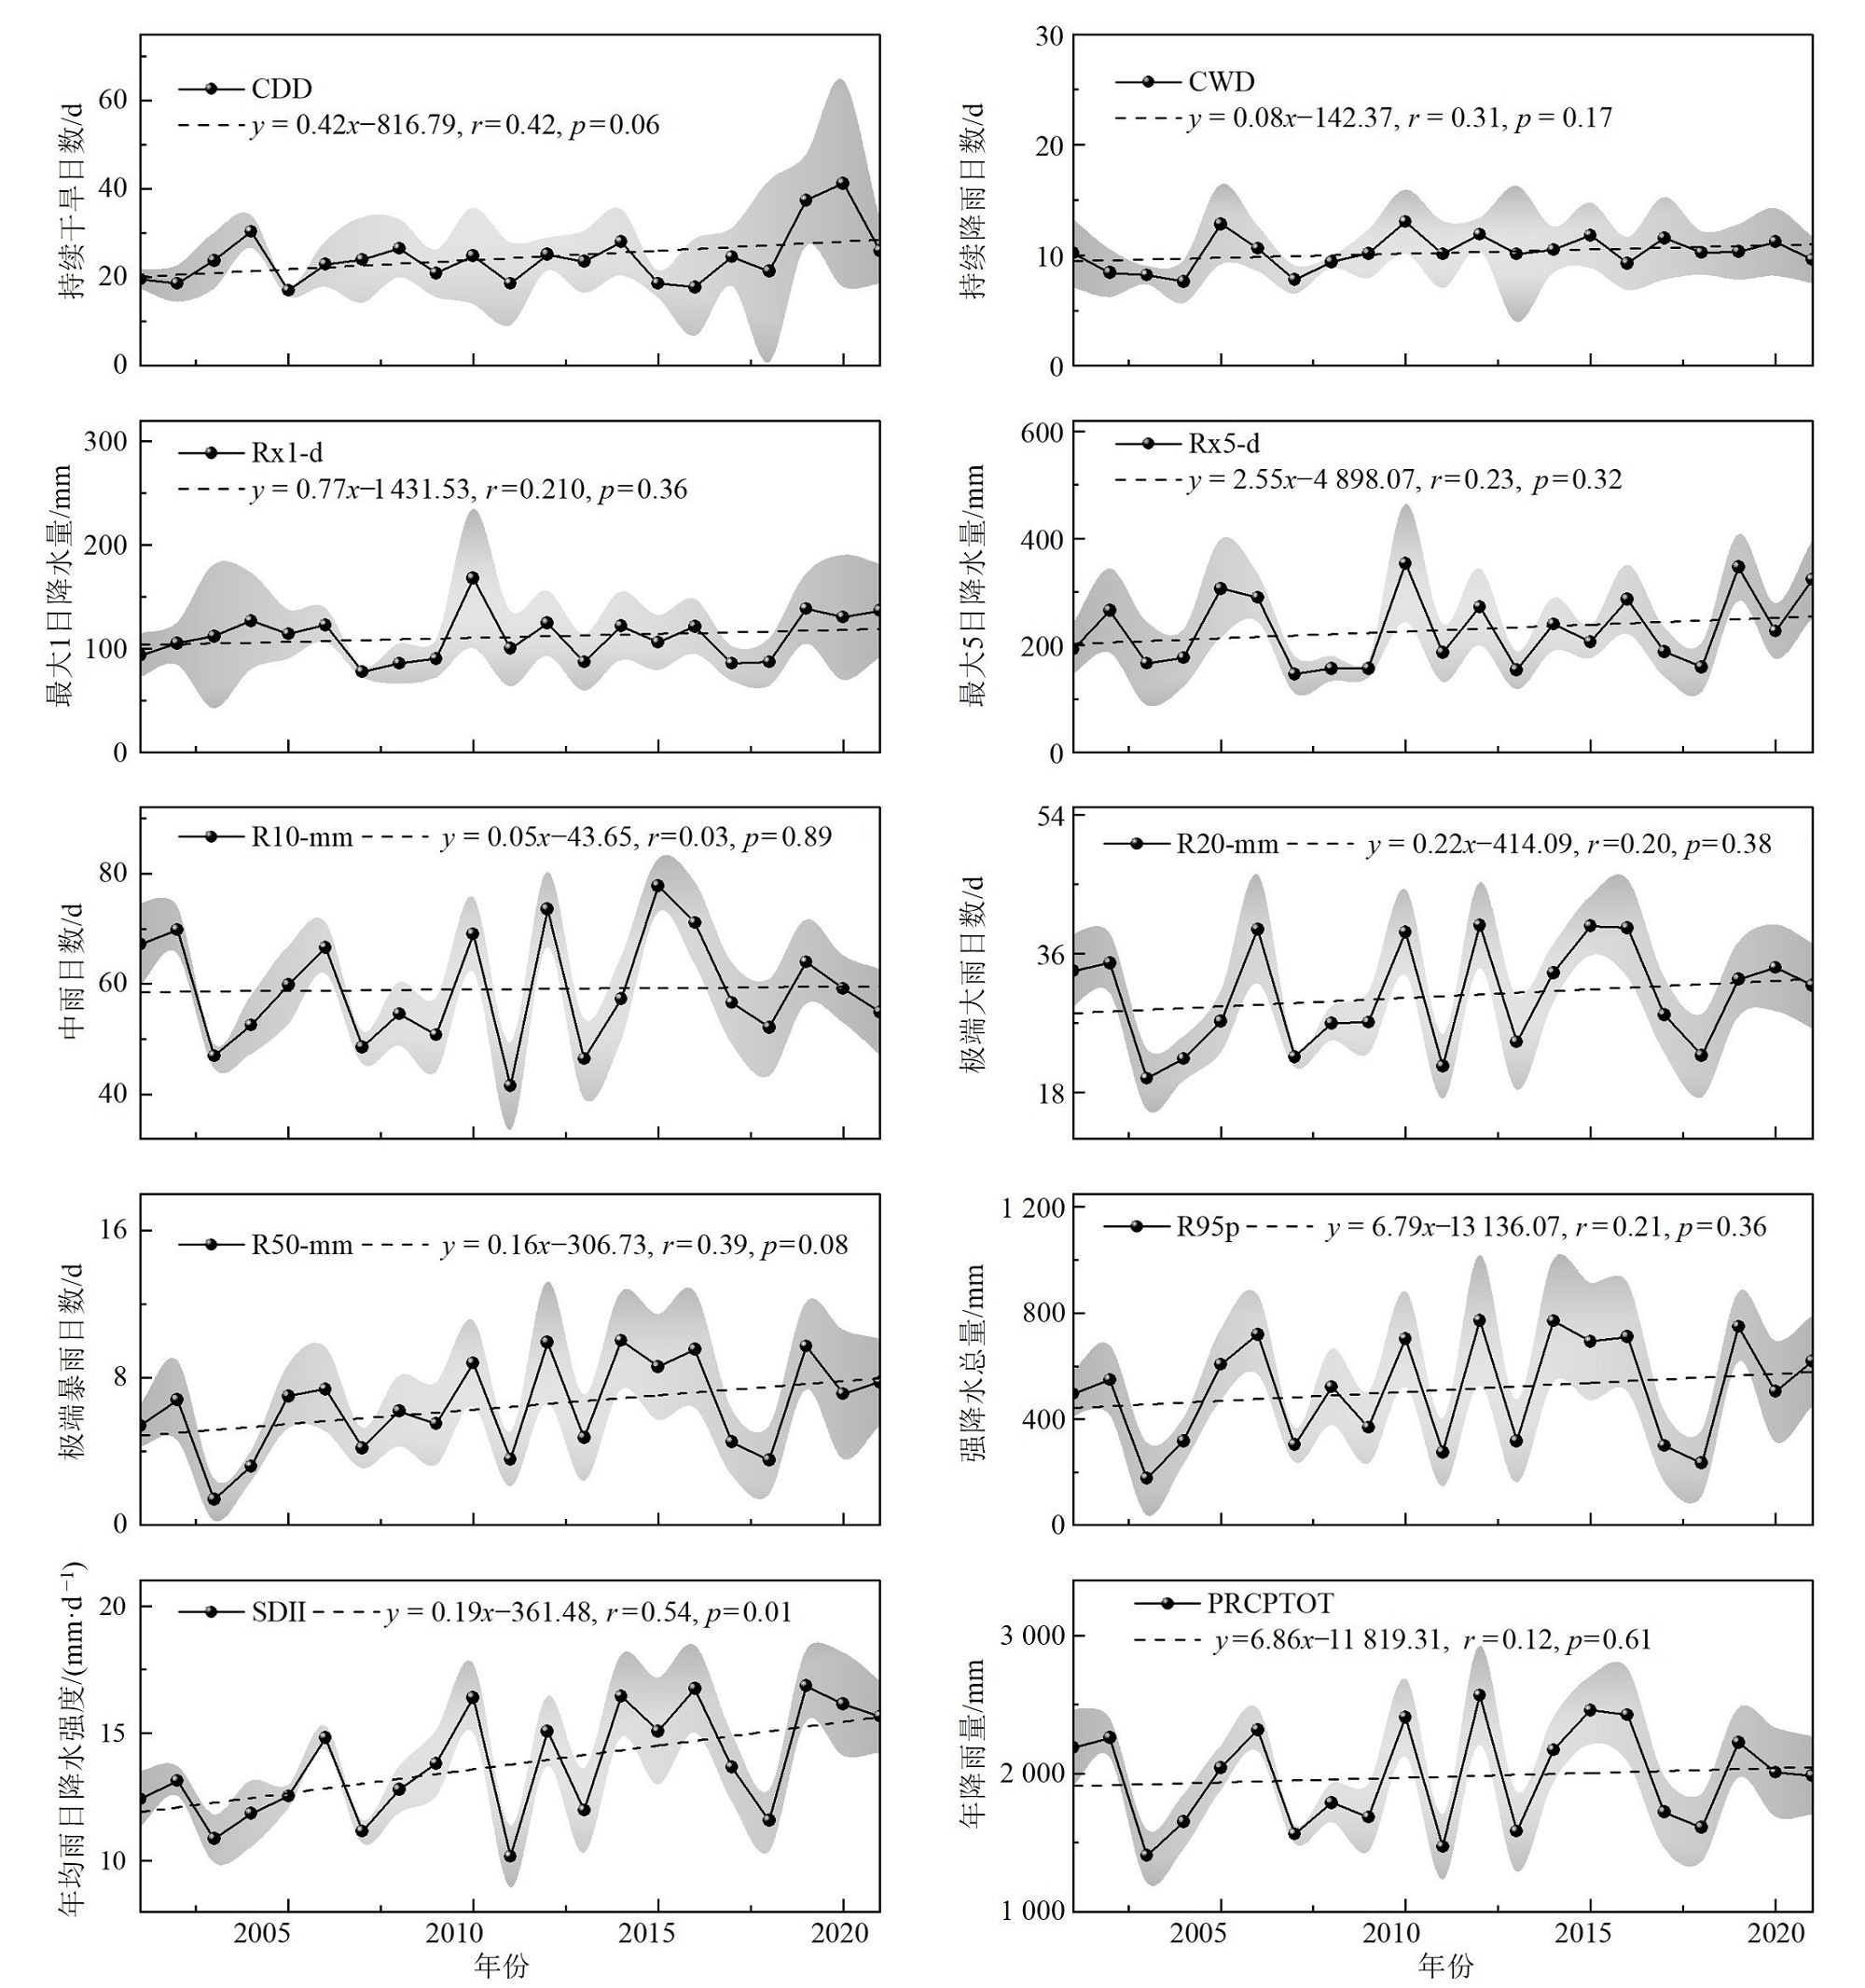
Figure 5 Interannual variation trend of extreme precipitation indices from 2001 to 2021

Figure 6 Spatial distribution of interannual trends of extreme precipitation indices in the studied area from 2001 to 2021
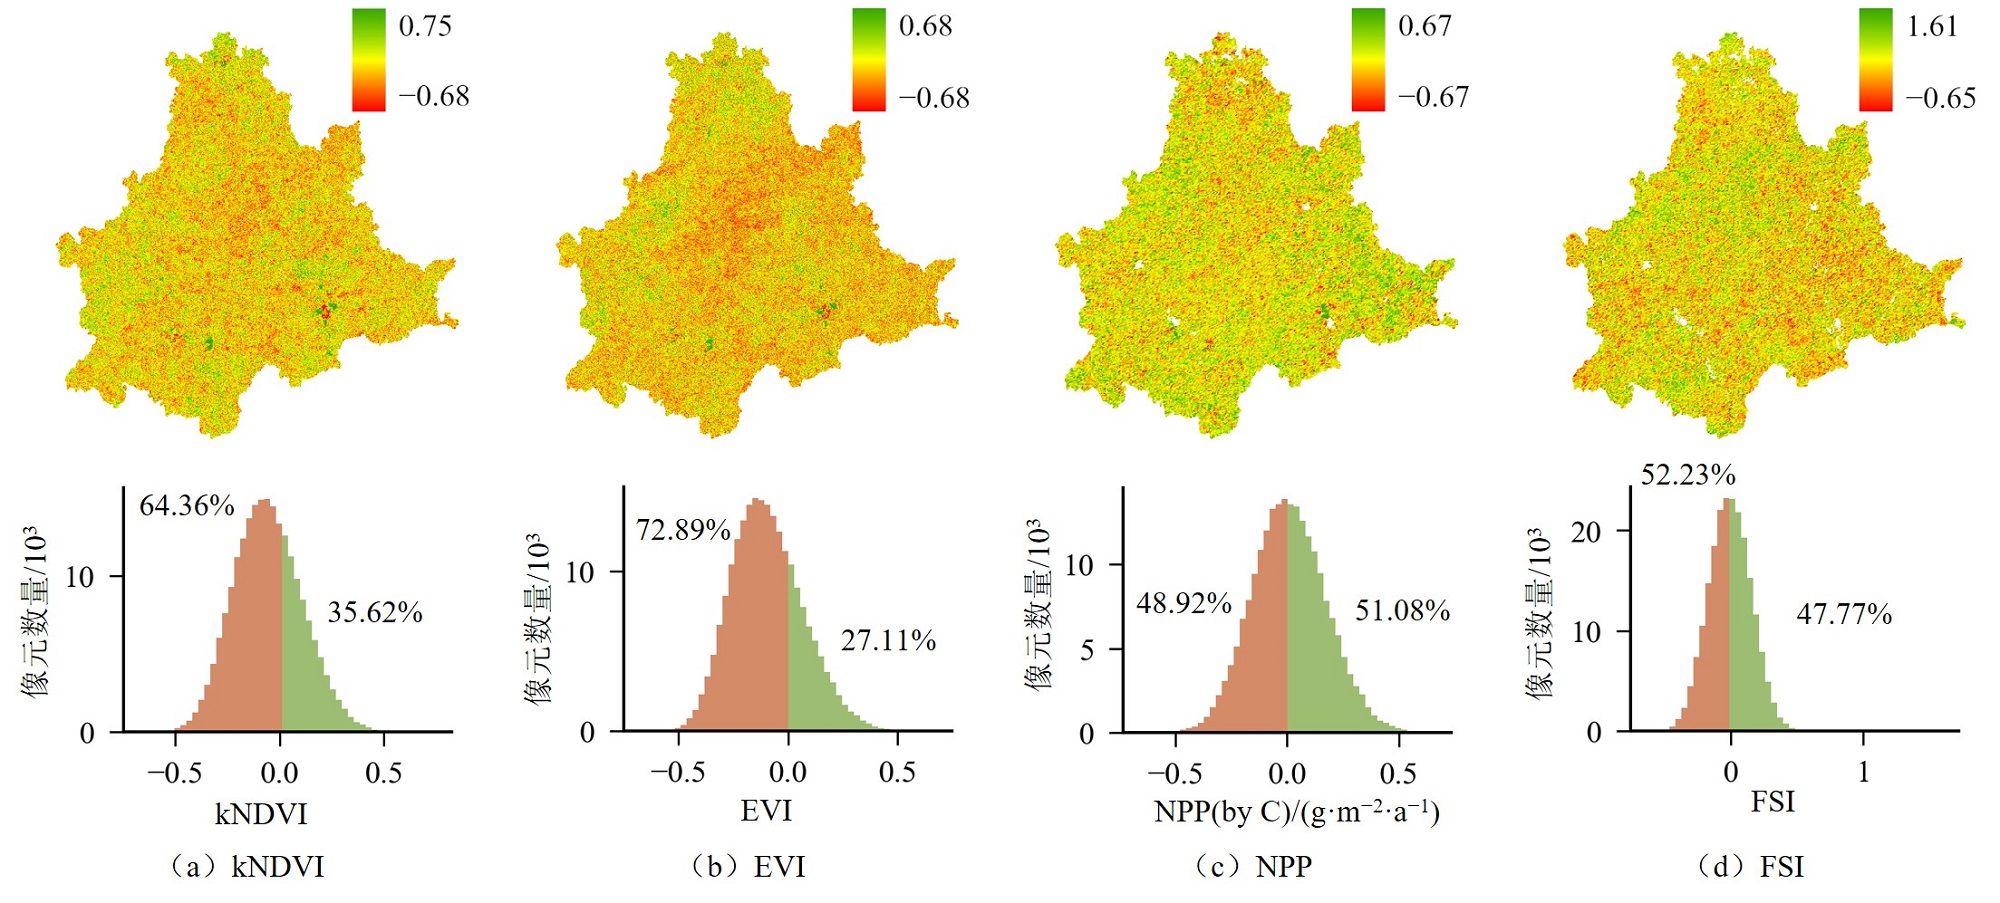
Figure 7 Standardized anomalies of kNDVI, EVI, NPP, and FSI during 2001-2021
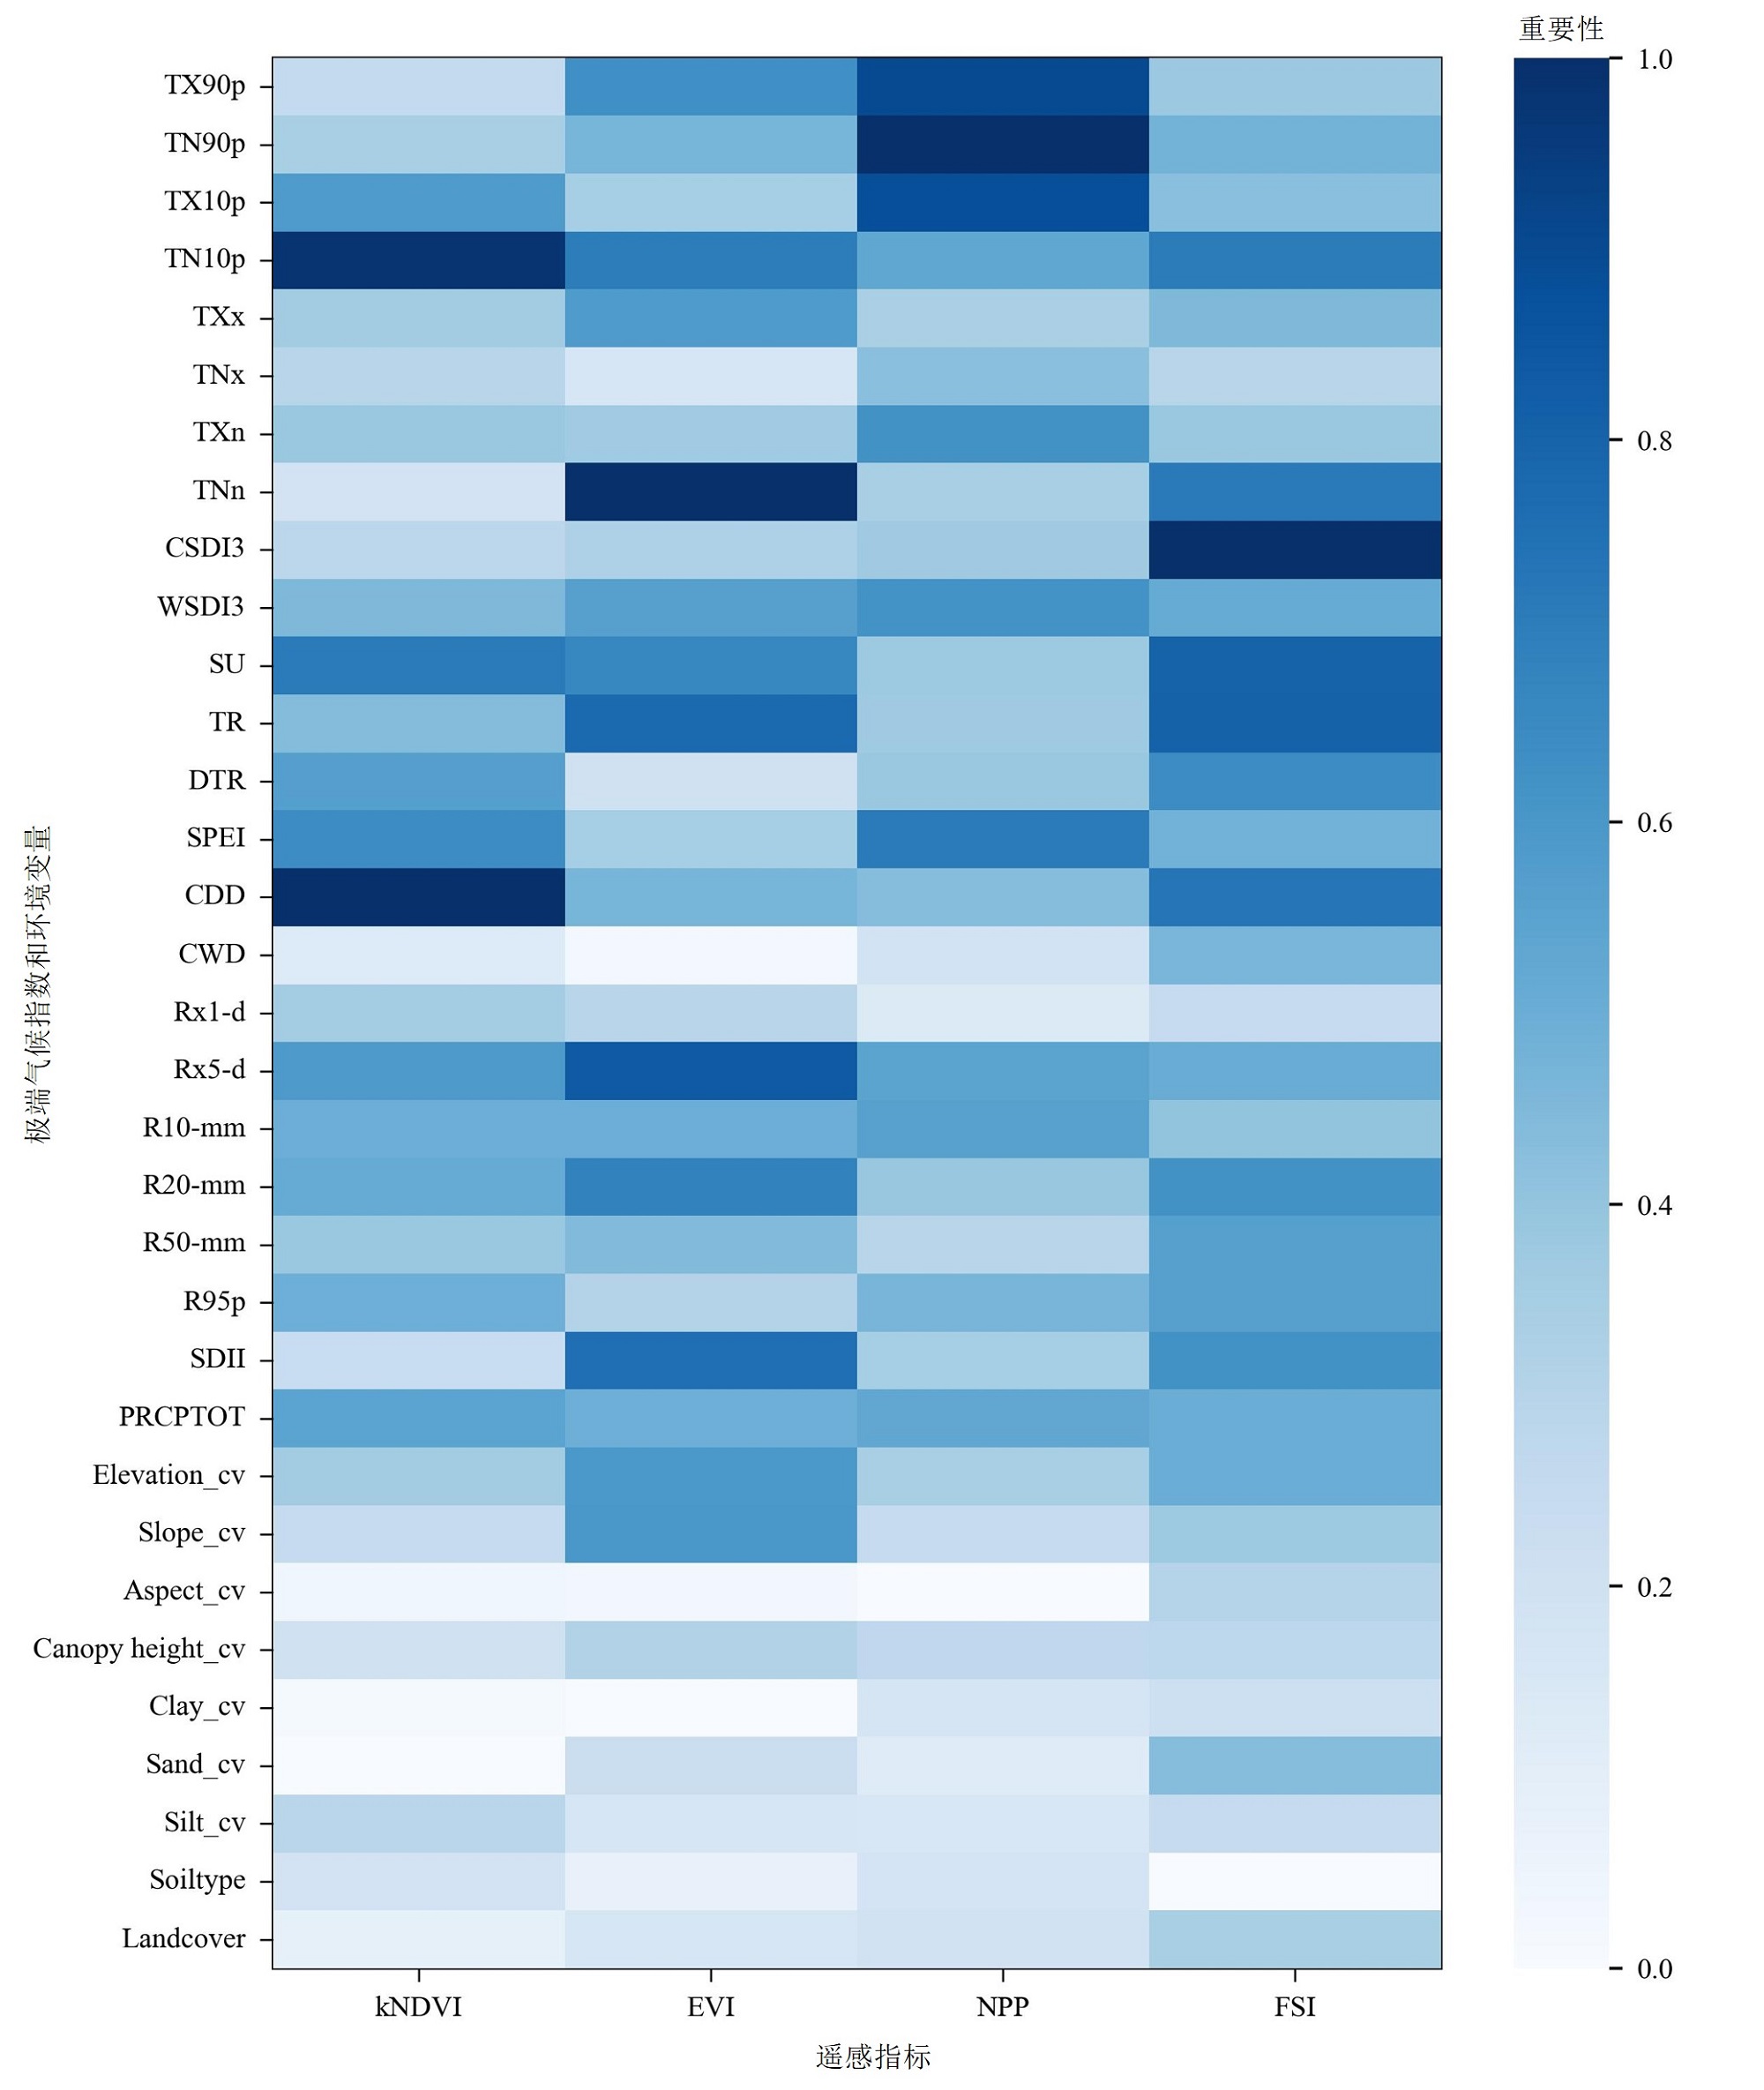
Figure 8 Importance ranking of extreme climate and environmental variables based on the random forest model
| [1] | AFUYE G A, KALUMBA A M, ORIMOLOYE I R, 2021. Characterisation of vegetation response to climate change: A review[J]. Sustainability, 13(13): 7265. |
| [2] |
BARRIOPEDRO D, FISCHER E M, LUTERBACHER J, et al., 2011. The hot summer of 2010: Redrawing the temperature record map of Europe[J]. Science, 332(6026): 220-224.
DOI PMID |
| [3] | BI J, MYNENI R, LYAPUSTIN A, et al., 2016. Amazon forests’ response to droughts: A perspective from the MAIAC product[J]. Remote Sensing, 8(4): 356. |
| [4] | BREIMAN L, 2001. Random forests[J]. Machine Learning, 45: 5-32. |
| [5] | CEDDIA M B, VIEIRA S R, VILLELA A L O, et al., 2009. Topography and spatial variability of soil physical properties[J]. Scientia Agricola, 66(3): 338-352. |
| [6] | CHEN Y, LUO Y, MO W, et al., 2014. Differences between MODIS NDVI and MODIS EVI in response to climatic factors[J]. Journal of Natural Resources, 29(10): 1802-1812. |
| [7] | CHEN Y, WANG Y P, TANG X, et al., 2022. Temperature dependence of ecosystem carbon, nitrogen and phosphorus residence times differs between subtropical and temperate forests in China[J]. Agricultural and Forest Meteorology, 326: 109165. |
| [8] | CHRISTIDIS N, JONES G S, STOTT P A, 2015. Dramatically increasing chance of extremely hot summers since the 2003 European heatwave[J]. Nature Climate Change, 5(1): 46-50. |
| [9] | CHU H, VENEVSKY S, WU C, et al., 2018. NDVI-based vegetation dynamics and its response to climate changes at Amur-Heilongjiang River Basin from 1982 to 2015[J]. Science of the Total Environment, 650(P2): 2051-2062. |
| [10] | CIAIS P, REICHSTEIN M, VIOVY N, et al., 2005. Europe-wide reduction in primary productivity caused by the heat and drought in 2003[J]. Nature, 437(7058): 529-533. |
| [11] | CRAVE A, GASCUEL-ODOUX C, 1997. The influence of topography on time and space distribution of soil surface water content[J]. Hydrological Processes, 11(2): 203-210. |
| [12] | DE KAUWE M G, MEDLYN B E, PITMAN A J, et al., 2019. Examining the evidence for decoupling between photosynthesis and transpiration during heat extremes[J]. Biogeosciences, 16(4): 903-916. |
| [13] | DONAT M G, ALEXANDER L V, YANG H, et al., 2013a. Global land-based datasets for monitoring climatic extremes[J]. Bulletin of the American Meteorological Society, 94(7): 997-1006. |
| [14] | DONAT M G, ALEXANDER L V, YANG H, et al., 2013b. Updated analyses of temperature and precipitation extreme indices since the beginning of the twentieth century: The HadEX2 dataset[J]. Journal of Geophysical Research: Atmospheres, 118(5): 2098-2118. |
| [15] | GAO X, HUETE A R, NI W G, et al., 2000. Optical-biophysical relationships of vegetation spectra without background contamination[J]. Remote Sensing of Environment, 74(3): 609-620. |
| [16] | HAMERLYNCK E P, HUXMAN T E, LOIK M E, et al., 2000. Effects of extreme high temperature, drought and elevated CO2 on photosynthesis of the Mojave Desert evergreen shrub, Larrea tridentata[J]. Plant Ecology, 148: 183-193. |
| [17] | HE J, YANG M M, LIU J, et al., 2025. Impacts of vegetation greening and climate change on trend and interannual variability in vegetation productivity in the Wuyi Mountain region[J]. Geo-Spatial Information Science, 28(1): 224-245. |
| [18] | HUANG S, TANG L, HUPY J P, et al., 2021. A commentary review on the use of normalized difference vegetation index (NDVI) in the era of popular remote sensing[J]. Journal of Forestry Research, 32(1): 1-6. |
| [19] | IPCC, 2021. Climate change 2021: The physical science basis: Working group I contribution to the sixth assessment report of the intergovernmental panel on climate change[M]. Cambridge: Cambridge University Press. |
| [20] |
JUCKER T, HARDWICK S R, BOTH S, et al., 2018. Canopy structure and topography jointly constrain the microclimate of human-modified tropical landscapes[J]. Global Change Biology, 24(11): 5243-5258.
DOI PMID |
| [21] | KATZ R W, BROWN B G, 1992. Extreme events in a changing climate: variability is more important than averages[J]. Climatic Change, 21(3): 289-302. |
| [22] | KIM Y H, MIN S K, ZHANG X B, et al., 2016. Attribution of extreme temperature changes during 1951-2010[J]. Climate Dynamics, 46: 1769-1782. |
| [23] | LAMCHIN M, LEE W, JEON W S, et al., 2018. Long-term trend and correlation between vegetation greenness and climate variables in Asia based on satellite data[J]. Science of the Total Environment, 618: 1089-1095. |
| [24] | LANG N, JETZ W, SCHINDLER K, et al., 2023. A high-resolution canopy height model of the Earth[J]. Nature Ecology & Evolution, 7(11): 1778-1789. |
| [25] | LAVELL A, OPPENHEIMER M, DIOP C, et al., 2012. Managing the risks of extreme events and disasters to advance climate change adaptation[J]. A Special Report of Working Groups I and II of the Intergovernmental Panel on Climate Change (IPCC), 3: 25-64. |
| [26] | LI T Y, WANG S Q, CHEN B, et al., 2024. Widespread reduction in gross primary productivity caused by the compound heat and drought in Yangtze River Basin in 2022[J]. Environmental Research Letters, 19(3): 034048. |
| [27] | MILDREXLER D, YANG Z, COHEN W B, et al., 2016. A forest vulnerability index based on drought and high temperatures[J]. Remote Sensing of Environment, 173: 314-325. |
| [28] | PAPAGIANNOPOULOU C, MIRALLES D G, DECUBBER S, et al., 2017. A non-linear Granger-causality framework to investigate climate-vegetation dynamics[J]. Geoscientific Model Development, 10(5): 1945-1960. |
| [29] | PENG S Z, DING Y X, LIU W Z, LI Z, 2019. 1 km monthly temperature and precipitation dataset for China from 1901 to 2017[J]. Earth System Science Data, 11(4): 1931-1946. |
| [30] | PIAO S L, WANG X H, PARK T J, et al., 2020. Characteristics, drivers and feedbacks of global greening[J]. Nature Reviews Earth & Environment, 1(1): 14-27. |
| [31] | POTTER C S, KLOOSTER S, BROOKS V, 1999. Interannual variability in terrestrial net primary production: exploration of trends and controls on regional to global scales[J]. Ecosystems, 2: 36-48. |
| [32] | REN P X, LIU Z L, ZHOU X L, et al., 2021. Strong controls of daily minimum temperature on the autumn photosynthetic phenology of subtropical vegetation in China[J]. Forest Ecosystems, 8: 1-12. |
| [33] | SELLERS P J, 1985. Canopy reflectance, photosynthesis and transpiration[J]. International Journal of Remote Sensing, 6(8): 1335-1372. |
| [34] | SWENSON S, WAHR J, 2006. Estimating large-scale precipitation minus evapotranspiration from GRACE satellite gravity measurements[J]. Journal of Hydrometeorology, 7(2): 252-270. |
| [35] | WANG Q, MORENO-MARTÍNEZ Á, MUÑOZ-MARÍ J, et al., 2023. Estimation of vegetation traits with kernel NDVI[J]. ISPRS Journal of Photogrammetry and Remote Sensing, 195: 408-417. |
| [36] | XU X, JIANG H L, GUAN M X, et al., 2020. Vegetation responses to extreme climatic indices in coastal China from 1986 to 2015[J]. Science of the Total Environment, 744: 140784. |
| [37] | YUAN M S, ZHU Q, ZHANG J, et al., 2021. Global response of terrestrial gross primary productivity to climate extremes[J]. Science of the Total Environment, 750: 142337. |
| [38] | ZHANG K, KIMBALL J S, MU Q Z, et al., 2009. Satellite based analysis of northern ET trends and associated changes in the regional water balance from 1983 to 2005[J]. Journal of Hydrology, 379(1-2): 92-110. |
| [39] | ZHANG W J, WANG H M, YANG F T, et al., 2011. Underestimated effects of low temperature during early growing season on carbon sequestration of a subtropical coniferous plantation[J]. Biogeosciences, 8(6): 1667-1678. |
| [40] | ZHANG X, LIU L Y, CHEN X D, et al., 2020. GLC_FCS30: Global land-cover product with fine classification system at 30 m using time-series Landsat imagery[J]. Earth System Science Data Discussions, 13(6): 2753-2776. |
| [41] | 陈琦, 毛方杰, 杜华强, 等, 2022. 中国亚热带极端降水时空演变及其对潜在净初级生产力的影响[J]. 生态学杂志, 41(11): 2117-2127. |
|
CHEN Q, MAO F J, DU H Q, et al., 2022. Spatiotemporal variations of subtropical extreme precipitation and its influence on potential net primary productivity in China[J]. Chinese Journal of Ecology, 41(11): 2117-2127.
DOI |
|
| [42] |
陈文裕, 夏丽华, 徐国良, 等, 2022. 2000-2020年珠江流域NDVI动态变化及影响因素研究[J]. 生态环境学报, 31(7): 1306-1316.
DOI |
| CHEN W Y, XIA L H, XU G L, et al., 2022. Dynamic variation of NDVI and its influencing factors in the Pearl River Basin from 2000 to 2020[J]. Ecology and Environmental Sciences, 31(7): 1306-1316. | |
| [43] | 贾朝阳, 2023. 松花江流域NPP时空演变及其极端气候响应研究[D]. 哈尔滨: 东北农业大学. |
| JIA Z Y, 2023. Spatio-temporal evolution of net primary productivity and its response to extreme climate in Songhua River Basin[D]. Harbin: Northeast Agricultural University. | |
| [44] |
焦鹏华, 牛健植, 苗禹博, 等, 2024. 2001-2020 年全球植被对极端气候的响应[J]. 应用生态学报, 35(11): 2992-3004.
DOI |
|
JIAO P H, NIU J Z, MIAO Y B, et al., 2024. Global vegetation response to extreme climate from 2001 to 2020[J]. Chinese Journal of Applied Ecology, 35(11): 2992-3004.
DOI |
|
| [45] | 李韵婕, 2014. 中国西南地区区域性气象干旱事件的特征及成因诊断[D]. 南京: 南京信息工程大学. |
| LI Y J, 2014. Study on the Characteristics and causes of the southwest China regional meteorological drought events[D]. Nanjing: Nanjing University of Information Science & Technology. | |
| [46] | 廖廓, 曾瑾瑜, 王金萍, 等, 2014. 福建春季雷暴天气分析及灾害预测[J]. 闽江学院学报, 35(5): 119-125. |
| LIAO K, ZENG J Y, WANG J P, et al., 2014. Thunderstorm weather analysis and disaster warning in spring in Fujian[J]. Journal of Minjiang University, 35(5): 119-125. | |
| [47] | 马楠, 白涛, 蔡朝朝, 2024. 2000-2021年新疆植被覆盖度变化及驱动力[J]. 水土保持研究, 31(1): 385-394. |
| MA N, BAI T, CAI Z Z, 2024. Vegetation cover change and its response to climate and surface factors in Xinjiang based on different vegetation types[J]. Research of Soil and Water Conservation, 31(1): 385-394. | |
| [48] | 吴欣宇, 朱秀芳, 2023. 中国不同植被区对极端气候的响应差异[J]. 生态学报, 43(24): 10202-10215. |
| WU X Y, ZHU X F, 2023. Differential analysis of vegetation response to extreme climate in different vegetation regions of China[J]. Acta Ecologica Sinica, 43(24): 10202-10215. |
| [1] | DING Xin, LIU Jian, WEI Lihong, XIE Dewei, ZHENG Zhaopei. Spatiotemporal Patterns and Influencing Factors of Vegetation Net Ecosystem Productivity in Shandong Province Based on GSMSR Model [J]. Ecology and Environmental Sciences, 2025, 34(7): 1079-1089. |
| [2] | QI Xun, FENG Xinxin, CHEN Yingjun, FENG Yanli, CHEN Tian, LI Jun, ZHANG Gan. Emission Characteristics and Influence Factors of NH3 and Amines in Particulate Matter Emitted by Light-duty Gasoline Trucks [J]. Ecology and Environmental Sciences, 2025, 34(7): 997-1006. |
| [3] | ZHANG Yali, HUANG Zhujun, TIAN Yichao, LIN Junliang, QIN Caihuan. Time-lag and Accumulation Responses of Fractional Vegetation Coverage Change to Extreme Climate in Southwestern China [J]. Ecology and Environmental Sciences, 2025, 34(5): 665-677. |
| [4] | ZHANG Dandan, WU Zhenhai, WU Ke, BI Fang, LI Yunfeng, AN Cong, HAN Yixin, LIU Zhengyang, ZHU Ling, WANG Xuezhong. Characterization of Ozone Pollution and Influencing Factors Based on Different Types of Ozone Pollution Days: A Case Study in Bozhou City [J]. Ecology and Environmental Sciences, 2025, 34(5): 720-730. |
| [5] | JIANG Cunzheng, CHEN Anqiang, HU Wanli, FU Bin, ZHU Linli, LIU Yune, LI Mingqi, WANG Chi, ZHANG Dan. Spatiotemporal Variations of NO3−-N Concentration in Shallow Groundwater around Yilong Lake and Its Source Analysis [J]. Ecology and Environmental Sciences, 2025, 34(4): 570-580. |
| [6] | ZHAO Lejun, WANG Shiyao, ZHAO Ziyu, HONG Xing, LI Fuxing, WU Jiayi, HUA Jingyu. Spatial and Temporal Variation of AOD in Seven Provinces and Cities of North China Plain from 2008 to 2022 and Its Main Influencing Factors [J]. Ecology and Environmental Sciences, 2025, 34(2): 256-267. |
| [7] | LI Jianfu, HUANG Zhilin, HE Chengzhong, JIANG Xin, SONG Lin, LIU Jiaxin, CHEN Liding. Spatial Distribution and Key Factors Affecting Soil Organic Carbon Within the Karst Fault Basin in Eastern Yunnan, China [J]. Ecology and Environmental Sciences, 2024, 33(9): 1339-1352. |
| [8] | WANG Jiechun, DENG Yujiao, ZHU Huaiwei, KONG Yunqi. Spatiotemporal Variations of Vegetation NPP of Different Ecosystems in Guangdong Province and Its Response to Climate Factors [J]. Ecology and Environmental Sciences, 2024, 33(6): 831-840. |
| [9] | ZHANG Miao, WANG Guixia, WANG Changwei, HE Yanyun, XU Yanfang, LI Qi, XU Yang, ZHANG Junxiao, ZHANG Guiqin. Characteristics and Source Analysis of Black Carbon Pollution Changes in Ji’nan City [J]. Ecology and Environmental Sciences, 2024, 33(4): 560-572. |
| [10] | LI Qing, ZHANG Mengyue, YU Mingqiao, LI Xiaoxuan, CHANG Ming, CHEN Libin, DING Sen. Community Structure and Influencing Factors of Macroinvertebrate in Urban Rivers of Dongguan [J]. Ecology and Environmental Sciences, 2024, 33(1): 101-110. |
| [11] | ZHOU Yuxiang, ZHAO Yu, NIE Rendong, DING Ding, GUO Lihua, ZHOU Jiazheng. Characterization and Prediction of Land Desertification in the Lower Liaohe River Plain [J]. Ecology and Environmental Sciences, 2023, 32(6): 1133-1139. |
| [12] | WANG Chengwu, LUO Junjie, TANG Honghu. Analysis on the Driving Force of Spatial and Temporal Differentiation of Carbon Storage in the Taihang Mountains Based on InVEST Model [J]. Ecology and Environmental Sciences, 2023, 32(2): 215-225. |
| [13] | ZHENG Xiaohao, CHEN Yingbiao, ZHENG Zihao, GUO Cheng, HUANG Zhounan, ZHOU Yongshi. Dynamic Changes of Ecosystem Service Value and Evolution of Its Influencing Factors in Hubei Province [J]. Ecology and Environmental Sciences, 2023, 32(1): 195-206. |
| [14] | HAO Yongpei, SONG Xiaowei, ZHAO Wenjun, XIANG Famin. Spatiotemporal Distribution of Air Pollution and Correlation Factors in Fenwei Plain [J]. Ecology and Environmental Sciences, 2022, 31(3): 512-523. |
| [15] | CAO Yun, SUN Yinglong, JIANG Yueqing, WAN Jun. Analysis on Temporal-spatial Variations and Driving Factors of Net Ecosystem Productivity in the Yellow River Basin [J]. Ecology and Environmental Sciences, 2022, 31(11): 2101-2110. |
| Viewed | ||||||
|
Full text |
|
|||||
|
Abstract |
|
|||||
Copyright © 2021 Editorial Office of ACTA PETROLEI SINICA
Address:No. 6 Liupukang Street, Xicheng District, Beijing, P.R.China, 510650
Tel: 86-010-62067128, 86-010-62067137, 86-010-62067139
Fax: 86-10-62067130
Email: syxb@cnpc.com.cn
Support byBeijing Magtech Co.ltd, E-mail:support@magtech.com.cn