Ecology and Environment ›› 2021, Vol. 30 ›› Issue (7): 1470-1481.DOI: 10.16258/j.cnki.1674-5906.2021.07.016
• Research Articles • Previous Articles Next Articles
HU Lin1,2( ), LI Siyue2,3,*()
Received:2021-01-25
Online:2021-07-18
Published:2021-10-09
Contact:
LI Siyue
胡琳1,2(), 李思悦2,3,*()
通讯作者:
李思悦
作者简介:胡琳(1997年生),男,硕士研究生,主要研究方向为河流水环境与土地利用。E-mail: 634944710@qq.com
基金资助:CLC Number:
HU Lin, LI Siyue. Scale Effects of Land Use Structure and Landscape Pattern on Water Quality in the Longchuan River Basin[J]. Ecology and Environment, 2021, 30(7): 1470-1481.
胡琳, 李思悦. 不同空间尺度土地利用结构与景观格局对龙川江流域水质的影响[J]. 生态环境学报, 2021, 30(7): 1470-1481.
Add to citation manager EndNote|Ris|BibTeX
URL: https://www.jeesci.com/EN/10.16258/j.cnki.1674-5906.2021.07.016
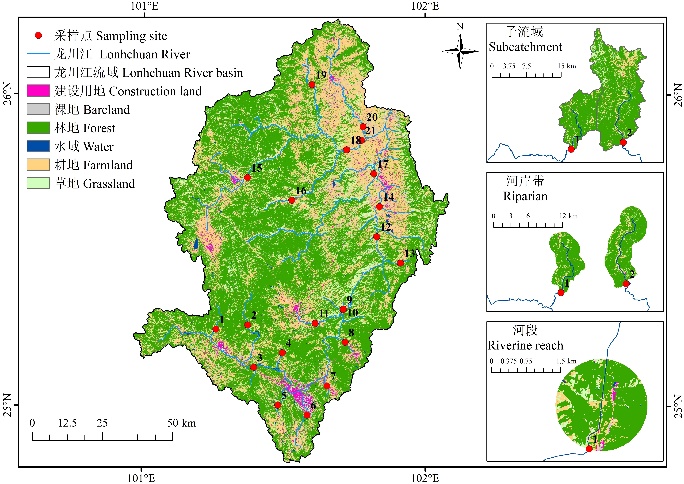
Fig. 1 Study area with land use map and sampling sites Rainfall from Jan. to Dec. in 2017 is 43.6, 3.1, 13.1, 51.4, 12.4, 84.6, 128.5, 78.9, 20.7, 13.8, 2.2, 0 mm, respectively
| 名称 Name | 景观面积 Total landscape area (TA) | 最大斑块指数 Largest patch index (LPI) | 斑块数量 Number of patches (NP) | 斑块密度 Patch density (PD) | 边缘密度 Edge density (ED) | 景观形状指数 Landscape shape index (LSI) |
|---|---|---|---|---|---|---|
| 类型 Type | 面积指标 Area indicator | 面积指标 Area indicator | 密度大小与差异指标 Density size and difference index | 密度大小与差异指标 Density size and difference index | 边缘指标 Edge index | 形状指标 Shape index |
| 名称 Name | 平均形状指数 Mean shape index (SHAPE_MN) | 平均欧式临近距离 Mean euclidean nearest neighbor distance (ENN_MN) | 香农多样性指数 Shannon’s diversity index (SHDI) | 聚合度 Aggregation index (AI) | 整体性 Patch cohesion index (COHESION) | 蔓延度 Contagion (CONTAG) |
| 类型 Type | 形状指标 Shape index | 邻近度指标 Proximity index | 多样性指标 Diversity index | 聚散性指标Convergence and dispersion index | 聚散性指标 Convergence and dispersion index | 聚散性指标 Convergence and dispersion index |
Table 1 Description of landscape indices
| 名称 Name | 景观面积 Total landscape area (TA) | 最大斑块指数 Largest patch index (LPI) | 斑块数量 Number of patches (NP) | 斑块密度 Patch density (PD) | 边缘密度 Edge density (ED) | 景观形状指数 Landscape shape index (LSI) |
|---|---|---|---|---|---|---|
| 类型 Type | 面积指标 Area indicator | 面积指标 Area indicator | 密度大小与差异指标 Density size and difference index | 密度大小与差异指标 Density size and difference index | 边缘指标 Edge index | 形状指标 Shape index |
| 名称 Name | 平均形状指数 Mean shape index (SHAPE_MN) | 平均欧式临近距离 Mean euclidean nearest neighbor distance (ENN_MN) | 香农多样性指数 Shannon’s diversity index (SHDI) | 聚合度 Aggregation index (AI) | 整体性 Patch cohesion index (COHESION) | 蔓延度 Contagion (CONTAG) |
| 类型 Type | 形状指标 Shape index | 邻近度指标 Proximity index | 多样性指标 Diversity index | 聚散性指标Convergence and dispersion index | 聚散性指标 Convergence and dispersion index | 聚散性指标 Convergence and dispersion index |
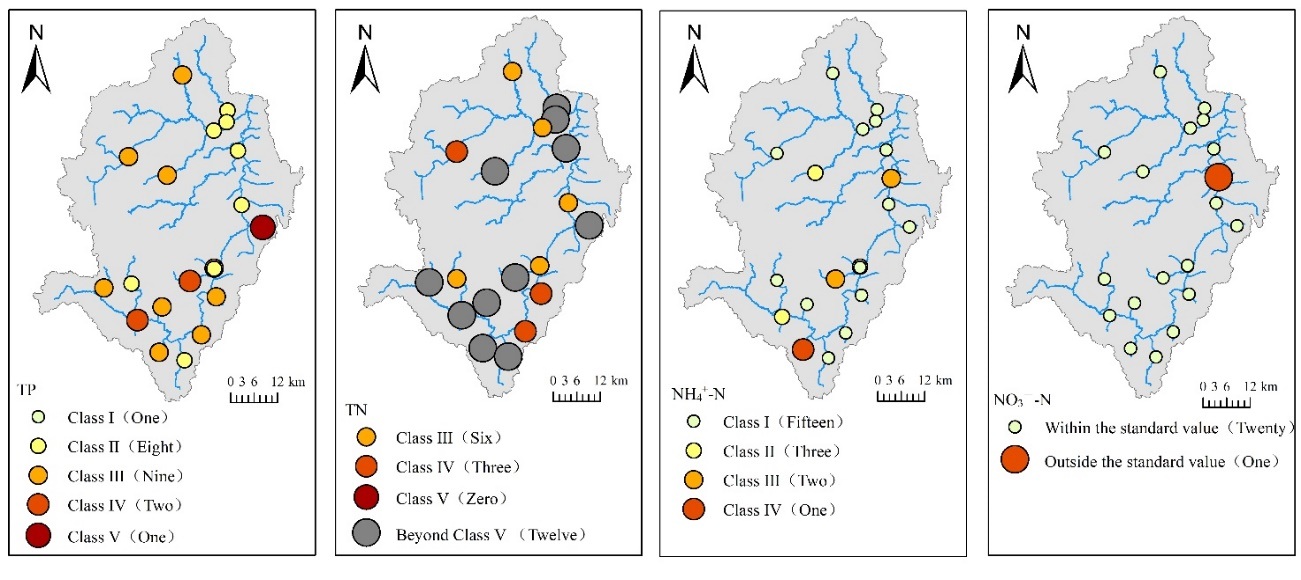
Fig. 2 Spatial distribution of water quality nutritional indicators in May Number of sampling sites in bracket corresponding to water quality standard. The same below
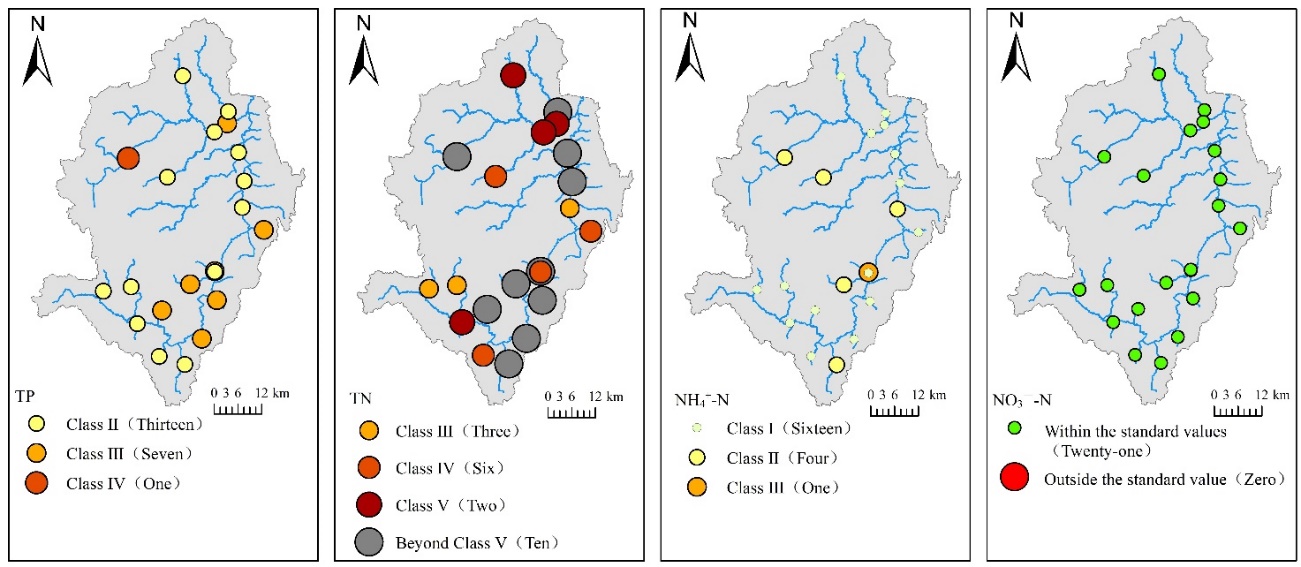
Fig. 3 Spatial distribution of water quality nutritional indicators in September
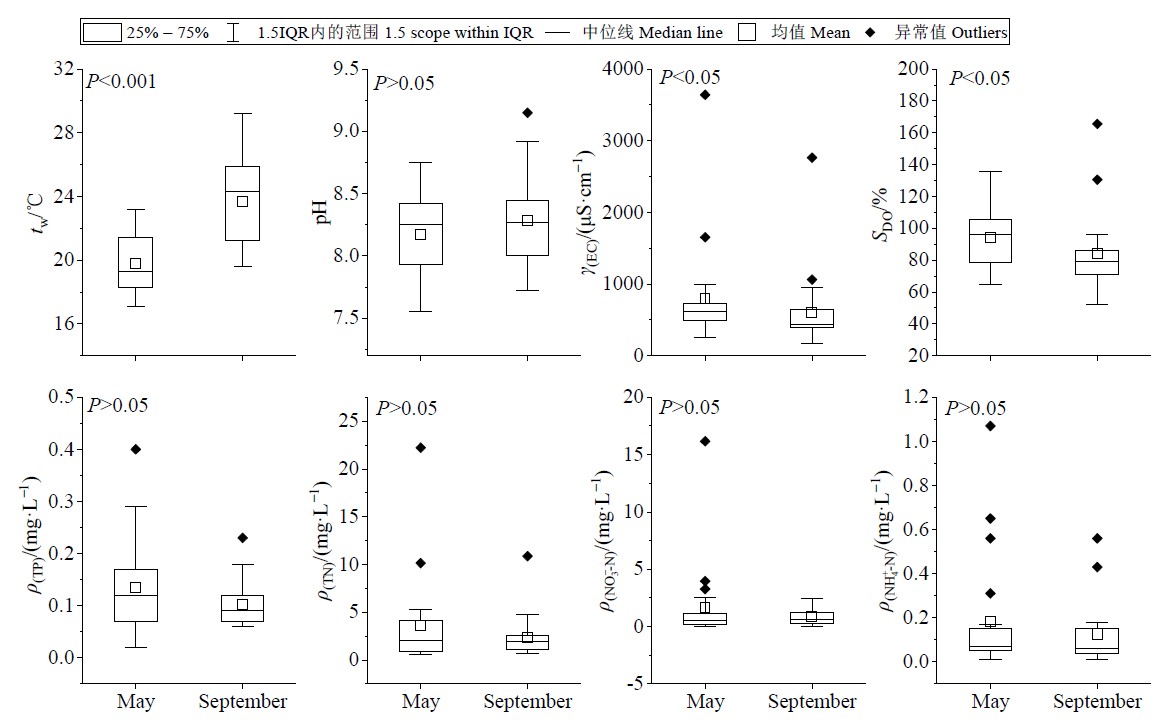
Fig. 4 Temporal variation of water quality parameters in of the Longchuan River
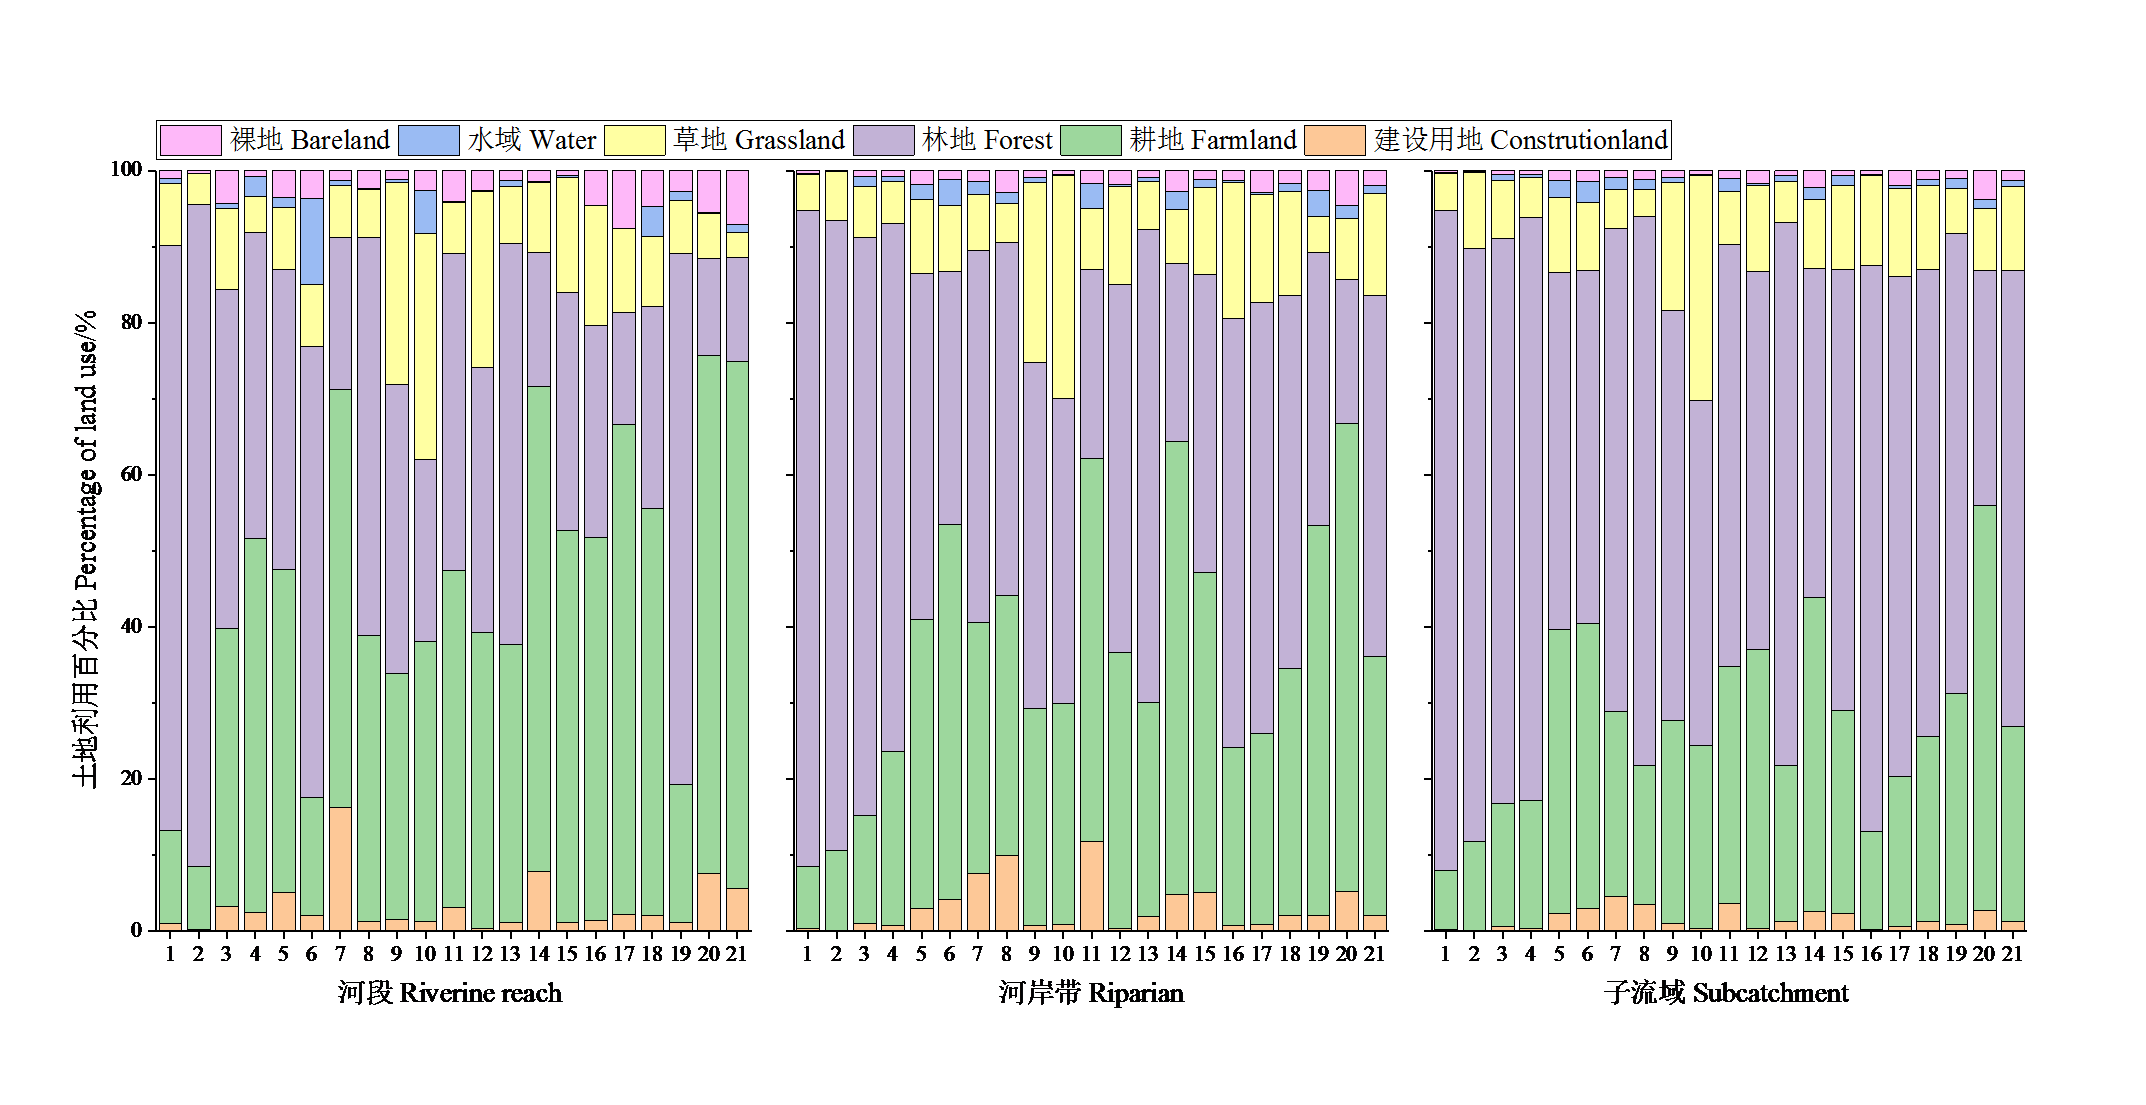
Fig. 5 Land use composition at different spatial scales (riverine reach, riparian and subcatchment)
| 河段 Riverine reach | 耕地 Farmland | 林地 Forest | 草地 Grassland | 水域 Water | 建设用地 Construction land | 裸地 Unused | |||||||||||
|---|---|---|---|---|---|---|---|---|---|---|---|---|---|---|---|---|---|
| 5月 | 9月 | 5月 | 9月 | 5月 | 9月 | 5月 | 9月 | 5月 | 9月 | 5月 | 9月 | ||||||
| tw | 0.125 | 0.319 | -0.061 | -0.343 | -0.495* | 0.172 | 0.339 | -0.012 | 0.266 | -0.177 | 0.353 | 0.424 | |||||
| pH | 0.291 | -0.030 | -0.27 | 0.087 | 0.251 | 0.024 | -0.242 | -0.206 | -0.218 | -0.201 | 0.040 | -0.080 | |||||
| γ(EC) | 0.140 | 0.101 | -0.335 | -0.301 | 0.554** | 0.610** | 0.285 | 0.261 | -0.034 | -0.093 | -0.073 | -0.140 | |||||
| SDO | 0.236 | -0.240 | -0.123 | 0.308 | 0.047 | -0.198 | -0.267 | -0.180 | -0.258 | -0.077 | -0.144 | 0.021 | |||||
| TP | -0.165 | 0.214 | 0.196 | -0.245 | -0.062 | 0.160 | -0.107 | 0.115 | -0.018 | 0.017 | -0.154 | -0.121 | |||||
| TN | 0.401 | 0.445* | -0.316 | -0.413 | -0.173 | -0.150 | -0.201 | -0.026 | 0.272 | 0.571** | 0.121 | -0.105 | |||||
| NO3--N | 0.403 | -0.058 | -0.325 | 0.125 | -0.163 | -0.025 | -0.158 | -0.091 | 0.339 | -0.023 | -0.016 | -0.496* | |||||
| NH4+-N | 0.143 | -0.187 | -0.121 | -0.071 | -0.095 | 0.490* | -0.070 | 0.683** | 0.196 | -0.096 | 0.069 | -0.107 | |||||
Table 2 The correlation between water quality and land use in different period of river reach
| 河段 Riverine reach | 耕地 Farmland | 林地 Forest | 草地 Grassland | 水域 Water | 建设用地 Construction land | 裸地 Unused | |||||||||||
|---|---|---|---|---|---|---|---|---|---|---|---|---|---|---|---|---|---|
| 5月 | 9月 | 5月 | 9月 | 5月 | 9月 | 5月 | 9月 | 5月 | 9月 | 5月 | 9月 | ||||||
| tw | 0.125 | 0.319 | -0.061 | -0.343 | -0.495* | 0.172 | 0.339 | -0.012 | 0.266 | -0.177 | 0.353 | 0.424 | |||||
| pH | 0.291 | -0.030 | -0.27 | 0.087 | 0.251 | 0.024 | -0.242 | -0.206 | -0.218 | -0.201 | 0.040 | -0.080 | |||||
| γ(EC) | 0.140 | 0.101 | -0.335 | -0.301 | 0.554** | 0.610** | 0.285 | 0.261 | -0.034 | -0.093 | -0.073 | -0.140 | |||||
| SDO | 0.236 | -0.240 | -0.123 | 0.308 | 0.047 | -0.198 | -0.267 | -0.180 | -0.258 | -0.077 | -0.144 | 0.021 | |||||
| TP | -0.165 | 0.214 | 0.196 | -0.245 | -0.062 | 0.160 | -0.107 | 0.115 | -0.018 | 0.017 | -0.154 | -0.121 | |||||
| TN | 0.401 | 0.445* | -0.316 | -0.413 | -0.173 | -0.150 | -0.201 | -0.026 | 0.272 | 0.571** | 0.121 | -0.105 | |||||
| NO3--N | 0.403 | -0.058 | -0.325 | 0.125 | -0.163 | -0.025 | -0.158 | -0.091 | 0.339 | -0.023 | -0.016 | -0.496* | |||||
| NH4+-N | 0.143 | -0.187 | -0.121 | -0.071 | -0.095 | 0.490* | -0.070 | 0.683** | 0.196 | -0.096 | 0.069 | -0.107 | |||||
| 河岸带 Riparian | 耕地 Farmland | 林地 Forest | 草地 Grassland | 水域 Water | 建设用地 Construction land | 裸地 Unused | |||||||||||
|---|---|---|---|---|---|---|---|---|---|---|---|---|---|---|---|---|---|
| 5月 | 9月 | 5月 | 9月 | 5月 | 9月 | 5月 | 9月 | 5月 | 9月 | 5月 | 9月 | ||||||
| tw | 0.358 | 0.437* | -0.251 | -0.457* | -0.311 | 0.262 | 0.416 | 0.006 | 0.169 | -0.075 | 0.301 | 0.481* | |||||
| pH | 0.321 | 0.009 | -0.334 | -0.016 | 0.298 | 0.128 | -0.184 | -0.239 | -0.189 | -0.153 | 0.280 | 0.103 | |||||
| γ(EC) | 0.077 | 0.047 | -0.256 | -0.202 | 0.631** | 0.581** | -0.184 | -0.248 | -0.039 | -0.076 | -0.152 | -0.181 | |||||
| SDO | -0.129 | -0.456* | 0.177 | 0.571** | 0.018 | -0.337 | -0.321 | -0.272 | -0.302 | -0.360 | -0.119 | -0.113 | |||||
| TP | -0.194 | 0.048 | 0.188 | -0.176 | -0.166 | 0.275 | 0.056 | -0.082 | 0.231 | 0.327 | -0.313 | -0.204 | |||||
| TN | 0.319 | 0.505* | -0.236 | -0.456* | -0.203 | -0.167 | 0.190 | 0.366 | 0.105 | 0.381 | 0.362 | 0.338 | |||||
| NO3--N | 0.551** | 0.012 | -0.468* | 0.003 | -0.171 | -0.131 | 0.334 | 0.071 | 0.245 | 0.194 | 0.397 | -0.088 | |||||
| NH4+-N | 0.295 | 0.165 | -0.304 | -0.306 | -0.044 | 0.465* | 0.384 | 0.108 | 0.309 | 0.111 | 0.086 | -0.266 | |||||
Table 3 The correlation between water quality and land use in different periods of riparian zone
| 河岸带 Riparian | 耕地 Farmland | 林地 Forest | 草地 Grassland | 水域 Water | 建设用地 Construction land | 裸地 Unused | |||||||||||
|---|---|---|---|---|---|---|---|---|---|---|---|---|---|---|---|---|---|
| 5月 | 9月 | 5月 | 9月 | 5月 | 9月 | 5月 | 9月 | 5月 | 9月 | 5月 | 9月 | ||||||
| tw | 0.358 | 0.437* | -0.251 | -0.457* | -0.311 | 0.262 | 0.416 | 0.006 | 0.169 | -0.075 | 0.301 | 0.481* | |||||
| pH | 0.321 | 0.009 | -0.334 | -0.016 | 0.298 | 0.128 | -0.184 | -0.239 | -0.189 | -0.153 | 0.280 | 0.103 | |||||
| γ(EC) | 0.077 | 0.047 | -0.256 | -0.202 | 0.631** | 0.581** | -0.184 | -0.248 | -0.039 | -0.076 | -0.152 | -0.181 | |||||
| SDO | -0.129 | -0.456* | 0.177 | 0.571** | 0.018 | -0.337 | -0.321 | -0.272 | -0.302 | -0.360 | -0.119 | -0.113 | |||||
| TP | -0.194 | 0.048 | 0.188 | -0.176 | -0.166 | 0.275 | 0.056 | -0.082 | 0.231 | 0.327 | -0.313 | -0.204 | |||||
| TN | 0.319 | 0.505* | -0.236 | -0.456* | -0.203 | -0.167 | 0.190 | 0.366 | 0.105 | 0.381 | 0.362 | 0.338 | |||||
| NO3--N | 0.551** | 0.012 | -0.468* | 0.003 | -0.171 | -0.131 | 0.334 | 0.071 | 0.245 | 0.194 | 0.397 | -0.088 | |||||
| NH4+-N | 0.295 | 0.165 | -0.304 | -0.306 | -0.044 | 0.465* | 0.384 | 0.108 | 0.309 | 0.111 | 0.086 | -0.266 | |||||
| 子流域 Subcatchment | 耕地 Farmland | 林地 Forest | 草地 Grassland | 水域 Water | 建设用地 Construction land | 裸地 Unused | |||||||||||
|---|---|---|---|---|---|---|---|---|---|---|---|---|---|---|---|---|---|
| 5月 | 9月 | 5月 | 9月 | 5月 | 9月 | 5月 | 9月 | 5月 | 9月 | 5月 | 9月 | ||||||
| tw | 0.393 | 0.408 | -0.287 | -0.463* | -0.240 | 0.335 | 0.432 | -0.133 | 0.261 | -0.133 | 0.422 | 0.520* | |||||
| pH | 0.366 | -0.011 | -0.395 | -0.051 | 0.287 | 0.190 | -0.185 | -0.186 | -0.170 | -0.117 | 0.339 | 0.111 | |||||
| γ(EC) | 0.052 | 0.068 | -0.326 | -0.314 | 0.775** | 0.740** | -0.148 | -0.231 | -0.075 | -0.140 | -0.078 | -0.085 | |||||
| SDO | -0.082 | -0.298 | 0.118 | 0.399 | -0.012 | -0.278 | -0.264 | -0.324 | -0.323 | -0.362 | -0.072 | -0.051 | |||||
| TP | -0.303 | -0.121 | 0.33 | -0.045 | -0.204 | 0.324 | 0.030 | 0.057 | 0.117 | 0.258 | -0.402 | -0.270 | |||||
| TN | 0.273 | 0.387 | -0.211 | -0.358 | -0.127 | -0.088 | 0.169 | 0.387 | 0.129 | 0.471* | 0.433 | 0.392 | |||||
| NO3--N | 0.472* | -0.128 | -0.407 | 0.165 | -0.087 | -0.163 | 0.302 | -0.032 | 0.279 | 0.106 | 0.474* | -0.145 | |||||
| NH4+-N | 0.317 | 0.146 | -0.313 | -0.364 | 0.004 | 0.591** | 0.512* | 0.185 | 0.317 | 0.128 | 0.073 | -0.105 | |||||
Table 4 The correlation between water quality and land use and land cover in different periods of sub-watershed
| 子流域 Subcatchment | 耕地 Farmland | 林地 Forest | 草地 Grassland | 水域 Water | 建设用地 Construction land | 裸地 Unused | |||||||||||
|---|---|---|---|---|---|---|---|---|---|---|---|---|---|---|---|---|---|
| 5月 | 9月 | 5月 | 9月 | 5月 | 9月 | 5月 | 9月 | 5月 | 9月 | 5月 | 9月 | ||||||
| tw | 0.393 | 0.408 | -0.287 | -0.463* | -0.240 | 0.335 | 0.432 | -0.133 | 0.261 | -0.133 | 0.422 | 0.520* | |||||
| pH | 0.366 | -0.011 | -0.395 | -0.051 | 0.287 | 0.190 | -0.185 | -0.186 | -0.170 | -0.117 | 0.339 | 0.111 | |||||
| γ(EC) | 0.052 | 0.068 | -0.326 | -0.314 | 0.775** | 0.740** | -0.148 | -0.231 | -0.075 | -0.140 | -0.078 | -0.085 | |||||
| SDO | -0.082 | -0.298 | 0.118 | 0.399 | -0.012 | -0.278 | -0.264 | -0.324 | -0.323 | -0.362 | -0.072 | -0.051 | |||||
| TP | -0.303 | -0.121 | 0.33 | -0.045 | -0.204 | 0.324 | 0.030 | 0.057 | 0.117 | 0.258 | -0.402 | -0.270 | |||||
| TN | 0.273 | 0.387 | -0.211 | -0.358 | -0.127 | -0.088 | 0.169 | 0.387 | 0.129 | 0.471* | 0.433 | 0.392 | |||||
| NO3--N | 0.472* | -0.128 | -0.407 | 0.165 | -0.087 | -0.163 | 0.302 | -0.032 | 0.279 | 0.106 | 0.474* | -0.145 | |||||
| NH4+-N | 0.317 | 0.146 | -0.313 | -0.364 | 0.004 | 0.591** | 0.512* | 0.185 | 0.317 | 0.128 | 0.073 | -0.105 | |||||
| 参数 Parameter | 河段 Riverine reach | R2 | 河岸带 Riparian | R2 | 子流域 Subcatchment | R2 | |
|---|---|---|---|---|---|---|---|
| 5月 | TP | * | * | * | |||
| TN | * | * | * | ||||
| NO3--N | * | 13.08耕地-2.78 13.08 Farmland -2.78 | 0.300 | 15耕地-2.222 15 Farmland -2.222 | 0.230 | ||
| NH4+-N | * | * | * | ||||
| 9月 | TP | * | * | * | |||
| TN | 27.65建设用地+2.54耕地+0.32 27.65 Construction land+2.54 Farmland+0.32 | 0.360 | 7.52耕地-0.262 7.52 Farmland -0.262 | 0.260 | 77.44建设用地+1.04 77.44 Construction land +1.04 | 0.220 | |
| NO3--N | 1.381—17.183裸地 1.381‒17.183 Unused | 0.250 | * | * | |||
| NH4+-N | 3.22水域+0.79草地-0.01 3.22 Water +0.79 Grassland -0.01 | 0.650 | 0.98草地+0.02 0.98 Grassland +0.02 | 0.220 | 1.45草地-0.02 1.45 Grassland -0.02 | 0.350 |
Table 5 Regression models between land use and water quality
| 参数 Parameter | 河段 Riverine reach | R2 | 河岸带 Riparian | R2 | 子流域 Subcatchment | R2 | |
|---|---|---|---|---|---|---|---|
| 5月 | TP | * | * | * | |||
| TN | * | * | * | ||||
| NO3--N | * | 13.08耕地-2.78 13.08 Farmland -2.78 | 0.300 | 15耕地-2.222 15 Farmland -2.222 | 0.230 | ||
| NH4+-N | * | * | * | ||||
| 9月 | TP | * | * | * | |||
| TN | 27.65建设用地+2.54耕地+0.32 27.65 Construction land+2.54 Farmland+0.32 | 0.360 | 7.52耕地-0.262 7.52 Farmland -0.262 | 0.260 | 77.44建设用地+1.04 77.44 Construction land +1.04 | 0.220 | |
| NO3--N | 1.381—17.183裸地 1.381‒17.183 Unused | 0.250 | * | * | |||
| NH4+-N | 3.22水域+0.79草地-0.01 3.22 Water +0.79 Grassland -0.01 | 0.650 | 0.98草地+0.02 0.98 Grassland +0.02 | 0.220 | 1.45草地-0.02 1.45 Grassland -0.02 | 0.350 |
| 月份 Month | TA | LPI | NP | PD | ED | LSI | SHAPE_MN | ENN_MN | SHDI | AI | COHESION | CONTAG | 总计 Total | |
|---|---|---|---|---|---|---|---|---|---|---|---|---|---|---|
| 河段 Riverine reach | 5月 May | 0.4 | 9.6 | 8.4 | 0.0 | 0.0 | <0.1 | 17.6** | 1.2 | 0.1 | 9.3 | 19.8* | 0.3 | 66.7 |
| 9月 September | 0.2 | 6 | 13.1* | 0.0 | 0.0 | <0.1 | 9.1 | 1.7 | <0.1 | 6.0 | 25* | <0.1 | 61.1 | |
| 河岸带 Riparian | 5月 May | 0.0 | 3.7 | 0.0 | 33.8** | 27.6** | <0.1 | 3.4 | 7.3 | 10.4** | <0.1 | <0.1 | 1.4 | 87.6 |
| 9月 September | 0.6 | 7.8 | 0.8 | 17.1** | 0.3 | 0.5 | 30** | 4.7 | 13.8** | 6.2 | 1.5 | 7.4 | 90.7 | |
| 子流域 Subcatchment | 5月 May | <0.1 | 0.2 | 1.2 | 0.3 | 7.1 | 7.0 | 2.8 | 2.9 | 2.0 | 12.6** | 40.9** | 1.1 | 78.1 |
| 9月 September | 6.2 | 0.3 | 0.3 | <0.1 | 2.2 | 4.7 | 1.0 | 0.4 | 3.4 | 6.7** | 58.8** | 2.4 | 86.4 |
Table 6 Interpretation of total water quality by multi-scale landscape pattern index %
| 月份 Month | TA | LPI | NP | PD | ED | LSI | SHAPE_MN | ENN_MN | SHDI | AI | COHESION | CONTAG | 总计 Total | |
|---|---|---|---|---|---|---|---|---|---|---|---|---|---|---|
| 河段 Riverine reach | 5月 May | 0.4 | 9.6 | 8.4 | 0.0 | 0.0 | <0.1 | 17.6** | 1.2 | 0.1 | 9.3 | 19.8* | 0.3 | 66.7 |
| 9月 September | 0.2 | 6 | 13.1* | 0.0 | 0.0 | <0.1 | 9.1 | 1.7 | <0.1 | 6.0 | 25* | <0.1 | 61.1 | |
| 河岸带 Riparian | 5月 May | 0.0 | 3.7 | 0.0 | 33.8** | 27.6** | <0.1 | 3.4 | 7.3 | 10.4** | <0.1 | <0.1 | 1.4 | 87.6 |
| 9月 September | 0.6 | 7.8 | 0.8 | 17.1** | 0.3 | 0.5 | 30** | 4.7 | 13.8** | 6.2 | 1.5 | 7.4 | 90.7 | |
| 子流域 Subcatchment | 5月 May | <0.1 | 0.2 | 1.2 | 0.3 | 7.1 | 7.0 | 2.8 | 2.9 | 2.0 | 12.6** | 40.9** | 1.1 | 78.1 |
| 9月 September | 6.2 | 0.3 | 0.3 | <0.1 | 2.2 | 4.7 | 1.0 | 0.4 | 3.4 | 6.7** | 58.8** | 2.4 | 86.4 |
| 5月总体水质与土地利用类型 Total water quality and land use types in May | 相关系数 Correlation coefficient | 9月总体水质与土地利用类型 Total water quality and land use types in September | 相关系数 Correlation coefficient | |
|---|---|---|---|---|
| 河段 Riverine reach | 建设用地 Construction land | 0.182 | 草地 Grassland | 0.218 |
| 水域+建设用地 Water+Construction land | 0.104 | 草地+水域 Grassland+Water | 0.255 | |
| 林地+草地+建设用地 Forest+Grassland+Construction land | 0.030 | 草地+水域+建设用地 Grassland+Water+Construction land | 0.273 | |
| 林地+草地+建设用地+裸地 Forest+Grassland+Construction land+Unused | 0.006 | 耕地+草地+水域+裸地 Farmland+Grassland+Water+Unused | 0.271 | |
| 耕地+林地+草地+建设用地+裸地 Farmland+Forest+Grassland+Construction land+Unused | -0.018 | 耕地+林地+草地+水域+裸地 Farmland+Forest+Grassland+Water+Unused | 0.233 | |
| 耕地+林地+草地+水域+建设用地+裸地 Farmland+Forest+Grassland+Water+ Construction land+Unused | -0.063 | 耕地+林地+草地+水域+建设用地+裸地 Farmland+Forest+Grassland+Water+ Construction land+Unused | 0.191 | |
| 河岸带 Riparian | 水域 Water | 0.127 | 草地 Grassland | 0.258 |
| 耕地+草地 Farmland+Grassland | 0.149 | 耕地+草地 Farmland+Grassland | 0.314 | |
| 耕地+草地+水域 Farmland+Grassland+Water | 0.161 | 耕地+草地+建设用地 Farmland+Grassland+Construction land | 0.284 | |
| 耕地+林地+草地+水域 Farmland+Forest+Grassland+Water | 0.163 | 耕地+草地+林地+建设用地 Farmland+Grassland+Forest+Construction land | 0.253 | |
| 耕地+林地+草地+水域+裸地 Farmland+Forest+Grassland+Water+Unused | 0.138 | 耕地+林地+草地+水域+建设用地 Farmland+Forest+Grassland+Water+Construction land | 0.224 | |
| 耕地+林地+草地+水域+建设用地+裸地 Farmland+Forest+Grassland+Water+ Construction land+Unused | 0.120 | 耕地+林地+草地+水域+建设用地+裸地 Farmland+Forest+Grassland+Water+ Construction land+Unused | 0.202 | |
| 子流域Subcatchment | 裸地 Unused | 0.154 | 草地 Grassland | 0.338 |
| 草地+裸地 Grassland+Unused | 0.214 | 草地+水域 Grassland+Water | 0.379 | |
| 草地+水域+裸地 Grassland+Water+Unused | 0.252 | 草地+水域+建设用地 Grassland+Water+Construction land | 0.363 | |
| 耕地+草地+水域+裸地 Farmland +Grassland+Water+Unused | 0.253 | 林地+草地+水域+建设用地 Forest+ Grassland+Water+Construction land | 0.357 | |
| 耕地+林地+草地+水域+裸地 Farmland+Forest+Grassland+Water+Unused | 0.2407 | 耕地+林地+草地+水域+建设用地 Farmland +Forest+Grassland+Water+Construction land | 0.330 | |
| 耕地+林地+草地+水域+建设用地+裸地 Farmland+Forest+Grassland+Water+ Construction land+Unused | 0.1928 | 耕地+林地+草地+水域+建设用地+裸地 Farmland+Forest+Grassland+Water+ Construction land+Unused | 0.304 |
Table 7 The correlation between total water quality and land use structure combination
| 5月总体水质与土地利用类型 Total water quality and land use types in May | 相关系数 Correlation coefficient | 9月总体水质与土地利用类型 Total water quality and land use types in September | 相关系数 Correlation coefficient | |
|---|---|---|---|---|
| 河段 Riverine reach | 建设用地 Construction land | 0.182 | 草地 Grassland | 0.218 |
| 水域+建设用地 Water+Construction land | 0.104 | 草地+水域 Grassland+Water | 0.255 | |
| 林地+草地+建设用地 Forest+Grassland+Construction land | 0.030 | 草地+水域+建设用地 Grassland+Water+Construction land | 0.273 | |
| 林地+草地+建设用地+裸地 Forest+Grassland+Construction land+Unused | 0.006 | 耕地+草地+水域+裸地 Farmland+Grassland+Water+Unused | 0.271 | |
| 耕地+林地+草地+建设用地+裸地 Farmland+Forest+Grassland+Construction land+Unused | -0.018 | 耕地+林地+草地+水域+裸地 Farmland+Forest+Grassland+Water+Unused | 0.233 | |
| 耕地+林地+草地+水域+建设用地+裸地 Farmland+Forest+Grassland+Water+ Construction land+Unused | -0.063 | 耕地+林地+草地+水域+建设用地+裸地 Farmland+Forest+Grassland+Water+ Construction land+Unused | 0.191 | |
| 河岸带 Riparian | 水域 Water | 0.127 | 草地 Grassland | 0.258 |
| 耕地+草地 Farmland+Grassland | 0.149 | 耕地+草地 Farmland+Grassland | 0.314 | |
| 耕地+草地+水域 Farmland+Grassland+Water | 0.161 | 耕地+草地+建设用地 Farmland+Grassland+Construction land | 0.284 | |
| 耕地+林地+草地+水域 Farmland+Forest+Grassland+Water | 0.163 | 耕地+草地+林地+建设用地 Farmland+Grassland+Forest+Construction land | 0.253 | |
| 耕地+林地+草地+水域+裸地 Farmland+Forest+Grassland+Water+Unused | 0.138 | 耕地+林地+草地+水域+建设用地 Farmland+Forest+Grassland+Water+Construction land | 0.224 | |
| 耕地+林地+草地+水域+建设用地+裸地 Farmland+Forest+Grassland+Water+ Construction land+Unused | 0.120 | 耕地+林地+草地+水域+建设用地+裸地 Farmland+Forest+Grassland+Water+ Construction land+Unused | 0.202 | |
| 子流域Subcatchment | 裸地 Unused | 0.154 | 草地 Grassland | 0.338 |
| 草地+裸地 Grassland+Unused | 0.214 | 草地+水域 Grassland+Water | 0.379 | |
| 草地+水域+裸地 Grassland+Water+Unused | 0.252 | 草地+水域+建设用地 Grassland+Water+Construction land | 0.363 | |
| 耕地+草地+水域+裸地 Farmland +Grassland+Water+Unused | 0.253 | 林地+草地+水域+建设用地 Forest+ Grassland+Water+Construction land | 0.357 | |
| 耕地+林地+草地+水域+裸地 Farmland+Forest+Grassland+Water+Unused | 0.2407 | 耕地+林地+草地+水域+建设用地 Farmland +Forest+Grassland+Water+Construction land | 0.330 | |
| 耕地+林地+草地+水域+建设用地+裸地 Farmland+Forest+Grassland+Water+ Construction land+Unused | 0.1928 | 耕地+林地+草地+水域+建设用地+裸地 Farmland+Forest+Grassland+Water+ Construction land+Unused | 0.304 |
| 5月总体水质与景观格局指数 Total water quality and landscape pattern index in May | 相关系数 Correlation coefficient | 9月总体水质与景观格局指数 Total water quality and landscape pattern index in September | 相关系数 Correlation coefficient | |
|---|---|---|---|---|
| 河段 Riverine reach | TA | 0.212 | SHAPE_MN | 0.146 |
| TA+COHESION | 0.210 | LPI+COHESION | 0.177 | |
| TA+ENN_MN+COHESION | 0.217 | LPI+SHAPE_MN+COHESION | 0.157 | |
| TA+ENN_MN+COHESION+AI | 0.205 | PD+ED+CONTAG+COHESION | 0.153 | |
| TA+ED+ENN_MN+COHESION+AI | 0.197 | PD+LPI+ED+LSI+COHESION | 0.157 | |
| TA+ED+LSI+ENN_MN+COHESION+AI | 0.187 | PD+LPI+ED+CONTAG+COHESION+AI | 0.160 | |
| 河岸带 Riparian | ENN_MN | 0.352 | COHESION | 0.264 |
| PD+ENN_MN | 0.371 | LPI+SHAPE_MN | 0.352 | |
| PD+ENN_MN+COHESION | 0.345 | LPI+ED+SHAPE_MN | 0.384 | |
| PD+ENN_MN+CONTAG+COHESION | 0.311 | LPI+PD+SHAPE_MN+COHESION | 0.380 | |
| PD+ED+ENN_MN+CONTAG+COHESION | 0.287 | LPI+PD+SHAPE_MN+COHESION+AI | 0.363 | |
| PD+ED+ENN_MN+CONTAG+COHESION+AI | 0.264 | LPI+PD+SHAPE_MN+CONTAG+COHESION+AI | 0.347 | |
| 子流域Subcatchment | COHESION | 0.092 | COHESION | 0.280 |
| LPI+COHESION | 0.122 | LPI+COHESION | 0.337 | |
| LPI+COHESION+SHDI | 0.106 | LPI+COHESION+SHDI | 0.327 | |
| LPI+CONTAG+COHESION+SHDI | 0.093 | LPI+CONTAG+COHESION+SHDI | 0.306 | |
| PD+LPI+COHESION+SHDI+AI | 0.077 | PD+LPI+COHESION+SHDI+AI | 0.281 | |
| PD+LPI+ED+COHESION+SHDI+AI | 0.065 | PD+LPI+ED+COHESION+SHDI+AI | 0.262 |
Table 8 The correlation between total water quality and landscape pattern index combination
| 5月总体水质与景观格局指数 Total water quality and landscape pattern index in May | 相关系数 Correlation coefficient | 9月总体水质与景观格局指数 Total water quality and landscape pattern index in September | 相关系数 Correlation coefficient | |
|---|---|---|---|---|
| 河段 Riverine reach | TA | 0.212 | SHAPE_MN | 0.146 |
| TA+COHESION | 0.210 | LPI+COHESION | 0.177 | |
| TA+ENN_MN+COHESION | 0.217 | LPI+SHAPE_MN+COHESION | 0.157 | |
| TA+ENN_MN+COHESION+AI | 0.205 | PD+ED+CONTAG+COHESION | 0.153 | |
| TA+ED+ENN_MN+COHESION+AI | 0.197 | PD+LPI+ED+LSI+COHESION | 0.157 | |
| TA+ED+LSI+ENN_MN+COHESION+AI | 0.187 | PD+LPI+ED+CONTAG+COHESION+AI | 0.160 | |
| 河岸带 Riparian | ENN_MN | 0.352 | COHESION | 0.264 |
| PD+ENN_MN | 0.371 | LPI+SHAPE_MN | 0.352 | |
| PD+ENN_MN+COHESION | 0.345 | LPI+ED+SHAPE_MN | 0.384 | |
| PD+ENN_MN+CONTAG+COHESION | 0.311 | LPI+PD+SHAPE_MN+COHESION | 0.380 | |
| PD+ED+ENN_MN+CONTAG+COHESION | 0.287 | LPI+PD+SHAPE_MN+COHESION+AI | 0.363 | |
| PD+ED+ENN_MN+CONTAG+COHESION+AI | 0.264 | LPI+PD+SHAPE_MN+CONTAG+COHESION+AI | 0.347 | |
| 子流域Subcatchment | COHESION | 0.092 | COHESION | 0.280 |
| LPI+COHESION | 0.122 | LPI+COHESION | 0.337 | |
| LPI+COHESION+SHDI | 0.106 | LPI+COHESION+SHDI | 0.327 | |
| LPI+CONTAG+COHESION+SHDI | 0.093 | LPI+CONTAG+COHESION+SHDI | 0.306 | |
| PD+LPI+COHESION+SHDI+AI | 0.077 | PD+LPI+COHESION+SHDI+AI | 0.281 | |
| PD+LPI+ED+COHESION+SHDI+AI | 0.065 | PD+LPI+ED+COHESION+SHDI+AI | 0.262 |
| [1] |
CHO E, CHOI M, 2014. Regional scale spatio-temporal variability of soil moisture and its relationship with meteorological factors over the Korean peninsula[J]. Journal of Hydrology, 516: 317-329.
DOI URL |
| [2] |
CHO K H, PACHEPSKY Y A, OLIVER D M, et al., 2016. Modeling fate and transport of fecally-derived microorganisms at the watershed scale: State of the science and future opportunities[J]. Water Research, 100: 38-56.
DOI URL |
| [3] |
CHEN L, XU J J, WANG G B, et al., 2018. Influence of rainfall data scarcity on non-point source pollution prediction: Implications for physically based models[J]. Journal of Hydrology, 562: 1-16.
DOI URL |
| [4] |
COLLINS K E, DOSCHER C, RENNIE H G, et al., 2013. The Effectiveness of Riparian 'Restoration' on Water Quality-A Case Study of Lowland Streams in Canterbury, New Zealand[J]. Restoration Ecology, 21(1): 40-48.
DOI URL |
| [5] |
DE OLIVEIRA L M, MAILLARD P, DE ANDRADE PINTO E J, 2017. Application of a land cover pollution index to model non-point pollution sources in a Brazilian watershed[J]. CATENA, 150: 124-132.
DOI URL |
| [6] | DING J, JIANG Y, LIU Q, et al., 2016. Influences of the land use pattern on water quality in low-order streams of the Dongjiang River basin, China: A multi-scale analysis[J]. Science of the Total Environment, 551-552: 205-216. |
| [7] |
DUFFY C, O'DONOGHUE C, RYAN M, et al., 2020. The impact of forestry as a land use on water quality outcomes: An integrated analysis[J]. Forest Policy and Economics, DOI: 10.1016/j.forpol.2020. 102185.
DOI |
| [8] |
FANG Y H, ZHENG T Y, ZHENG X L, et al., 2020. Assessment of the hydrodynamics role for groundwater quality using an integration of GIS, water quality index and multivariate statistical techniques[J]. Journal of Environmental Management, DOI: 10.1016/j.jenvman. 2020.111185.
DOI |
| [9] |
FERREIRA P, VAN SOESBERGEN A, MULLIGAN M, et al., 2019. Can forests buffer negative impacts of land-use and climate changes on water ecosystem services? The case of a Brazilian megalopolis[J]. Science of The Total Environment, 685(6097): 248-258.
DOI URL |
| [10] |
GIRI S, QIU Z Y, 2016. Understanding the relationship of land uses and water quality in Twenty First Century: A review[J]. Journal of Environmental Management, 173: 41-48.
DOI URL |
| [11] |
GONG P, LIU H, ZHANG M N, et al., 2019. Stable classification with limited sample: transferring a 30-m resolution sample set collected in 2015 to mapping 10-m resolution global land cover in 2017 [J]. Science Bulletin, 64(6): 370-373.
DOI URL |
| [12] |
GU Q, HU H, MA L G, et al., 2019. Characterizing the spatial variations of the relationship between land use and surface water quality using self-organizing map approach[J]. Ecological Indicators, 102: 633-643.
DOI URL |
| [13] |
KARMAKAR S, HAQUE S M S, HOSSAIN M M, et al., 2019. Water quality parameter as a predictor of small watershed land cover[J]. Ecological Indicators, DOI: 10.1016/j.ecolind.2019.105462.
DOI |
| [14] |
LI K, CHI G Q, WANG L, et al., 2018. Identifying the critical riparian buffer zone with the strongest linkage between landscape characteristics and surface water quality[J]. Ecological Indicators, 93: 741-752.
DOI URL |
| [15] |
LI S Y, NI M F, MAO R, et al., 2018. Riverine CO2 supersaturation and outgassing in a subtropical monsoonal mountainous area (Three Gorges Reservoir Region) of China[J]. Journal of Hydrology, 558: 460-469.
DOI URL |
| [16] |
MCMILLAN S K, TUTTLE A K, JENNINGS G D, et al., 2014. Influence of restoration age and riparian vegetation on reach-scale nutrient retention in restored urban streams[J]. Journal of the American Water Resources Association, 50(3): 626-638.
DOI URL |
| [17] |
MELLO K D, TANIWAKI R H, PAULA F R D, et al., 2020. Multiscale land use impacts on water quality: Assessment, planning, and future perspectives in Brazil[J]. Journal of Environmental Management, DOI: 10.1016/j.jenvman.2020.110879.
DOI |
| [18] |
MELLO K D, VALENTE R A, RANDHIR T O, et al., 2018. Effects of land use and land cover on water quality of low-order streams in Southeastern Brazil: Watershed versus riparian zone[J]. CATENA, 167: 130-138.
DOI URL |
| [19] | MENESES B M, REIS R, VALE M J, et al., 2015. Land use and land cover changes in Zêzere watershed (Portugal) — Water quality implications[J]. Science of The Total Environment, 527-528: 439-447. |
| [20] |
NI M F, LI S Y, 2020. Optical properties as tracers of riverine dissolved organic matter biodegradation in a headwater tributary of the Yangtze[J]. Journal of Hydrology, DOI: 10.1016/j.jhydrol.2019.124497.
DOI |
| [21] |
OUYANG W, SKIDMORE A K, TOXOPEUS A G, et al., 2010. Long-term vegetation landscape pattern with non-point source nutrient pollution in upper stream of Yellow River basin[J]. Journal of Hydrology, 389(3-4): 373-380.
DOI URL |
| [22] |
RAMIÃO J P, CÁSSIO F, PASCOAL C, 2020. Riparian land use and stream habitat regulate water quality[J]. Limnologica, 82: 125762.
DOI URL |
| [23] |
SHI B Q, BACH P M, LINTERN A et al., 2019. Understanding spatiotemporal variability of in-stream water quality in urban environments: A case study of Melbourne, Australia[J]. Journal of Environmental Management, DOI: 10.1016/j.limno.2020.125762.
DOI |
| [24] |
SHI P, ZHANG Y, LI Z B, et al., 2017. Influence of land use and land cover patterns on seasonal water quality at multi-spatial scales[J]. CATENA, 151: 182-190.
DOI URL |
| [25] |
SUDHAKARAN S, MAHADEVAN H, ARUN V, et al., 2020. A multivariate statistical approach in assessing the quality of potable and irrigation water environs of the Netravati River basin (India)[J]. Groundwater for Sustainable Development, DOI: 10.1016/j.gsd.2020. 100462.
DOI |
| [26] |
WANG L T, WANG S X, ZHOU Y, et al., 2020. Landscape pattern variation, protection measures, and land use/land cover changes in drinking water source protection areas: A case study in Danjiangkou Reservoir, China[J]. Global Ecology and Conservation, DOI: 10.1016/j.gecco.2019. e00827.
DOI |
| [27] |
WANG M H, DUAN L J, WANG J P, et al., 2020. Determining the width of lake riparian buffer zones for improving water quality base on adjustment of land use structure[J]. Ecological Engineering, DOI: 10.1016/j.ecoleng.2020.106001.
DOI |
| [28] |
WANG W L, LIU X H, WANG Y F, et al., 2016. Analysis of point source pollution and water environmental quality variation trends in the Nansi Lake basin from 2002 to 2012 [J]. Environmental Science and Pollution Research, 23(5): 4886-4897.
DOI URL |
| [29] |
WEI W, GAO Y N, HUANG J C, et al., 2020. Exploring the effect of basin land degradation on lake and reservoir water quality in China[J]. Journal of Cleaner Production, DOI: 10.1016/j.jclepro.2020.122249.
DOI |
| [30] |
WU J H, LU J, 2019. Landscape patterns regulate non-point source nutrient pollution in an agricultural watershed[J]. Science of The Total Environment, 669: 377-388.
DOI URL |
| [31] |
WU J H, LU J, 2021. Spatial scale effects of landscape metrics on stream water quality and their seasonal changes[J]. Water Research, DOI: 10.1016/j.watres.2021.116811.
DOI |
| [32] |
XU S, LI S L, ZHONG J, et al., 2020. Spatial scale effects of the variable relationships between landscape pattern and water quality: Example from an agricultural karst river basin, Southwestern China[J]. Agriculture, Ecosystems & Environment, DOI: 10.1016/j.agee.2020. 106999.
DOI |
| [33] |
ZHANG J, LI S Y, DONG R Z, et al., 2019. Influences of land use metrics at multi-spatial scales on seasonal water quality: A case study of river systems in the Three Gorges Reservoir Area, China[J]. Journal of Cleaner Production, 206: 76-85.
DOI URL |
| [34] |
ZHANG J, LI S Y, JIANG C S, 2020a. Effects of land use on water quality in a River Basin (Daning) of the Three Gorges Reservoir Area, China: Watershed versus riparian zone[J]. Ecological Indicators, DOI: 10.1016/j.ecolind.2020.106226.
DOI |
| [35] |
ZHANG Q, CHEN C L, WANG J Z, et al., 2020b. The spatial granularity effect, changing landscape patterns, and suitable landscape metrics in the Three Gorges Reservoir Area, 1995-2015 [J]. Ecological Indicators, DOI: 10.1016/j.ecolind.2020.106259.
DOI |
| [36] | 曹灿, 张飞, 阿依尼格尔·亚力坤, 等, 2018. 艾比湖区域景观格局与河流水质关系探讨[J]. 环境科学, 39(4): 1568-1577. |
| CAO C, ZHANG F, AYINIGER, et al., 2018. Study on the relationship between regional landscape pattern and river water quality in Aibi Lake[J]. Environmental science, 39(4): 1568-1577. | |
| [37] | 窦小东, 黄玮, 易琦, 等, 2019. LUCC及气候变化对龙川江流域径流的影响[J]. 生态环境学报, 28(1): 7-15. |
| DOU X D, HUANG W, YI Q, et al., 2019. Effects of LUCC and climate change on the runoff in Longchuan River Watershed[J]. Journal of Ecology and Environment, 28(1): 7-15. | |
| [38] | 方娜, 刘玲玲, 游清徽, 等, 2019. 不同尺度土地利用方式对鄱阳湖湿地水质的影响[J]. 环境科学, 40(12): 5348-5357. |
| FANG N, LIU L L, YOU Q H, et al., 2019. Effects of land use patterns at different scales on water quality of wetland in Poyang Lake[J]. Environmental Science, 40(12): 5348-5357. | |
| [39] | 李昆, 王玲, 孙伟, 等, 2020. 城市化下景观格局对河流水质变化的空间尺度效应分析[J]. 环境科学学报, 40(1): 343-352. |
| LI K, WANG L, SUN W, et al., 2020. Spatial-scale effects of landscape pattern on river water quality under urbanization[J]. Journal of Environmental Sciences, 40(1): 343-352. | |
| [40] | 王杰, 李鹏, 高海东, 等, 2018. 丹江上游土地利用/景观指数与水质关系初探[J]. 水土保持研究, 25(6): 383-389. |
| WANG J, LI P, GAO H D, et al., 2018. A preliminary study on the relationship between land use/landscape index and water quality in the upper reaches of Danjiang River[J]. Soil and Water Conservation Research, 25(6): 383-389. | |
| [41] | 王一舒, 吴仁人, 荣楠, 等, 2021. 西江下游流域水质与不同空间尺度土地利用的响应关系[J]. 水资源保护, 37(4): 97-104. |
| WANG Y S, WU R R, RONG N, et al., 2021. Response relationship between water quality and land use at different spatial scales in the lower reaches of the Xijiang River[J]. Water Resources Protection, 37(4): 97-104. | |
| [42] | 王竹, 刘扬, 王芳, 等, 2020. 秦皇岛水质时空分布特征及归因分析[J]. 中国农村水利水电 (6): 63-71. |
| WANG Z, LIU Y, WANG F, et al., 2020. Temporal and spatial distribution characteristics and attribution analysis of water quality in Qinhuangdao[J]. China Rural Water and Hydropower (6): 63-71. | |
| [43] | 徐启渝, 王鹏, 舒旺, 等, 2020a. 土地利用结构与空间格局对袁河水质的影响[J]. 环境科学学报, 40(7): 2611-2620. |
| XU Q Y, WANG P, SU W, et al., 2020. Effects of land use structure and spatial pattern on water quality in Yuanhe River[J]. Journal of Environmental Sciences, 40(7): 2611-2620. | |
| [44] | 徐启渝, 王鹏, 王涛, 等, 2020b. 土地利用结构与景观格局对鄱阳湖流域赣江水质的影响[J]. 湖泊科学, 32(4): 1008-1019. |
| XU Q Y, WANG P, WANG T, et al., 2020. Effects of land use structure and landscape pattern on water quality of Ganjiang River in Poyang Lake Basin[J]. Lake Science, 32(4): 1008-1019. | |
| [45] | 杨洁, 许有鹏, 高斌, 等, 2017. 城镇化下河流水质变化及其与景观格局关系分析——以太湖流域苏州市为例[J]. 湖泊科学, 29(4) :827-835. |
| YANG J, XU Y P, GAO B, et al., 2017. Analysis of river water quality change and its relationship with landscape pattern under urbanization: A case study of Suzhou City in Taihu Lake Basin[J]. Lake Science, 29(4): 827-835. | |
| [46] | 杨强强, 徐光来, 杨先成, 等, 2020. 青弋江流域土地利用/景观格局对水质的影响[J]. 生态学报, 40(24): 9048-9058. |
| YANG Q Q, XU G L, YANG X C, et al., 2020. Effects of land use/ landscape pattern on water quality in Qingyi River Basin[J]. Acta Ecologica Sinica, 40(24): 9048-9058. |
| [1] | WANG Jiayi, SUN Tingting, SHA Runyu, CHEN Tinghong, XING Ran, QIN Boqiang, SHI Wenqing. Study on the Synergic Effect of Algae Salvage on Pollution Control and Carbon Emission Reduction in Eutrophic Lakes [J]. Ecology and Environment, 2023, 32(6): 1108-1114. |
| [2] | ZHANG Junwei, XIA Shengjie, CHEN Huiru, LIU Yanhong. Influence of Landscape Pattern Evolution on Thermal Environment of Urban Agglomerations in Central Shanxi Province [J]. Ecology and Environment, 2023, 32(5): 943-955. |
| [3] | HE Beibei, FAN Shanshan, HONG Nian, LIU An. Variations of Roof Stormwater Quality under Different Storage Types [J]. Ecology and Environment, 2023, 32(3): 567-578. |
| [4] | CHENG Peng, SUN Mingdong, HAO Shaonan. Water Quality Assessment of Upstream Rivers of Guanting Reservoir Based on the Simplest Water Quality Index [J]. Ecology and Environment, 2023, 32(2): 372-380. |
| [5] | WANG Chenxi, ZHANG Qiongrui, ZHANG Ruoqi, SUN Xuechao, XU Songjun. Effects of Landscape Pattern on Water Quality Purification Service in the Pearl River Basin in Guangdong Province [J]. Ecology and Environment, 2022, 31(7): 1425-1433. |
| [6] | JI Xiaoyan, WANG Shanshan, YANG Kai, REN Bei. Temporal and Spatial Variation Characteristics of Total Nitrogen Concentration in Surface Water from 2016 to 2020 in China [J]. Ecology and Environment, 2022, 31(6): 1184-1192. |
| [7] | LI Meijiao, HE Fanneng, ZHAO Caishan, YANG Fan. Credibility Assessment of Cropland Data in Xinjiang Area in Global Historical LUCC Datasets [J]. Ecology and Environment, 2022, 31(6): 1215-1224. |
| [8] | CUI Jian, DU Yi, DING Chengcheng, LI Jinfeng, GAO Fangshu, CHANG Yajun, ZHANG Jibiao, LIU Xiaojing, YAO Dongrui. Phosphorus Fraction and Abatement of Lakes in China: A Review [J]. Ecology and Environment, 2022, 31(3): 621-633. |
| [9] | XUAN Jin, LI Zuchan, ZOU Cheng, QIN Zibo, WU Yahua, HUANG Liujing. Multi-scale Effects of Central Bar Landscape Class and Pattern on Plant Diversity in Minjiang River: The Case of Minjiang River Basin (Fuzhou Section) Planning [J]. Ecology and Environment, 2022, 31(12): 2320-2330. |
| [10] | BAI Haifeng, WANG Yirui, SONG Jinxi, KONG Feihe, ZHANG Xuexian, LI Qi. Characteristics of Plankton Community Structure and Its Relation to Environmental Factors in Weihe River, China [J]. Ecology and Environment, 2022, 31(1): 117-130. |
| [11] | BIAN Zhenxing, ZHANG Yufei, GUO Xiaoyu, LIN Lin, YU Miao. Effects of Agricultural Landscape Patterns on the Food Web of Pests and Predatory Natural Enemies in Low Mountain and Hilly Areas [J]. Ecology and Environment, 2022, 31(1): 79-88. |
| [12] | YUAN Weihao, WANG Hua, XIA Yubao, ZENG Yichuan, DENG Yanqing, LI Yuanyuan, ZHANG Xinyue. Relationship of Chlorophyll A and Water Quality Factors in Poyang Lake Based on GAM Model [J]. Ecology and Environment, 2021, 30(8): 1716-1723. |
| [13] | DONG Xin, LANG Jiayu, CHUYUAN Mengran, ZHAO Shanshan, ZHANG Jindong, BAI Wenke. The Seasonal Characteristics of Home Range and Habitat Utilization of Sichuan Golden Monkeys (Rhinopithecus roxellana) [J]. Ecology and Environment, 2021, 30(7): 1342-1352. |
| [14] | SU Hailei, LI Xinru, TAO Yanru, SHI Di, WEI Yuan, SHEN Yaqin, CHEN Yanqing, SUN Fuhong. Study on Water Quality Standard Formulation of USA and Its Revelation to China [J]. Ecology and Environment, 2021, 30(11): 2267-2274. |
| [15] | LEI Jinrui, CHEN Zongzhu, CHEN Yiqing, CHEN Xiaohua, LI Yuanling, WU Tingtian. Landscape Pattern Changes and Driving Factors Analysis of Wetland in Hainan Island during 1990-2018 [J]. Ecology and Environment, 2020, 29(1): 59-70. |
| Viewed | ||||||
|
Full text |
|
|||||
|
Abstract |
|
|||||
Copyright © 2021 Editorial Office of ACTA PETROLEI SINICA
Address:No. 6 Liupukang Street, Xicheng District, Beijing, P.R.China, 510650
Tel: 86-010-62067128, 86-010-62067137, 86-010-62067139
Fax: 86-10-62067130
Email: syxb@cnpc.com.cn
Support byBeijing Magtech Co.ltd, E-mail:support@magtech.com.cn