Ecology and Environment ›› 2023, Vol. 32 ›› Issue (9): 1632-1643.DOI: 10.16258/j.cnki.1674-5906.2023.09.010
• Research Articles • Previous Articles Next Articles
WANG Wei1( ), DAI Mengmeng2
Received:2023-02-14
Online:2023-09-18
Published:2023-12-11
王薇1(), 代萌萌2
作者简介:王薇(1975年生)女,教授,博士,博士研究生导师,研究方向为建筑技术和人居环境。E-mail: vivi.gan@126.com
基金资助:CLC Number:
WANG Wei, DAI Mengmeng. Spatial Morphology of Street Canyons Based on the Spatial and Temporal Distribution of Particulate Matter: Taking Tongan Street in Hefei City as an Example[J]. Ecology and Environment, 2023, 32(9): 1632-1643.
王薇, 代萌萌. 基于颗粒物时空分布的街道峡谷空间形态研究——以合肥市同安街道为例[J]. 生态环境学报, 2023, 32(9): 1632-1643.
Add to citation manager EndNote|Ris|BibTeX
URL: https://www.jeesci.com/EN/10.16258/j.cnki.1674-5906.2023.09.010
| 设计指标 | 测点编号 | ||||
|---|---|---|---|---|---|
| A | B | C | D | E | |
| 建筑退界/m | 60 | 55 | 40 | 0 | 25 |
| 植被覆盖率/% | 0.21 | 0.16 | 0.17 | 0.12 | 0.25 |
| 高宽比 | 0.82 | 0.80 | 0.10 | 0.35 | 1.40 |
| 高度比 | 0.6 | 7.0 | 0.9 | 1.4 | 2.8 |
| 相对高程 | 15.85 | 0.0 | 16.47 | 11.58 | 9.54 |
| 天空开阔度 | 0.62 | 0.58 | 0.78 | 0.46 | 0.54 |
Table 1 Street canyon measurement point information
| 设计指标 | 测点编号 | ||||
|---|---|---|---|---|---|
| A | B | C | D | E | |
| 建筑退界/m | 60 | 55 | 40 | 0 | 25 |
| 植被覆盖率/% | 0.21 | 0.16 | 0.17 | 0.12 | 0.25 |
| 高宽比 | 0.82 | 0.80 | 0.10 | 0.35 | 1.40 |
| 高度比 | 0.6 | 7.0 | 0.9 | 1.4 | 2.8 |
| 相对高程 | 15.85 | 0.0 | 16.47 | 11.58 | 9.54 |
| 天空开阔度 | 0.62 | 0.58 | 0.78 | 0.46 | 0.54 |

Figure 1 Spatial distribution of buildings at selected sites in the study area
| 仪器名称 | 监测参数 | 量程 | 测量精度 |
|---|---|---|---|
| ONETEST-500 粉尘浓度监测仪 | 温度/℃ | −20-60 | ±0.005 |
| 湿度/% | 0-100 | ±0.03 | |
| KESTREL 5500 手持式风速仪 | 风速/(m•s−1) | 0.6-60 | ±0.03 |
| 风向/(°) | 0-360 | ±5.00 | |
| ONETEST-500粉尘浓度监测仪 | PM2.5/(μg•m−3) | 0-1000 | ±0.10FS |
Table 2 Test instrument accuracy
| 仪器名称 | 监测参数 | 量程 | 测量精度 |
|---|---|---|---|
| ONETEST-500 粉尘浓度监测仪 | 温度/℃ | −20-60 | ±0.005 |
| 湿度/% | 0-100 | ±0.03 | |
| KESTREL 5500 手持式风速仪 | 风速/(m•s−1) | 0.6-60 | ±0.03 |
| 风向/(°) | 0-360 | ±5.00 | |
| ONETEST-500粉尘浓度监测仪 | PM2.5/(μg•m−3) | 0-1000 | ±0.10FS |
| 类型 | 项目 | 说明 |
|---|---|---|
| 空气质量标准 计算公式 | 计算公式 | |
| 单位诠释 | I是空气质量指数,即AQI,为输出值;ρ是PM2.5日均值质量浓度,为输入值;Ilow是指数限值,与ρlow相对应,常量;Ihigh是对应于ρhigh的指数限值,常量;ρlow是小于或等于ρ的质量浓度限值,常量;ρhigh是大于或等于ρ的质量浓度限值,常量 | |
| 空气污染物浓度等级评价标准 | 计算意义 | 评价街道峡谷不同位置的空气质量水平 |
| 空气质量指数 | AQI≤50;50<AQI≤100;100<AQI≤150;150<AQI≤200;200<AQI≤300;AQI>300 | |
| 空气质量级别 | 1级;2级;3级;4级;5级;6级 | |
| 空气质量水平 | 优;良;轻度污染;中度污染;重度污染;严重污染 |
Table 3 Calculation formula and evaluation standard of air pollutant concentration grade
| 类型 | 项目 | 说明 |
|---|---|---|
| 空气质量标准 计算公式 | 计算公式 | |
| 单位诠释 | I是空气质量指数,即AQI,为输出值;ρ是PM2.5日均值质量浓度,为输入值;Ilow是指数限值,与ρlow相对应,常量;Ihigh是对应于ρhigh的指数限值,常量;ρlow是小于或等于ρ的质量浓度限值,常量;ρhigh是大于或等于ρ的质量浓度限值,常量 | |
| 空气污染物浓度等级评价标准 | 计算意义 | 评价街道峡谷不同位置的空气质量水平 |
| 空气质量指数 | AQI≤50;50<AQI≤100;100<AQI≤150;150<AQI≤200;200<AQI≤300;AQI>300 | |
| 空气质量级别 | 1级;2级;3级;4级;5级;6级 | |
| 空气质量水平 | 优;良;轻度污染;中度污染;重度污染;严重污染 |
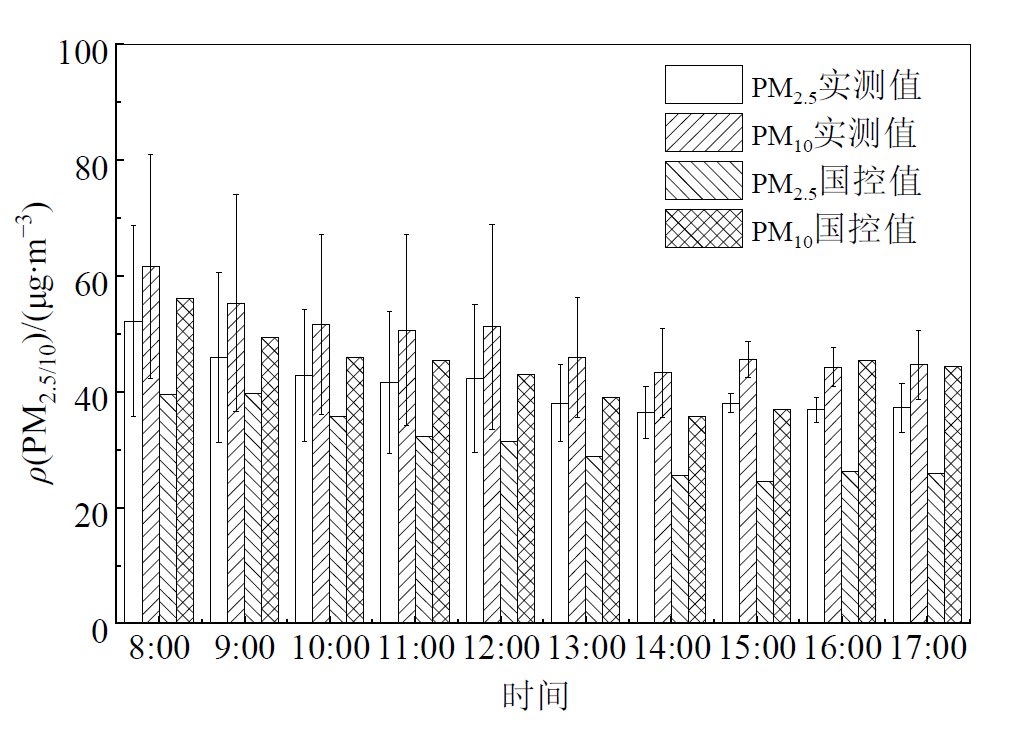
Figure 2 Average intra-day distribution of PM2.5 and PM10 mass concentrations
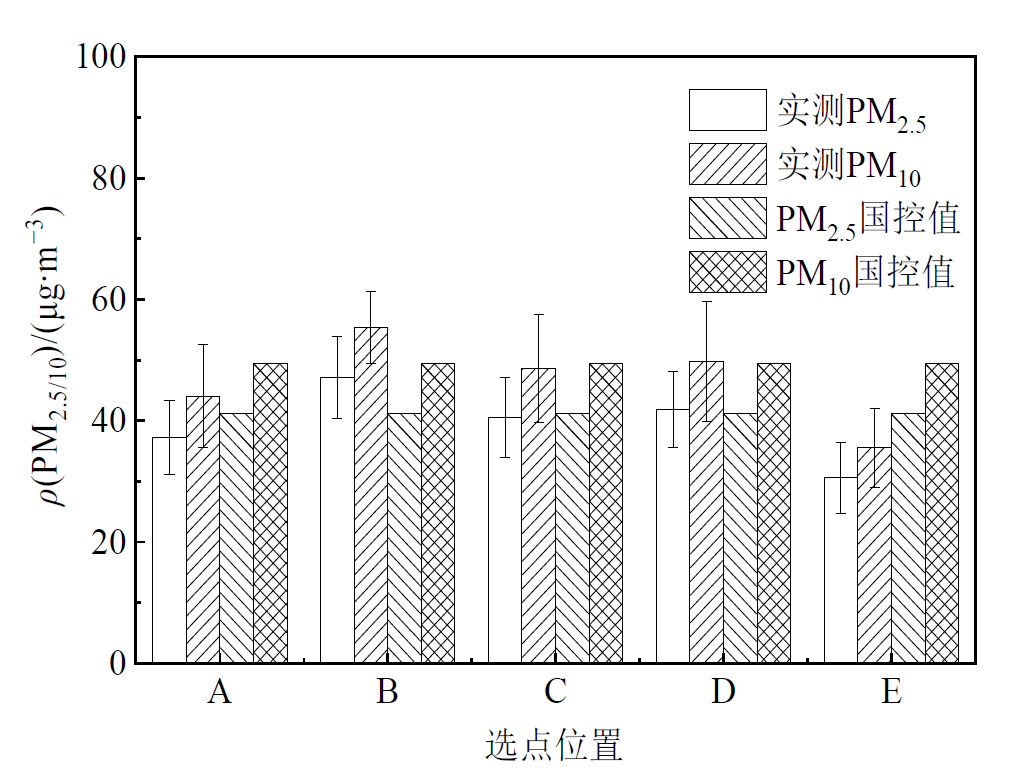
Figure 3 PM2.5 and PM10 mass concentrations at each monitoring point

Figure 4 Spatial distribution of particulate matter mass concentrations at measurement points in the street canyon
| 变量因子 | 风速 | |
|---|---|---|
| PM2.5 | 相关性 | −0.431** 1) |
| 显著性 | 0.002 | |
| PM10 | 相关性 | −0.498** |
| 显著性 | 0.000 | |
Table 4 Correlation analysis of PM2.5, PM10 and wind speed in a street canyon
| 变量因子 | 风速 | |
|---|---|---|
| PM2.5 | 相关性 | −0.431** 1) |
| 显著性 | 0.002 | |
| PM10 | 相关性 | −0.498** |
| 显著性 | 0.000 | |
| 选点位置 | PM2.5 | PM10 | |||||||
|---|---|---|---|---|---|---|---|---|---|
| ρ(PM2.5)/(μg•m−3) | AQI | 空气质量级别 | 空气质量级别 | ρ(PM10)/(μg•m−3) | AQI | 空气质量水平 | 空气质量级别 | ||
| A | 37.24 | 52.8 | 良 | 2级 | 44.06 | 62.9 | 良 | 2级 | |
| B | 47.15 | 65.1 | 良 | 2级 | 55.40 | 79.1 | 良 | 2级 | |
| C | 40.59 | 56.9 | 良 | 2级 | 48.59 | 69.4 | 良 | 2级 | |
| D | 41.84 | 58.5 | 良 | 2级 | 49.77 | 71.1 | 良 | 2级 | |
| E | 30.61 | 43.7 | 优 | 1级 | 35.54 | 50.7 | 良 | 2级 | |
Table 5 Air Pollutant Concentration Level Evaluation Criteria
| 选点位置 | PM2.5 | PM10 | |||||||
|---|---|---|---|---|---|---|---|---|---|
| ρ(PM2.5)/(μg•m−3) | AQI | 空气质量级别 | 空气质量级别 | ρ(PM10)/(μg•m−3) | AQI | 空气质量水平 | 空气质量级别 | ||
| A | 37.24 | 52.8 | 良 | 2级 | 44.06 | 62.9 | 良 | 2级 | |
| B | 47.15 | 65.1 | 良 | 2级 | 55.40 | 79.1 | 良 | 2级 | |
| C | 40.59 | 56.9 | 良 | 2级 | 48.59 | 69.4 | 良 | 2级 | |
| D | 41.84 | 58.5 | 良 | 2级 | 49.77 | 71.1 | 良 | 2级 | |
| E | 30.61 | 43.7 | 优 | 1级 | 35.54 | 50.7 | 良 | 2级 | |
| 变量因子 | 空气温度 | 相对湿度 | |
|---|---|---|---|
| PM2.5 | 相关性 | −0.209 | 0.327* 1) |
| 显著性 | 0.145 | 0.020 | |
| PM10 | 相关性 | −0.223 | 0.317* |
| 显著性 | 0.120 | 0.025 | |
Table 6 Correlation analysis of PM2.5 and PM10 and temperature and humidity in a street canyon
| 变量因子 | 空气温度 | 相对湿度 | |
|---|---|---|---|
| PM2.5 | 相关性 | −0.209 | 0.327* 1) |
| 显著性 | 0.145 | 0.020 | |
| PM10 | 相关性 | −0.223 | 0.317* |
| 显著性 | 0.120 | 0.025 | |
| 变量因子 | 植被覆盖率 | 建筑高度比 | 相对高程 | 天空开阔度 | 建筑退界 | 高宽比 | |
|---|---|---|---|---|---|---|---|
| PM2.5 | 相关性 | −0.892*1) | 0.494 | −0.461 | 0.070 | 0.183 | −0.590 |
| 显著性 | 0.042 | 0.398 | 0.434 | 0.911 | 0.768 | 0.295 | |
| PM10 | 相关性 | −0.904* | 0.441 | −0.407 | 0.100 | 0.169 | −0.639 |
| 显著性 | 0.035 | 0.458 | 0.497 | 0.873 | 0.786 | 0.246 | |
Table 7 Correlation of street canyon morphological indicators with PM2.5 and PM10 mass concentrations
| 变量因子 | 植被覆盖率 | 建筑高度比 | 相对高程 | 天空开阔度 | 建筑退界 | 高宽比 | |
|---|---|---|---|---|---|---|---|
| PM2.5 | 相关性 | −0.892*1) | 0.494 | −0.461 | 0.070 | 0.183 | −0.590 |
| 显著性 | 0.042 | 0.398 | 0.434 | 0.911 | 0.768 | 0.295 | |
| PM10 | 相关性 | −0.904* | 0.441 | −0.407 | 0.100 | 0.169 | −0.639 |
| 显著性 | 0.035 | 0.458 | 0.497 | 0.873 | 0.786 | 0.246 | |
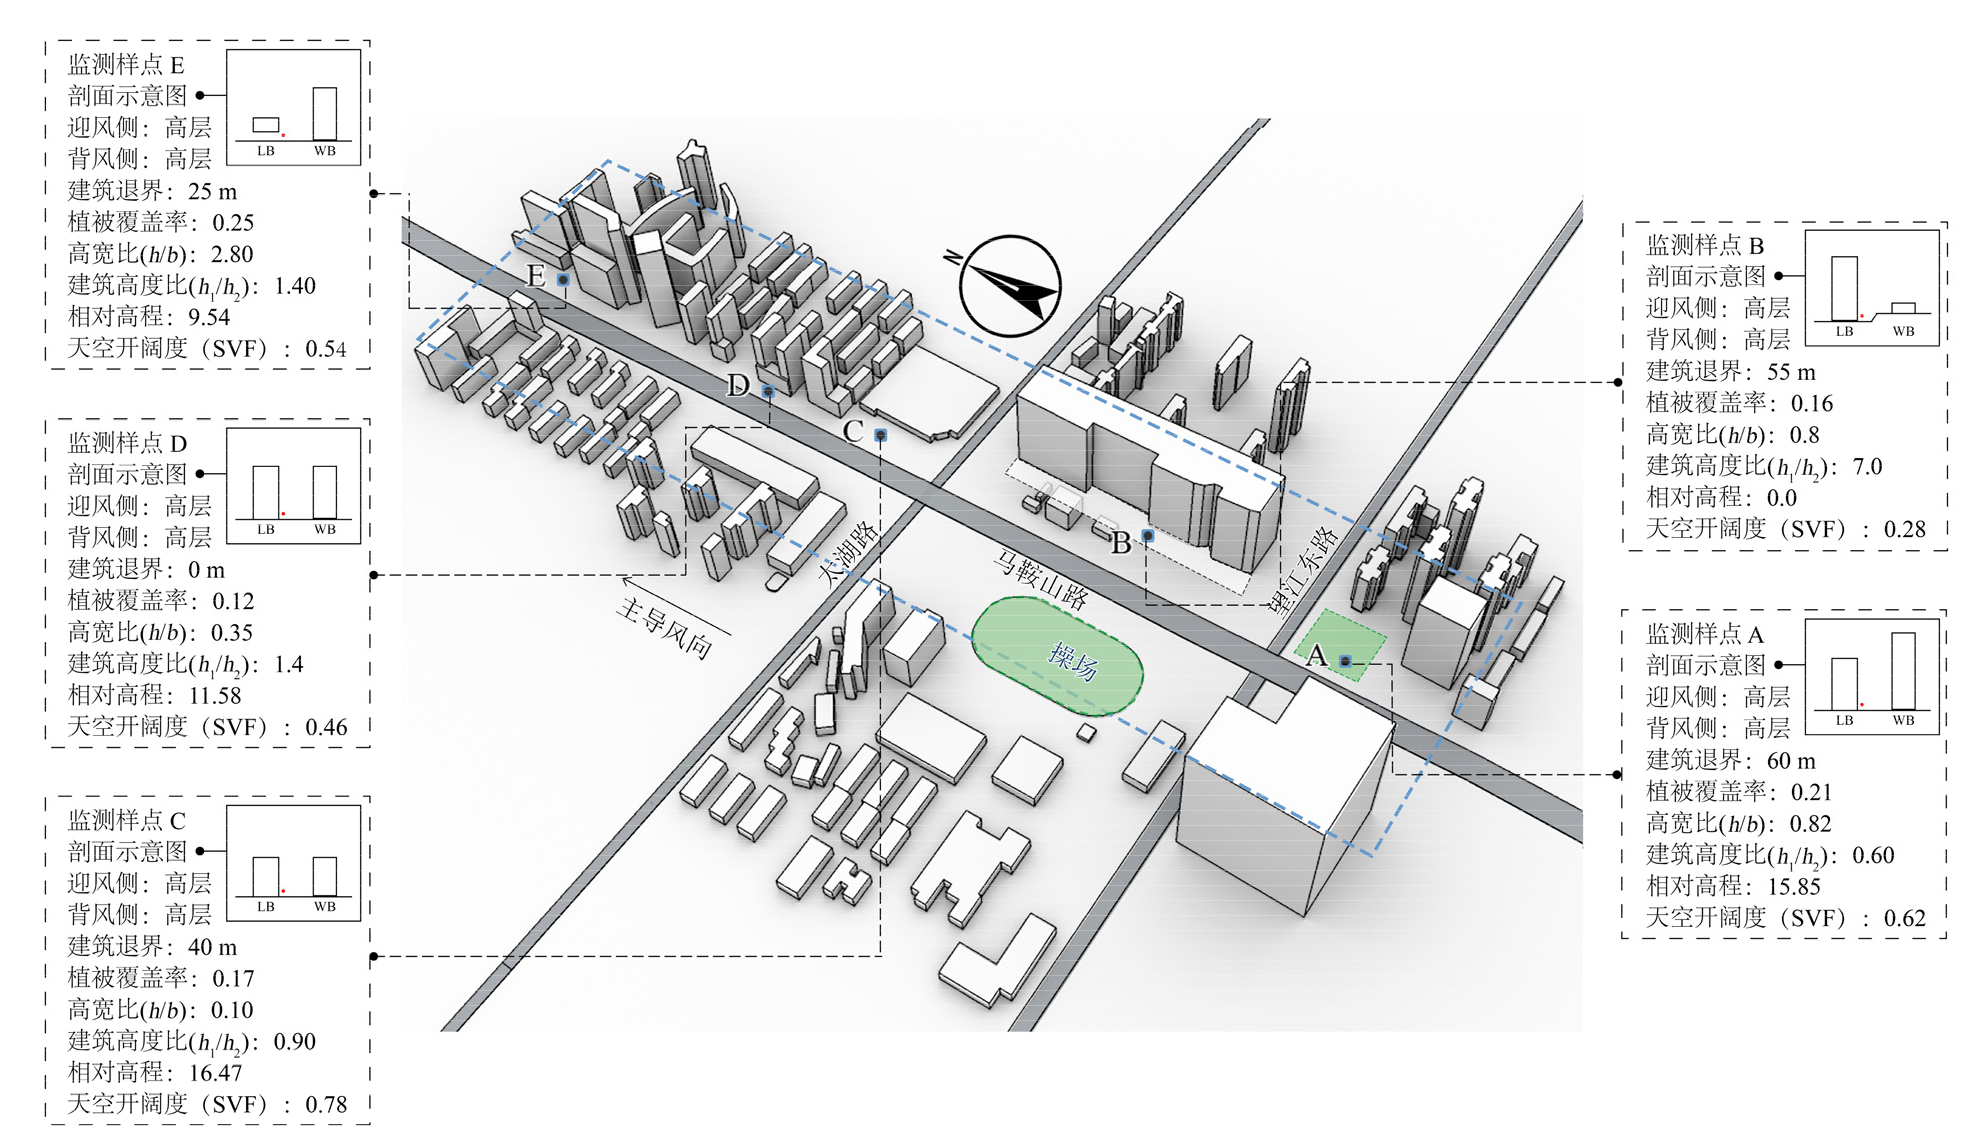
Figure 5 Spatial design indicators for street canyons
| 方案对比 | 模型要素特征 | 详细说明 | 备注 | |
|---|---|---|---|---|
| 原有方案 | 基准模型 | 下沉广场外部空间实测数据建立的数值模型 | 用做与其他方案对比 | |
| 优化 方案 | 方案1 体量设计 | 方案1-①;深度 | 统一增加下沉广场深度至7 m | 通过改变下沉广场的深度或宽度,改变其体量大小 |
| 方案1-②;宽度 | 统一增加下沉广场宽度至60 m | |||
| 方案1-③;深度+宽度 | 同时增加下沉广场的深度和宽度至7、60 m | |||
| 方案2 位置设计 | 方案2-①;前置 | 将下沉广场的位置放置到离建筑远,靠近道路的一侧,体量不变 | 通过移动下沉广场的位置优化下沉广场空间 | |
| 方案2-②;居中 | 将下沉广场放置于道路和建筑中间,体量不变 | |||
| 方案3 形状设计 | 方案3-①;方形 | 将原下沉广场由长条形改为正方形,并保持体量基本一致 | 通过改变下沉广场的形状优化下沉广场空间 | |
| 方案3-②;圆形 | 将原下沉广场由长条形改为圆形,并保持体量基本一致 | |||
| 方案4 绿化设计 | 方案4-①;树木+草地 | 将原下沉广场内增添绿化,包括树木和草坪等 | 通过改变下沉广场的环境优化下沉广场空间 | |
Table 8 Modelling solutions
| 方案对比 | 模型要素特征 | 详细说明 | 备注 | |
|---|---|---|---|---|
| 原有方案 | 基准模型 | 下沉广场外部空间实测数据建立的数值模型 | 用做与其他方案对比 | |
| 优化 方案 | 方案1 体量设计 | 方案1-①;深度 | 统一增加下沉广场深度至7 m | 通过改变下沉广场的深度或宽度,改变其体量大小 |
| 方案1-②;宽度 | 统一增加下沉广场宽度至60 m | |||
| 方案1-③;深度+宽度 | 同时增加下沉广场的深度和宽度至7、60 m | |||
| 方案2 位置设计 | 方案2-①;前置 | 将下沉广场的位置放置到离建筑远,靠近道路的一侧,体量不变 | 通过移动下沉广场的位置优化下沉广场空间 | |
| 方案2-②;居中 | 将下沉广场放置于道路和建筑中间,体量不变 | |||
| 方案3 形状设计 | 方案3-①;方形 | 将原下沉广场由长条形改为正方形,并保持体量基本一致 | 通过改变下沉广场的形状优化下沉广场空间 | |
| 方案3-②;圆形 | 将原下沉广场由长条形改为圆形,并保持体量基本一致 | |||
| 方案4 绿化设计 | 方案4-①;树木+草地 | 将原下沉广场内增添绿化,包括树木和草坪等 | 通过改变下沉广场的环境优化下沉广场空间 | |
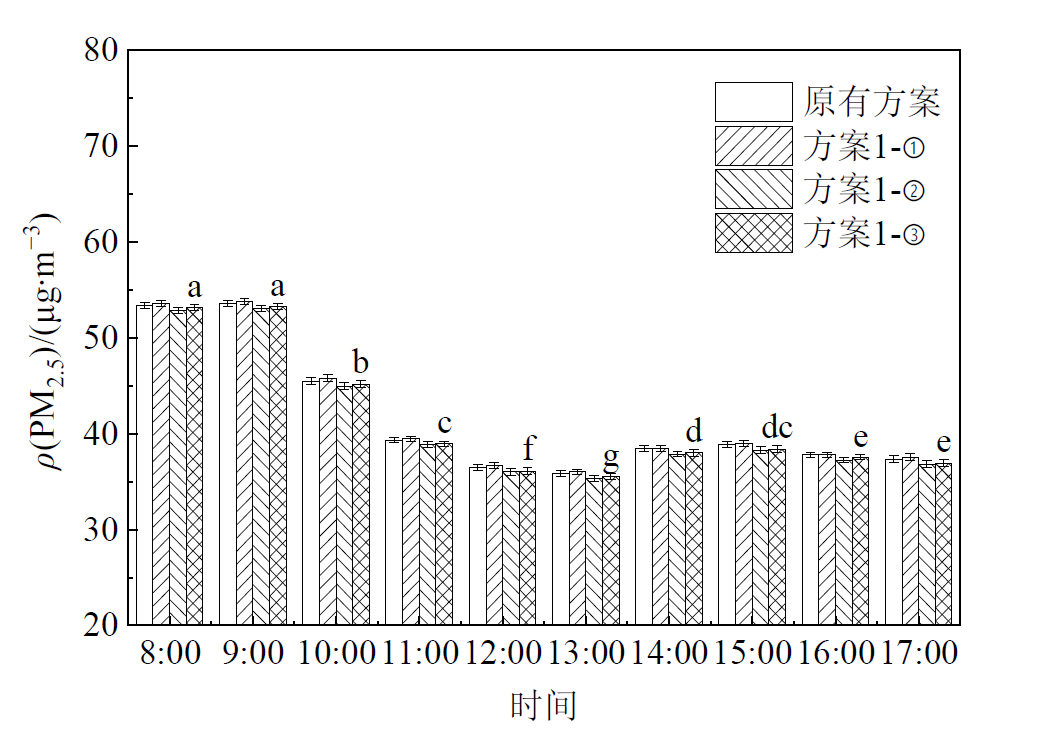
Figure 6 Distribution of PM2.5 mass concentrations in sunken squares of different volumes
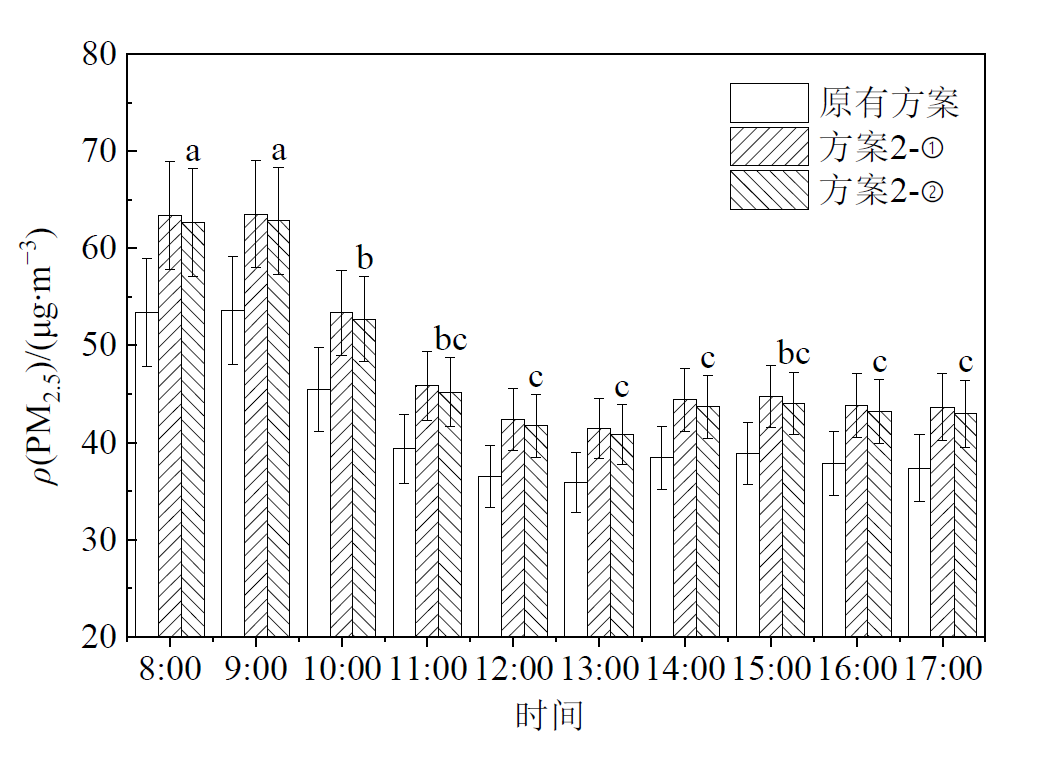
Figure 7 Distribution of PM2.5 mass concentrations in sunken squares at different locations
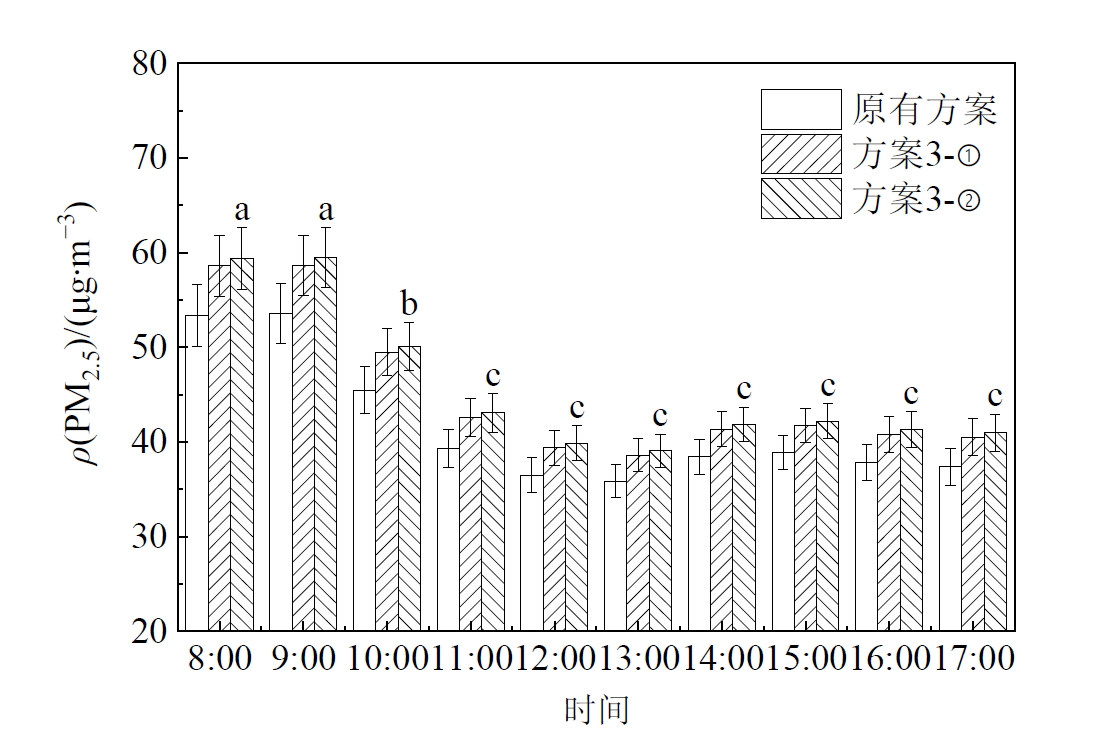
Figure 8 Distribution of PM2.5 mass concentrations in sunken squares of different shapes
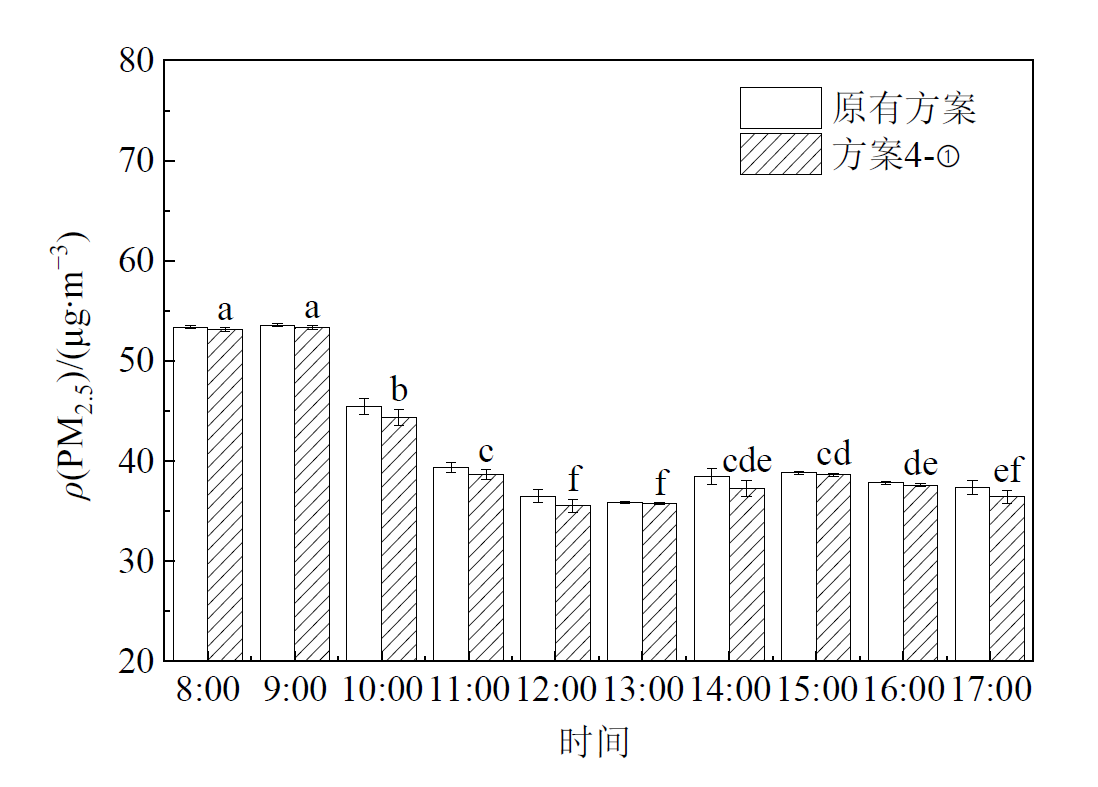
Figure 9 Distribution of PM2.5 mass concentrations in sunken squares with different greenery
| 变量因子 | 高度 | 原有方案 | 方案1-① | 方案1-② | 方案1-③ |
|---|---|---|---|---|---|
| PM2.5质量浓度/ (μg•m−3) | 0.5 m (k=0) |  | 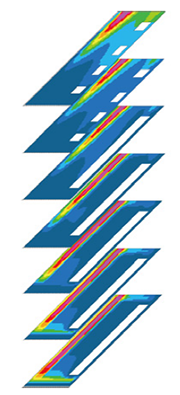 | 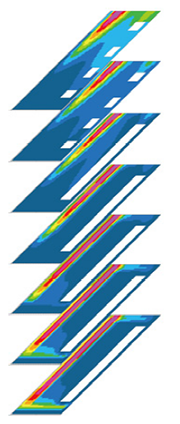 | 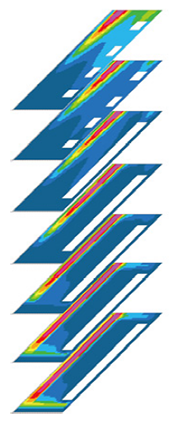 |
| 1.5 m (k=1) | |||||
| 3.5 m (k=3) | |||||
| 7.5 m (k=5) | |||||
| 17.5 m (k=7) | |||||
| 27.5 m (k=9) | |||||
| 42.5 m (k=12) | |||||
| 风速/ (m•s−1) | 0.5 m (k=0) | 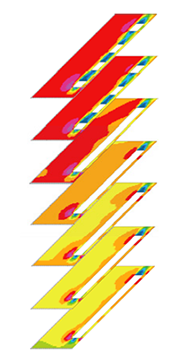 | 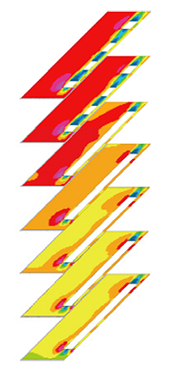 | 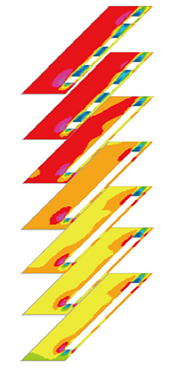 | 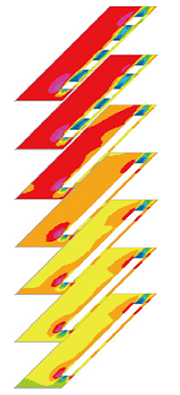 |
| 1.5 m (k=1) | |||||
| 3.5 m (k=3) | |||||
| 7.5 m (k=5) | |||||
| 17.5 m (k=7) | |||||
| 27.5 m (k=9) | |||||
| 42.5 m (k=12) |
Table 9 Visualisation of sunken plaza simulation with different volumes
| 变量因子 | 高度 | 原有方案 | 方案1-① | 方案1-② | 方案1-③ |
|---|---|---|---|---|---|
| PM2.5质量浓度/ (μg•m−3) | 0.5 m (k=0) | | | | |
| 1.5 m (k=1) | |||||
| 3.5 m (k=3) | |||||
| 7.5 m (k=5) | |||||
| 17.5 m (k=7) | |||||
| 27.5 m (k=9) | |||||
| 42.5 m (k=12) | |||||
| 风速/ (m•s−1) | 0.5 m (k=0) | | | | |
| 1.5 m (k=1) | |||||
| 3.5 m (k=3) | |||||
| 7.5 m (k=5) | |||||
| 17.5 m (k=7) | |||||
| 27.5 m (k=9) | |||||
| 42.5 m (k=12) |
| 变量因子 | 高度 | 原有方案 | 方案2-① | 方案2-② |
|---|---|---|---|---|
| PM2.5质量浓度/ (μg•m−3) | 0.5 m (k=0) |  |  |  |
| 1.5 m (k=1) | ||||
| 3.5 m (k=3) | ||||
| 7.5 m (k=5) | ||||
| 17.5 m (k=7) | ||||
| 27.5 m (k=9) | ||||
| 42.5 m (k=12) | ||||
| 风速/ (m•s−1) | 0.5 m (k=0) | 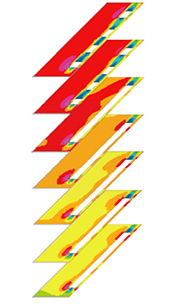 | 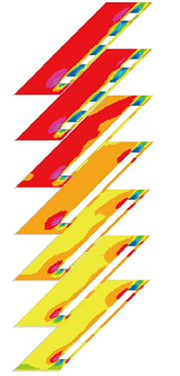 | 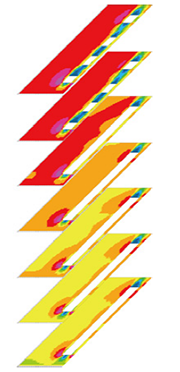 |
| 1.5 m (k=1) | ||||
| 3.5 m (k=3) | ||||
| 7.5 m (k=5) | ||||
| 17.5 m (k=7) | ||||
| 27.5 m (k=9) | ||||
| 42.5 m (k=12) |
Table 10 Visualisation of sunken plaza simulations with different locations
| 变量因子 | 高度 | 原有方案 | 方案2-① | 方案2-② |
|---|---|---|---|---|
| PM2.5质量浓度/ (μg•m−3) | 0.5 m (k=0) | | | |
| 1.5 m (k=1) | ||||
| 3.5 m (k=3) | ||||
| 7.5 m (k=5) | ||||
| 17.5 m (k=7) | ||||
| 27.5 m (k=9) | ||||
| 42.5 m (k=12) | ||||
| 风速/ (m•s−1) | 0.5 m (k=0) | | | |
| 1.5 m (k=1) | ||||
| 3.5 m (k=3) | ||||
| 7.5 m (k=5) | ||||
| 17.5 m (k=7) | ||||
| 27.5 m (k=9) | ||||
| 42.5 m (k=12) |
| 变量因子 | 高度 | 原有方案 | 方案3-① | 方案3-② |
|---|---|---|---|---|
| PM2.5质量浓度/ (μg•m−3) | 0.5 m (k=0) | 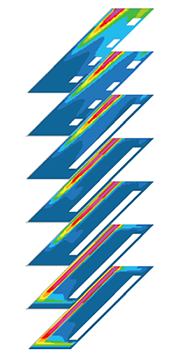 |  |  |
| 1.5 m (k=1) | ||||
| 3.5 m (k=3) | ||||
| 7.5 m (k=5) | ||||
| 17.5 m (k=7) | ||||
| 27.5 m (k=9) | ||||
| 42.5 m (k=12) | ||||
| 风速/(m•s−1) | 0.5 m (k=0) | 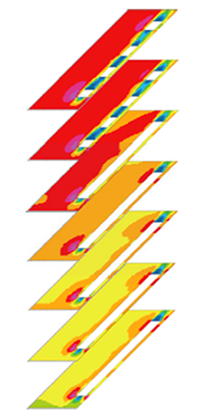 | 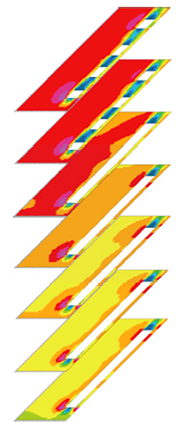 | 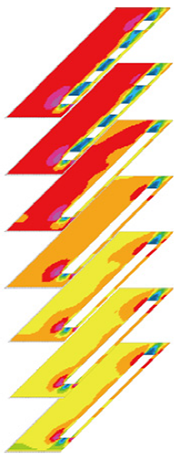 |
| 1.5 m (k=1) | ||||
| 3.5 m (k=3) | ||||
| 7.5 m (k=5) | ||||
| 17.5 m (k=7) | ||||
| 27.5 m (k=9) | ||||
| 42.5 m (k=12) |
Table 11 Simulation visualisation of sunken squares with different shapes
| 变量因子 | 高度 | 原有方案 | 方案3-① | 方案3-② |
|---|---|---|---|---|
| PM2.5质量浓度/ (μg•m−3) | 0.5 m (k=0) | | | |
| 1.5 m (k=1) | ||||
| 3.5 m (k=3) | ||||
| 7.5 m (k=5) | ||||
| 17.5 m (k=7) | ||||
| 27.5 m (k=9) | ||||
| 42.5 m (k=12) | ||||
| 风速/(m•s−1) | 0.5 m (k=0) | | | |
| 1.5 m (k=1) | ||||
| 3.5 m (k=3) | ||||
| 7.5 m (k=5) | ||||
| 17.5 m (k=7) | ||||
| 27.5 m (k=9) | ||||
| 42.5 m (k=12) |
| 变量因子 | 高度 | 绿化方案 | 基准模型 |
|---|---|---|---|
| PM2.5质量浓度/ (μg•m−3) | 0.5 m (k=0) |  |  |
| 1.5 m (k=1) | |||
| 3.5 m (k=3) | |||
| 7.5 m (k=5) | |||
| 17.5 m (k=7) | |||
| 27.5 m (k=9) | |||
| 42.5 m (k=12) | |||
| 风速/ (m•s−1) | 0.5 m (k=0) | 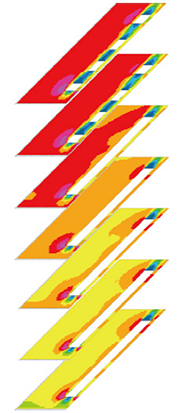 | 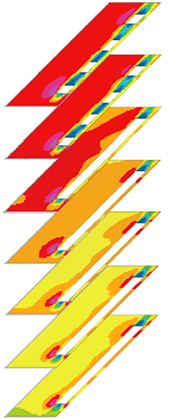 |
| 1.5 m (k=1) | |||
| 3.5 m (k=3) | |||
| 7.5 m (k=5) | |||
| 17.5 m (k=7) | |||
| 27.5 m (k=9) | |||
| 42.5 m (k=12) |
Table 12 Simulation visualisation of sunken squares with different greenery
| 变量因子 | 高度 | 绿化方案 | 基准模型 |
|---|---|---|---|
| PM2.5质量浓度/ (μg•m−3) | 0.5 m (k=0) | | |
| 1.5 m (k=1) | |||
| 3.5 m (k=3) | |||
| 7.5 m (k=5) | |||
| 17.5 m (k=7) | |||
| 27.5 m (k=9) | |||
| 42.5 m (k=12) | |||
| 风速/ (m•s−1) | 0.5 m (k=0) | | |
| 1.5 m (k=1) | |||
| 3.5 m (k=3) | |||
| 7.5 m (k=5) | |||
| 17.5 m (k=7) | |||
| 27.5 m (k=9) | |||
| 42.5 m (k=12) |
| [1] |
ANNESI-MAESANO I, FORASTIERE F, BALMES J, et al., 2021. The clear and persistent impact of air pollution on chronic respiratory diseases: A call for interventions[J]. European Respiratory Journal, 57(3): 2002981.
DOI URL |
| [2] |
DUAN C E, LU W Z, ZHANG Y W, et al., 2018. A new urban canopy parameterization scheme for wind environment simulations[J]. Indoor and Built Environment, 27(3): 402-422.
DOI URL |
| [3] | GLENCROSS D A, HO T R, CAMIÑA N, et al., 2020. Air pollution and its effects on the immune system[J]. Free Radical Biology and Medicine: The Official Journal of the Oxygen Society, 151: 56-58. |
| [4] |
HAMANAKA R B, MUTLU G M, 2018. Particulate matter air pollution: effects on the cardiovascular system[J]. Frontiers in Endocrinology, 9(16): 680.
DOI URL |
| [5] |
KIM H, KIM W H, KIM Y Y, et al., 2020. Air pollution and central nervous system disease: A review of the impact of fine particulate matter on neurological disorders[J]. Frontiers in Public Health, 8:575330.
DOI URL |
| [6] | LEE J S, KIM J T, LEE M G, 2013. Mitigation of urban heat island effect and greenroofs[J]. Indoor & Built Environment, 23(1): 62-69. |
| [7] | SZYSZKOWICZ M, SCHOEN S, ANGELIS N D, 2021. Air pollution and emergency department visits for disease of the genitourinary system[J]. Environmental Health Insights, 15: 11786302211025360. |
| [8] | United Nations, 2019. World Urbanization Prospects: The 2018 Revision[EB/OL]. (2019-08-30) [2019-08-30].https://population.un.org/wup/. |
| [9] |
VARDOULAKIS S, FISHER B E A, PERICLEOUS K, et al., 2003. Modelling air quality in street canyons: A review[J]. Atmospheric Environ, 37(2): 155-182.
DOI URL |
| [10] |
WANG L, TIAN W X, ZHAO X Y, et al., 2022. Numerical simulation of the effects of canopy properties on airflow and pollutant dispersion in street canyons[J]. Indoor and Built Environment, 31(2): 466-478.
DOI URL |
| [11] | WANG Q, WANG Y, ZHAO J Y, et al., 2015. Diffusion factors of street canyon pollutants in the cold winter of Xi’an city based on back propagation neural network analysis[J]. Indoor & Built Environment, 24(8): 91-114. |
| [12] |
WANG W, XIA S H, ZHU Z Y, et al., 2022. Spatiotemporal distribution of negative air ion and PM2.5 in urban residential areas[J]. Indoor and Built Environment, 31(4): 1127-1141.
DOI URL |
| [13] | XUE F, LI X F, 2017. The impact of roadside trees on traffic released PM10 in urban street canyon: Aerodynamic and deposition effects[J]. Sustain Cities & Society, 30: 195-204. |
| [14] |
ZHANG A Q, XIA C, LI W F, 2022. Exploring the effects of 3D urban form on urban air quality: Evidence from fifteen megacities in China[J]. Sustainable Cities and Society, 78: 103649.
DOI URL |
| [15] |
ZHANG Y W, GU Z L, LEE S C, et al., 2011. Numerical simulation and in situ investigation of fine particle dispersion in an actual deep street canyon in Hong Kong[J]. Indoor and Built Environment, 20(2): 206-216.
DOI URL |
| [16] |
ZHANG Y W, GU Z L, WANG Z S, et al., 2013. Advances in the fine scale simulation of urban wind environment[J]. Indoor and Built Environment, 22(1): 332-336.
DOI URL |
| [17] | ZHANG Y W, GU Z L, YU C, 2012. Time-series numerical simulation of wind flow within urban canopy layer and its integration effect for prediction of pollutant concentration variation[J]. Indoor & Built Environment, 21(3): 355-357. |
| [18] |
ZHANG X, ZHANG K, LIU H P, et al., 2020. Pollution sources of atmospheric fine particles and secondary aerosol characteristics in Beijing[J]. Journal of Environmental Sciences, 95(1): 91-98.
DOI URL |
| [19] |
ZHAO J J, DONG J K, ZHANG X H, et al., 2023. Field measurement of microclimate of sunken square and its effect on indoor environment of underground metro station in subtropical region[J]. Building and Environment, 228: 109873.
DOI URL |
| [20] | 戴菲, 陈明, 王敏, 等, 2020. 城市街区形态对PM10、PM2.5的影响研究——以武汉为例[J]. 中国园林, 36(3): 109-114. |
| DAI F, CHEN M, WANG M, et al., 2020. Effect of urban block form on reducing particulate matter: A case study of Wuhan[J]. Chinese Landscape Architecture 36( 3): 109-114. | |
| [21] | 狄育慧, 陶钰, 蒋婧, 等, 2021. 西安地区下沉式广场风环境的测试与分析[J]. 西安工程大学学报, 35(4): 50-54, 70. |
| DI Y H, TAO Y, JIANG J, et al., 2021. Test and analysis of wind environment of sunken square in Xi’an[J]. Journal of Xi’an Polytechnic University, 35(4): 50-54, 70. | |
| [22] | 丁一汇, 李巧萍, 柳艳菊, 等, 2009. 空气污染与气候变化[J]. 气象, 35(3): 3-14, 129. |
| DING Y H, LI Q P, LIU Y J, 2009. Atmospheric aerosols air pollution and climate change[J]. Meteorological Monthly, 35(3): 3-14, 129. | |
| [23] |
李月雯, 杨满场, 彭翀, 等, 2020. 面向健康微气候环境的城市设计导则优化策略[J]. 南方建筑 (4): 28-33.
DOI |
|
LI Y W, YANG M C, PENG C, et al., 2020. Optimisation strategy of urban design guidelines for a healthy microclimate environment[J]. South Architecture (4): 28-33.
DOI |
|
| [24] | 李绥, 石铁矛, 周诗文, 等, 2016. 城市三维格局影响下的污染气体扩散效应分析[J]. 沈阳建筑大学学报(自然科学版), 32(6):1111-1121. |
| LI S, SHI T M, ZHOU S W, et al., 2016. Diffusion effects of atmospheric pollutants on the three dimensional landscape pattern of urban block[J]. Journal of Shenyang Jianzhu University (Natural Science), 32(6): 1111-1121. | |
| [25] | 郭昊栩, 邓孟仁, 李颜, 2014. 下沉广场对地下商业空间通风性能的影响[J]. 华南理工大学学报(自然科学版), 42(6):114-120. |
| GUO H X, DENG M R, LI Y, 2014. Effect of sunken plaza on ventilation performance of underground commercial space[J]. Journal of South China University of Technology (Natural Science Edition), 42(6):114-120. | |
| [26] | 洪小春, 季翔, 肖鸿飞, 等, 2021. 不同空间尺度下城市下沉广场与周边环境的整合机制——以上海创智天地下沉广场为例[J]. 现代城市研究 (6): 52-59. |
| HONG X C, JI X, XIAO H F, et al., 2021. Integration mechanism of urban sunken square and surrounding environment under different spatial scales: A case study of Shanghai Chuangzhitiandi sunken square[J]. Modern Urban Research (6): 52-59. | |
| [27] | 回景淏, 王岩, 孙立新, 2022. 天津城市下沉广场冬季热环境研究[J]. 建筑科学, 38(12): 101-107, 224. |
| HUI J H, WANG Y, SUN L X, 2022. Study on thermal environment of Tianjin sunken plaza in winter[J]. Building Science, 38(12): 101-107, 224. | |
| [28] | 中华人民共和国生态环境部, 2018. 关于发布《环境空气质量标准》(GB 3095—2012)修改单的公告[N/OL]. (2021-06-04) [2021-06-04]. http://www.mee.gov.cn/gkml/sthjbgw/sthjbgg/201808/t20180815_451398.htm. |
| Ministry of Ecology and Environment of the People's Republic of China, 2018. Announcement on Issuing the Revision Sheet of Ambient Air Quality Standard (GB 3095—2012)[N/OL]. (2021-06-04) [2021-06-04]. http://www.mee.gov.cn/gkml/sthjbgw/sthjbgg/201808/t20180815_451398.htm. | |
| [29] | 中华人民共和国生态环境部, 2022. 中国移动源环境管理年报(2022)[N/OL]. (2022-12-07) [2022-12-07]. https://www.mee.gov.cn/ywdt/xwfb/202212/t20221207_1007157.shtml. |
| Ministry of Ecology and Environment of the People's Republic of China, 2022. Annual report on environmental management of mobile sources in China (2022)[N/OL]. (2022-12-07) [2022-12-07]. https://www.mee.gov.cn/ywdt/xwfb/202212/t20221207_1007157.shtml. | |
| [30] | 国家统计局, 2023. 王萍萍: 人口总量略有下降城镇化水平继续提高[N/OL]. (2023-01-18) [2023-01-18]. http://www.stats.gov.cn/sj/sjjd/202302/t20230202_1896742.html. |
| National Bureau of Statistics, 2023. Wang Pingping: Total population declines slightly, urbanization level continues to rise[N/OL]. (2023-01-18) [2023-01-18]. http://www.stats.gov.cn/sj/sjjd/202302/t20230202_1896742.html. | |
| [31] | 任蘇琪, 黄远东, 崔鹏义, 2021. 架空建筑街谷内流动与污染物扩散的数值模拟研究[J]. 上海理工大学学报, 43(4): 368-377. |
| REN S Q, HUANG Y D, CUI P Y, 2021. Numerical simulation studies on airflow and pollutant dispersion in street canyons with void decks[J]. University of Shanghai for Science and Technology, 43(4): 368-377. | |
| [32] |
王薇, 程歆玥, 胡春, 等, 2021. 城市街道峡谷PM2.5时空分布特征与空气质量评价——以合肥市长淮街道为例[J]. 生态环境学报, 30(11): 2157-2164.
DOI |
| WANG W, CHENG X Y, HU C, et al., 2021a. Spatio-temporal distribution characteristics of PM2.5 and air quality evaluation in urban street canyons: Take Changhuai street in Hefei as an example[J]. Ecology and Environmental Sciences, 30(11): 2157-2164. | |
| [33] | 吴凌云, 谢军飞, 张欣, 2021. 冬季采暖优化对北京地区空气质量的影响[J]. 气候与环境研究, 26(4): 391-402. |
| WU L Y, XIE J F, ZHANG X, 2021. Impacts of clean-energy heating transformation in winter on the air quality in Beijing[J]. Climatic and Environmental Research, 26(4): 391-402. | |
| [34] |
杨满场, 彭翀, 明廷臻, 2019. 应对机动车尾气污染的临街建筑控制策略研究——以武汉市中山大道街区为例[J]. 南方建筑 (2): 75-80.
DOI |
|
YANG M C, PENG C, MING Y Z, 2019. Study of the control strategy of building facades to vehicle exhaust pollution: A case study on Wuhan Zhongshan road block[J]. South Architecture (2): 75-80.
DOI |
|
| [35] | 赵晨曦, 王云琦, 王玉杰, 等, 2014. 北京地区冬春PM2.5和PM10污染水平时空分布及其与气象条件的关系[J]. 环境科学, 35(2): 418-427. |
| ZHAO C X, WANG Y Q, WANG Y J, et al., 2014. Temporal and spatial distribution of PM2.5 and PM10 pollution status and the correlation of particulate matters and meteorological factors during winter and spring in Beijing[J]. Environmental Science, 35(2): 418-427. | |
| [36] | 周姝雯, 唐荣莉, 张育新, 等, 2018. 街道峡谷绿化带设置对空气流场及污染分布的影响模拟研究[J]. 生态学报, 38(17): 6348-6357. |
| ZHOU S Q, TANG R L, ZHANG Y X, et al., 2018. Simulation study on the influence of green belt settings on air-flow and pollution distribution in street canyon[J]. Acta Ecologica Sinica, 38(17): 6348-6357. |
| [1] | WEN Lirong, LIN Boji, LI Tingting, ZHANG Ziyang, ZHANG Zhengen, JIANG Ming, ZHOU Yan, ZHANG Tao, LI Jun, ZHANG Gan. Source Apportionment of Ammonium in Atmospheric PM2.5 in the Pearl River Delta Based on Nitrogen Isotope [J]. Ecology and Environment, 2023, 32(9): 1654-1662. |
| [2] | ZHENG Qiuping, LI Fei, ZHAO Rui, JIANG Dongsheng, WANG Hong. Analysis of the Characteristics of PM2.5-O3 Compound Pollution and the Impact of Synoptic Weather Patterns in Fujian Province [J]. Ecology and Environment, 2023, 32(8): 1440-1448. |
| [3] | DONG Jiefang, DENG Chun, ZHANG Zhongwu. Spatio-temporal Evolution and Population Exposure Risk to PM2.5 in the Weihe River Basin [J]. Ecology and Environment, 2023, 32(6): 1078-1088. |
| [4] | LI Jianhui, DANG Zheng, CHEN Lin. Spatial-temporal Characteristics of PM2.5 and Its Influencing Factors in the Yellow River Jiziwan Metropolitan Area [J]. Ecology and Environment, 2023, 32(4): 697-705. |
| [5] | ZHANG Li, LI Cheng, TAN Haoze, WEI Jiayi, CHENG Jiong, PENG Guixiang. Reduction Effect and Influencing Factors of Typical Urban Woodlands on Atmospheric Particulate Matter in Guangzhou [J]. Ecology and Environment, 2023, 32(2): 341-350. |
| [6] | JIANG Ming, ZHANG Ziyang, LI Tingting, LIN Boji, ZHANG Zhengen, LIAO Tong, YUAN Luan, PAN Suhong, LI Jun, ZHANG Gan. Source Apportionment of Ammonium in Atmospheric PM2.5 in the Pearl River Delta Based on Nitrogen Isotope [J]. Ecology and Environment, 2022, 31(9): 1840-1848. |
| [7] | WEI Xiaofeng, HAN Hong, YAN Xuejun, WANG Zaifeng, LI Shengzeng, TIAN Yong, LIANG Di, MA Mingliang, ZHANG Guiqin. Source Apportionment of PM2.5 during Heavy Pollution Process in Ji'nan Based on Satellite Remote Sensing and CMB Model [J]. Ecology and Environment, 2022, 31(6): 1175-1183. |
| [8] | WANG Wei, CHENG Xinyue. Analysis of Temporal and Spatial Distribution Characteristics and Influencing Factors of PM2.5 and PM10 in Different Functional Street Canyons in Hefei City [J]. Ecology and Environment, 2022, 31(3): 524-534. |
| [9] | ZHAO Rui, ZHAN Liping, ZHOU Liang, ZHANG Junke. Identification of Driving Factors of PM2.5 Based on Geographic Detector Combined with Geographically Weighted Ridge Regression [J]. Ecology and Environment, 2022, 31(2): 307-317. |
| [10] | JIANG Bin, CHEN Duohong, ZHANG Tao, YUAN Luan, ZHOU Yan, SHEN Jing, ZHANG Chunlin, WANG Boguang. Characteristics and Sources of Carbonaceous Aerosols during the Crop Straw Burning Seasons in Southern China [J]. Ecology and Environment, 2022, 31(12): 2358-2366. |
| [11] | XING Ran, SHEN Guofeng, CHENG Hefa, TAO Shu. Changes of Residential Energy Structure and Regional Pollutant Emissions in Rural Areas of Northeast China [J]. Ecology and Environment, 2022, 31(12): 2367-2373. |
| [12] | LI Shengzeng, HAO Saimei, TAN Luyao, ZHANG Huaicheng, XU Biao, GU Shumao, PAN Guang, WANG Shuyan, YAN Huaizhong, ZHANG Guiqin. Characteristics of Spatiotemporal Variation, and Factors Influencing Secondary Components in PM2.5 in Ji'nan [J]. Ecology and Environment, 2022, 31(1): 100-109. |
| [13] | WANG Wei, CHENG Xinyue, HU Chun, XIA Sihan, WANG Tian. Spatio-temporal Distribution Characteristics of PM2.5 and Air Quality Evaluation in Urban Street Canyons: Take Changhuai Street in Hefei as An Example [J]. Ecology and Environment, 2021, 30(11): 2157-2164. |
| Viewed | ||||||
|
Full text |
|
|||||
|
Abstract |
|
|||||
Copyright © 2021 Editorial Office of ACTA PETROLEI SINICA
Address:No. 6 Liupukang Street, Xicheng District, Beijing, P.R.China, 510650
Tel: 86-010-62067128, 86-010-62067137, 86-010-62067139
Fax: 86-10-62067130
Email: syxb@cnpc.com.cn
Support byBeijing Magtech Co.ltd, E-mail:support@magtech.com.cn