Ecology and Environment ›› 2022, Vol. 31 ›› Issue (2): 307-317.DOI: 10.16258/j.cnki.1674-5906.2022.02.011
• Research Articles • Previous Articles Next Articles
ZHAO Rui1( ), ZHAN Liping1, ZHOU Liang2, ZHANG Junke1,*()
Received:2021-09-26
Online:2022-02-18
Published:2022-04-14
Contact:
ZHANG Junke
赵锐1(), 詹梨苹1, 周亮2, 张军科1,*()
通讯作者:
张军科
作者简介:赵锐(1983年生),男,教授,主要研究方向为环境政策与低碳可持续发展。E-mail: ruizhao@home.swjtu.edu.cn
基金资助:CLC Number:
ZHAO Rui, ZHAN Liping, ZHOU Liang, ZHANG Junke. Identification of Driving Factors of PM2.5 Based on Geographic Detector Combined with Geographically Weighted Ridge Regression[J]. Ecology and Environment, 2022, 31(2): 307-317.
赵锐, 詹梨苹, 周亮, 张军科. 地理探测联合地理加权岭回归的PM2.5驱动因素分析[J]. 生态环境学报, 2022, 31(2): 307-317.
Add to citation manager EndNote|Ris|BibTeX
URL: https://www.jeesci.com/EN/10.16258/j.cnki.1674-5906.2022.02.011
| 影响因素 Influence factors | 变量名称 Variables | 单位 Unit |
|---|---|---|
| 气象 Weather | 风速 | m∙s-1 |
| 降水率 | mm∙h-1 | |
| 气温 | ℃ | |
| 气压 | Pa | |
| 比湿度 | kg∙kg-1 | |
| 社会经济 Social economy | 地区生产总值 | 万元 |
| 年平均人口 | 万人 | |
| 工业企业数 | 个 | |
| 工业烟(粉)尘排放量 | t | |
| 公里客运量 | 万人 | |
| 公路货运量 | 万吨 | |
| 土地利用类型 Land use types | 城市建设用地面积 | km2 |
| 绿地面积 | hm2 |
Table 1 Selection of influencing factors
| 影响因素 Influence factors | 变量名称 Variables | 单位 Unit |
|---|---|---|
| 气象 Weather | 风速 | m∙s-1 |
| 降水率 | mm∙h-1 | |
| 气温 | ℃ | |
| 气压 | Pa | |
| 比湿度 | kg∙kg-1 | |
| 社会经济 Social economy | 地区生产总值 | 万元 |
| 年平均人口 | 万人 | |
| 工业企业数 | 个 | |
| 工业烟(粉)尘排放量 | t | |
| 公里客运量 | 万人 | |
| 公路货运量 | 万吨 | |
| 土地利用类型 Land use types | 城市建设用地面积 | km2 |
| 绿地面积 | hm2 |
| 变量 Variables | 最优分类组合 Best-classified combination | 变量 Variables | 最优分类组合 Best-classified combination |
|---|---|---|---|
| 风速 Wind speed | 13(EI) | 工业企业数 Number of industrial enterprise | 13(GI) |
| 降水率 Precipitation rate | 13(Q) | 工业烟(粉)尘 排放量 Amount of industrial mist and dust discharged | 11(GI) |
| 气温 Air temperature | 15(EI) | 公路客运量 Highway passenger carrying capacity | 12(GI) |
| 气压 Atmospheric pressure | 11(GI) | 公路货运量 Highway freight volume | 13(NB) |
| 比湿度 Specific humidity | 13(GI) | 城市建设用地面积 Area of urban construction land | 10(NB) |
| 地区生产总值 Regional GDP | 10(GI) | 绿地面积 Greenery area | 10(Q) |
| 年平均人口 Average annual population | 14(Q) | — | — |
Table 2 The optimal classification combination of factors
| 变量 Variables | 最优分类组合 Best-classified combination | 变量 Variables | 最优分类组合 Best-classified combination |
|---|---|---|---|
| 风速 Wind speed | 13(EI) | 工业企业数 Number of industrial enterprise | 13(GI) |
| 降水率 Precipitation rate | 13(Q) | 工业烟(粉)尘 排放量 Amount of industrial mist and dust discharged | 11(GI) |
| 气温 Air temperature | 15(EI) | 公路客运量 Highway passenger carrying capacity | 12(GI) |
| 气压 Atmospheric pressure | 11(GI) | 公路货运量 Highway freight volume | 13(NB) |
| 比湿度 Specific humidity | 13(GI) | 城市建设用地面积 Area of urban construction land | 10(NB) |
| 地区生产总值 Regional GDP | 10(GI) | 绿地面积 Greenery area | 10(Q) |
| 年平均人口 Average annual population | 14(Q) | — | — |
| 变量名称 Variables | 2015 | 2016 | 2017 | 2018 | ||||
|---|---|---|---|---|---|---|---|---|
| q | P | q | P | q | P | q | P | |
| 风速 Wind speed | 0.131 | 0.176 | 0.113 | 0.021 | 0.137 | 0.000 | 0.089 | 0.906 |
| 降水率 Precipitation rate | 0.078 | 0.050 | 0.123 | 0.093 | 0.132 | 0.000 | 0.139 | 0.034 |
| 气温 Air temperature | 0.421 | 0.000 | 0.365 | 0.000 | 0.287 | 0.000 | 0.248 | 0.000 |
| 气压 Atmospheric pressure | 0.152 | 0.000 | 0.149 | 0.008 | 0.165 | 0.000 | 0.165 | 0.000 |
| 比湿度 Specific humidity | 0.443 | 0.000 | 0.440 | 0.000 | 0.330 | 0.000 | 0.281 | 0.000 |
| 地区生产总值 Regional GDP | 0.159 | 0.000 | 0.164 | 0.000 | 0.175 | 0.000 | 0.159 | 0.000 |
| 年平均人口 Average annual population | 0.217 | 0.000 | 0.225 | 0.000 | 0.219 | 0.000 | 0.216 | 0.000 |
| 工业企业数Number of industrial enterprise | 0.286 | 0.000 | 0.257 | 0.000 | 0.264 | 0.000 | 0.236 | 0.000 |
| 工业烟(粉)尘排放量Amount of industrial mist and dust discharged | 0.170 | 0.240 | 0.124 | 0.000 | 0.070 | 0.987 | 0.060 | 0.134 |
| 公路客运量Highway passenger carrying capacity | 0.084 | 0.476 | 0.115 | 0.451 | 0.086 | 0.593 | 0.086 | 0.640 |
| 公路货运量 Highway freight volume | 0.143 | 0.054 | 0.180 | 0.004 | 0.178 | 0.000 | 0.197 | 0.000 |
| 城市建设用地面积 Area of urban construction land | 0.114 | 0.229 | 0.134 | 0.225 | 0.140 | 0.046 | 0.111 | 0.128 |
| 绿地面积 Greenery area | 0.133 | 0.000 | 0.127 | 0.113 | 0.120 | 0.179 | 0.090 | 0.002 |
Table 3 Geographical detection results of PM2.5
| 变量名称 Variables | 2015 | 2016 | 2017 | 2018 | ||||
|---|---|---|---|---|---|---|---|---|
| q | P | q | P | q | P | q | P | |
| 风速 Wind speed | 0.131 | 0.176 | 0.113 | 0.021 | 0.137 | 0.000 | 0.089 | 0.906 |
| 降水率 Precipitation rate | 0.078 | 0.050 | 0.123 | 0.093 | 0.132 | 0.000 | 0.139 | 0.034 |
| 气温 Air temperature | 0.421 | 0.000 | 0.365 | 0.000 | 0.287 | 0.000 | 0.248 | 0.000 |
| 气压 Atmospheric pressure | 0.152 | 0.000 | 0.149 | 0.008 | 0.165 | 0.000 | 0.165 | 0.000 |
| 比湿度 Specific humidity | 0.443 | 0.000 | 0.440 | 0.000 | 0.330 | 0.000 | 0.281 | 0.000 |
| 地区生产总值 Regional GDP | 0.159 | 0.000 | 0.164 | 0.000 | 0.175 | 0.000 | 0.159 | 0.000 |
| 年平均人口 Average annual population | 0.217 | 0.000 | 0.225 | 0.000 | 0.219 | 0.000 | 0.216 | 0.000 |
| 工业企业数Number of industrial enterprise | 0.286 | 0.000 | 0.257 | 0.000 | 0.264 | 0.000 | 0.236 | 0.000 |
| 工业烟(粉)尘排放量Amount of industrial mist and dust discharged | 0.170 | 0.240 | 0.124 | 0.000 | 0.070 | 0.987 | 0.060 | 0.134 |
| 公路客运量Highway passenger carrying capacity | 0.084 | 0.476 | 0.115 | 0.451 | 0.086 | 0.593 | 0.086 | 0.640 |
| 公路货运量 Highway freight volume | 0.143 | 0.054 | 0.180 | 0.004 | 0.178 | 0.000 | 0.197 | 0.000 |
| 城市建设用地面积 Area of urban construction land | 0.114 | 0.229 | 0.134 | 0.225 | 0.140 | 0.046 | 0.111 | 0.128 |
| 绿地面积 Greenery area | 0.133 | 0.000 | 0.127 | 0.113 | 0.120 | 0.179 | 0.090 | 0.002 |
| 年份 Years | 变量 Variables | R2 | AICc | ||||
|---|---|---|---|---|---|---|---|
| OLS | GWR | GWRR | OLS | GWR | GWRR | ||
| 2015 | 气温、气压、比湿度、地区生产总值、年平均人口、工业企业数、绿地面积 | 0.422 | 0.605 | 0.698 | 1498.309 | 1392.298 | 1317.533 |
| 2016 | 气温、比湿度、地区生产总值、年平均人口、 工业企业数、工业烟(粉)尘排放量 | 0.405 | 0.539 | 0.724 | 1449.089 | 1376.570 | 1234.400 |
| 2017 | 风速、降水率、气温、气压、比湿度、地区生产总值、 年平均人口、工业企业数、公路货运量 | 0.305 | 0.557 | 0.656 | 1451.439 | 1331.586 | 1256.107 |
| 2018 | 气温、气压、比湿度、地区生产总值、年平均人口、工业企业数、公路货运量 | 0.314 | 0.571 | 0.712 | 1354.153 | 1223.987 | 1110.740 |
Table 4 Model variables and performance evaluation indicators
| 年份 Years | 变量 Variables | R2 | AICc | ||||
|---|---|---|---|---|---|---|---|
| OLS | GWR | GWRR | OLS | GWR | GWRR | ||
| 2015 | 气温、气压、比湿度、地区生产总值、年平均人口、工业企业数、绿地面积 | 0.422 | 0.605 | 0.698 | 1498.309 | 1392.298 | 1317.533 |
| 2016 | 气温、比湿度、地区生产总值、年平均人口、 工业企业数、工业烟(粉)尘排放量 | 0.405 | 0.539 | 0.724 | 1449.089 | 1376.570 | 1234.400 |
| 2017 | 风速、降水率、气温、气压、比湿度、地区生产总值、 年平均人口、工业企业数、公路货运量 | 0.305 | 0.557 | 0.656 | 1451.439 | 1331.586 | 1256.107 |
| 2018 | 气温、气压、比湿度、地区生产总值、年平均人口、工业企业数、公路货运量 | 0.314 | 0.571 | 0.712 | 1354.153 | 1223.987 | 1110.740 |
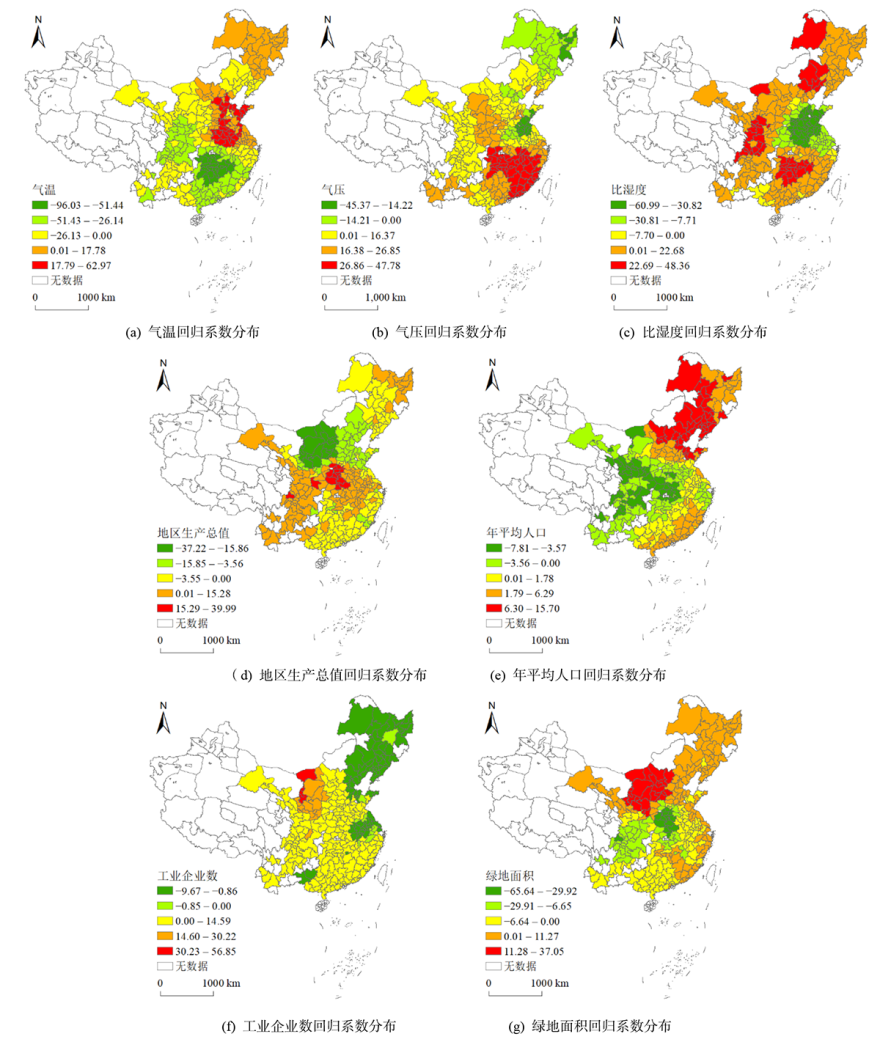
Figure 1 The spatial distribution of regression coefficients of the key drivers in 2015
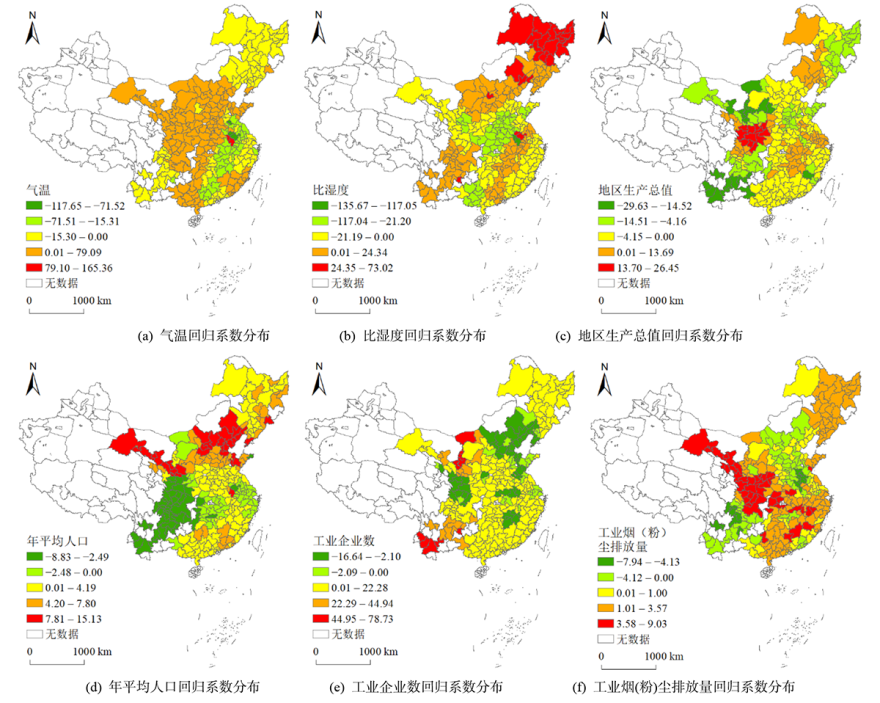
Figure 2 The spatial distribution of regression coefficients of the key drivers in 2016
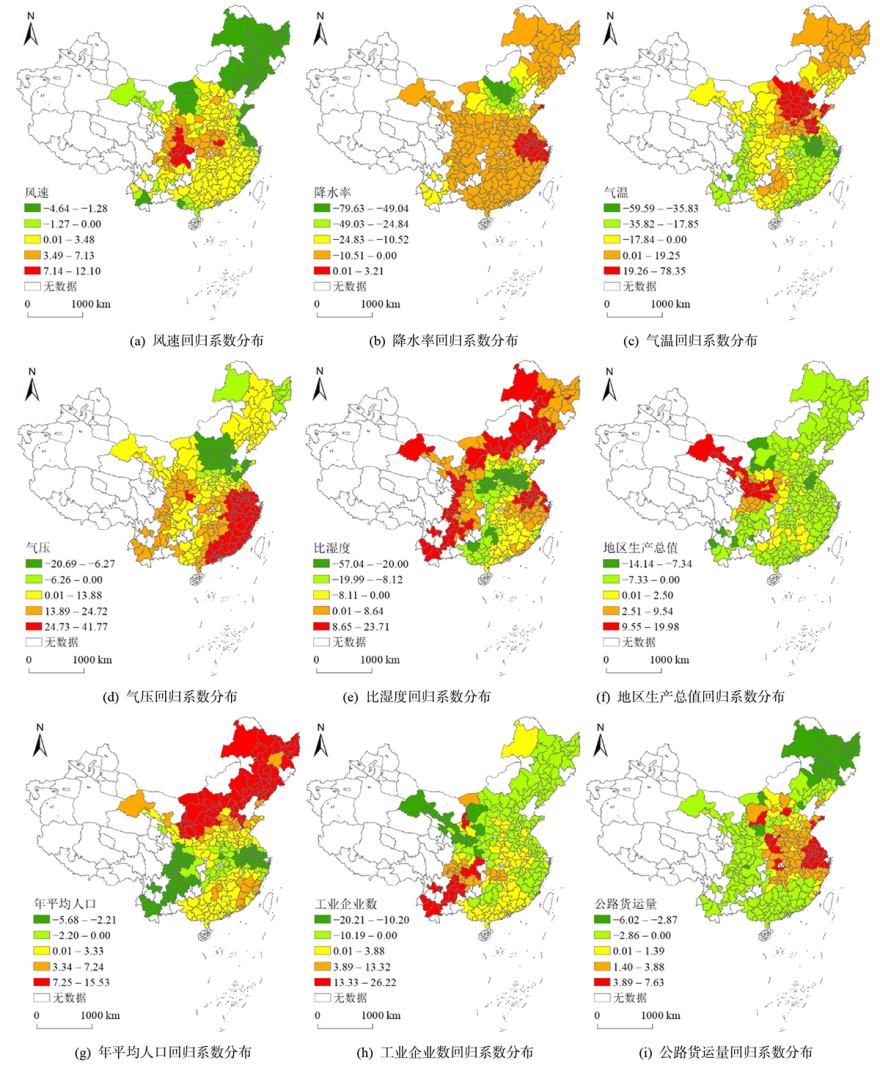
Figure 3 The spatial distribution of regression coefficients of the key drivers in 2017
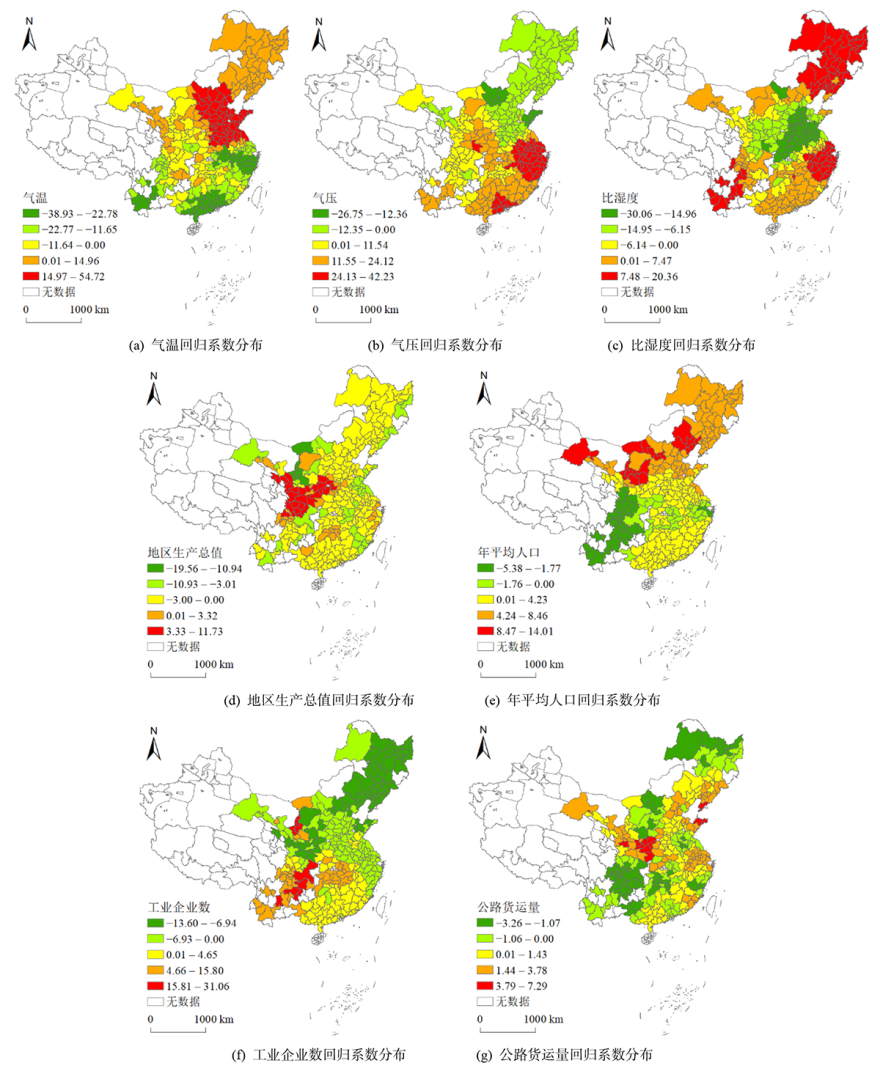
Figure 4 The spatial distribution of regression coefficients of the key drivers in 2018
| [1] |
BRUNSDON C, FOTHERINGHAM A S, CHARLTON M E, 1996. Geographically weighted regression: a method for exploring spatial nonstationarity[J]. Geographical Analysis, 28(4): 281-298
DOI URL |
| [2] | CAO F, GE Y, WANG J F, 2013. Optimal discretization for geographical detectors-based risk assessment[J]. GIScience & Remote Sensing, 50(1): 78-92. |
| [3] |
CHANG X, WANG S, ZHAO B, et al., 2019. Contributions of inter-city and regional transport to PM2.5 concentrations in the Beijing-Tianjin-Hebei region and its implications on regional joint air pollution control[J]. Science of the Total Environment, 660: 1191-1200.
DOI URL |
| [4] |
CHEN H, LI L, LEI Y L, et al., 2020. Public health effect and its economics loss of PM2.5 pollution from coal consumption in China[J]. Science of the Total Environment, DOI: 10.1016/j.scitotenv.2020.138973.
DOI |
| [5] |
CHEN J D, WANG B, HUANG S, et al., 2020. The influence of increased population density in China on air pollution[J]. Science of the Total Environment, DOI: 10.1016/j.scitotenv.2020.139456.
DOI |
| [6] |
CHENG N L, CHENG B F, LI S S, et al., 2019. Effects of meteorology and emission reduction measures on air pollution in Beijing during heating seasons[J]. Atmospheric Pollution Research, 10(3): 971-979.
DOI URL |
| [7] |
DING Y T, ZHANG M, QIAN X Y, et al., 2019. Using the geographical detector technique to explore the impact of socioeconomic factors on PM2.5 concentrations in China[J]. Journal of Cleaner Production, 211: 1480-1490.
DOI URL |
| [8] |
HAJILOO F, HAMZEH S, GHEYSARI M, 2019. Impact assessment of meteorological and environmental parameters on PM2.5 concentrations using remote sensing data and GWR analysis (case study of Tehran)[J]. Environmental Science and Pollution Research, 26(24): 24331-24345.
DOI URL |
| [9] |
LU D B, XU J H, YUE W Z, et al., 2020. Response of PM2.5 pollution to land use in China[J]. Journal of Cleaner Production, DOI: 10.1016/j.jclepro.2019.118741.
DOI |
| [10] |
LOU C R, LIU H Y, LI Y F, et al., 2016. Socioeconomic drivers of PM2.5 in the accumulation phase of air pollution episodes in the Yangtze River Delta of China[J]. International Journal of Environmental Research and Public Health, 13(10): 928.
DOI URL |
| [11] |
LUO W, JASIEWICZ J, STEPINSKI T, et al., 2016. Spatial association between dissection density and environmental factors over the entire conterminous United States[J]. Geophysical Research Letters, 43(2): 692-700.
DOI URL |
| [12] | MA Z Y, XIAO H W, 2017. Study on the spatial differentiation of influencing factors of PM2.5 in China: empirical analysis based on geographic weighted regression model[J]. Journal of Shanxi Finance, EC: 14-21. |
| [13] |
SONG C B, HE J J, WU L, et al., 2017. Health burden attributable to ambient PM2.5 in China[J]. Environmental Pollution, 223: 575-586.
DOI URL |
| [14] | WANG J F, HU Y, 2012. Environmental health risk detection with GeogDetector[J]. Environmental Modelling & Software, 33: 114-115. |
| [15] |
WANG J F, LI X H, CHRISTAKOS G, et al., 2010. Geographical detectors‐based health risk assessment and its application in the neural tube defects study of the Heshun Region, China[J]. International Journal of Geographical Information Science, 24(1): 107-127.
DOI URL |
| [16] |
WANG J Y, WANG S J, LI S J, 2019. Examining the spatially varying effects of factors on PM2.5 concentrations in Chinese cities using geographically weighted regression modeling[J]. Environmental Pollution, 248: 792-803.
DOI URL |
| [17] |
WANG S J, LIU X P, YANG X, et al., 2018. Spatial variations of PM2.5 in Chinese cities for the joint impacts of human activities and natural conditions: A global and local regression perspective[J]. Journal of Cleaner Production, 203: 143-152.
DOI URL |
| [18] | WHEELER D C, 2006. Diagnostic tools and remedial methods for collinearity in linear regression models with spatially varying coefficients[D]. Columbus: The Ohio State University. |
| [19] |
WU W Q, ZHANG M, DING Y T, 2020. Exploring the effect of economic and environment factors on PM2.5 concentration: a case study of the Beijing-Tianjin-Hebei region[J]. Journal of Environmental Management, DOI: 10.1016/j.jenvman.2020.110703.
DOI |
| [20] |
XU C, DONG L, YU C, et al., 2020. Can forest city construction affect urban air quality? The evidence from the Beijing-Tianjin-Hebei urban agglomeration of China[J]. Journal of Cleaner Production, DOI: 10.1016/j.jclepro.2020.121607.
DOI |
| [21] |
XU G Y, REN X D, XIONG K N, et al., 2020. Analysis of the driving factors of PM2.5 concentration in the air: A case study of the Yangtze River Delta, China[J]. Ecological Indicators, DOI: 10.1016/j.ecolind.2019.105889.
DOI |
| [22] |
ZHAO R, ZHAN L P, YAO M X, et al., 2020. A geographically weighted regression model augmented by Geodetector analysis and principal component analysis for the spatial distribution of PM2.5[J]. Sustainable Cities and Society, DOI: 10.1016/j.scs.2020.102106.
DOI |
| [23] |
ZHAO Z Q, GAO J B, WANG Y L, et al., 2015. Exploring spatially variable relationships between NDVI and climatic factors in a transition zone using geographically weighted regression[J]. Theoretical and Applied Climatology, 120(3): 507-519.
DOI URL |
| [24] |
ZHOU C S, CHEN J, WANG S J, 2018. Examining the effects of socioeconomic development on fine particulate matter (PM2.5) in China's cities using spatial regression and the geographical detector technique[J]. Science of the Total Environment, 619-620: 436-445.
DOI URL |
| [25] | 柏玲, 姜磊, 陈忠升, 2018. 长江中游城市群PM2.5时空特征及影响因素研究[J]. 长江流域资源与环境, 27(5): 960-968. |
| BAI L, JIANG L, CHEN Z S, 2018. Spatio-Temporal Characteristics of PM2.5 and Its Influencing Factors of the Urban Agglomeration in the Middle Reaches of the Yangtze Rive r[J]. Resources and Environment in the Yangtze Basin, 27(5): 960-968. | |
| [26] | 陈优良, 邹文敏, 2021. 2015-2019年长三角PM2.5时空变化特征及其影响因子分析[J/OL]. 安全与环境学报: 1-12[2021-08-11]. https://doi.org/10.13637/j.issn.1009-6094.2021 . |
| CHEN Y L, ZOU W M, 2021. Temporal-spatial characteristics of PM2.5 and impact factors analysis in Yangtze River Delta from 2015 to 2019[J/OL]. Journal of Safety and Environment: 1-12 [2021-08-11]. https://doi.org/10.13637/j.issn.1009-6094.2021 . | |
| [27] | 邓悦, 刘纪平, 刘洋, 等, 2018. 北京PM2.5浓度空间分布的贝叶斯地理加权回归模拟[J]. 测绘科学, 43(10): 39-45, 59. |
| DENG Y, LIU J P, LIU Y, et al., 2018. Spatial distribution estimation of PM2.5 concentration in Beijing by applying Bayesian geographic weighted regression model[J]. Science of Surveying and Mapping, 43(10): 39-45, 59. | |
| [28] | 段杰雄, 翟卫欣, 程承旗, 等, 2018. 中国PM2.5污染空间分布的社会经济影响因素分析[J]. 环境科学, 39(5): 2498-2504. |
| DUAN J X, ZHAI W X, CHENG C Q, et al., 2018. Socio-economic factors influencing the spatial distribution of PM2.5 concentrations in China: An exploratory analysis[J]. Environmental Science, 39(5): 2498-2504. | |
| [29] | 龚光彩, 江晨阳, 刘日明, 2018. 环境信息关联模型及植被对PM2.5浓度的影响研究[J]. 安全与环境学报, 18(3): 1184-1190. |
| GONG G C, JIANG C Y, LIU R M, 2018. An environmental information association model and influence of the vegetation on PM2.5 concentration[J]. Journal of Safety and Environment, 18(3): 1184-1190. | |
| [30] | 郭春月, 王文军, 胡泊, 等, 2016. 济宁市冬春季大气PM2.5与气象因素相关性研究[J]. 环境与健康杂志, 33(8): 715-718. |
| GUO C Y, WANG W J, HU B, et al., 2016. Correlation between PM2.5 and meteorological factors in Ji'ning in winter and spring[J]. Journal of Environment and Health, 33(8): 715-718. | |
| [31] | 汉瑞英, 陈健, 王彬, 2016. 利用LUR模型模拟杭州市PM2.5质量浓度空间分布[J]. 环境科学学报, 36(9): 3379-3385. |
| HAN R Y, CHEN J, WANG B, 2016. Application of LUR models for simulating the spatial distribution of PM2.5 concentration in Hangzhou, China[J]. Acta Scientiae Circumstantiae, 36(9): 3379-3385. | |
| [32] |
贺祥, 林振山, 刘会玉, 等, 2016. 基于灰色关联模型对江苏省PM2.5浓度影响因素的分析[J]. 地理学报, 71(7): 1119-1129.
DOI |
| HE X, LIN Z S, LIU H Y, et al., 2016. Analysis of the driving factors of PM2.5 in Jiangsu province based on grey correlation model[J]. Acta Geographica Sinica, 71(7): 1119-1129. | |
| [33] | 黄小刚, 邵天杰, 赵景波, 等, 2019. 汾渭平原PM2.5浓度的影响因素及空间溢出效应[J]. 中国环境科学, 39(8): 3539-3548. |
| HUANG X G, SHAO T J, ZHAO J B, et al., 2019. Influence factors and spillover effect of PM2.5 concentration on Fen-wei Plain[J]. China Environmental Science, 39(8): 3539-3548. | |
| [34] | 黄小刚, 赵景波, 曹军骥, 等, 2020. 长江经济带PM2.5分布格局演变及其影响因素[J]. 环境科学, 41(3): 1013-1024. |
| HUANG X G, ZHAO J B, CAO J J, et al., 2020. Evolution of the distribution of PM2.5 concentration in the Yangtze River Economic Belt and its influencing factors[J]. Environmental Science, 41(3): 1013-1024. | |
| [35] |
刘海猛, 方创琳, 黄解军, 等, 2018. 京津冀城市群大气污染的时空特征与影响因素解析[J]. 地理学报, 73(1): 177-191.
DOI |
| LIU H M, FANG C L, HUANG J J, et al., 2018. The spatial-temporal characteristics and influencing factors of air pollution in Beijing-Tianjin-Hebei urban agglomeration[J]. Acta Geographica Sinica, 73(1): 177-191. | |
| [36] | 马忠玉, 肖宏伟, 2017. 中国区域PM2.5影响因素空间分异研究--基于地理加权回归模型的实证分析[J]. 山西财经大学学报, 39(5): 14-26. |
| MA Z Y, XIAO H W, 2017. The research on a spatial differentiation of influence factors of regional PM2.5 in China: The empirical analysis based on geographically weighted regression model[J]. Journal of Shanxi University of Finance and Economics, 39(5): 14-26. | |
| [37] | 王佳佳, 夏晓圣, 程先富, 等, 2020. 合肥市PM2.5浓度时空分布特征及影响因素分析[J]. 长江流域资源与环境, 29(6): 1413-1421. |
| WANG J J, XIA X S, CHENG X F, et al., 2020. Temporal and spatial distribution characteristics and influencing factors of PM2.5 concentration in Hefei City[J]. Resources and Environment in the Yangtze Basin, 29(6): 1413-1421. | |
| [38] |
王劲峰, 徐成东, 2017. 地理探测器: 原理与展望[J]. 地理学报, 72(1): 116-134.
DOI |
| WANG J F, XU C D, 2017. Geodetector: Principle and prospective[J]. Acta Geographica Sinica, 72(1): 116-134. | |
| [39] |
王少剑, 高爽, 陈静. 基于GWR模型的中国城市雾霾污染影响因素的空间异质性研究[J]. 地理研究, 2020, 39(3): 651-668.
DOI |
| WANG S J, GAO S, CHEN J, 2020. Spatial heterogeneity of driving factors of urban haze pollution in China based on GWR model[J]. Geographical Research, 39(3): 651-668. | |
| [40] | 王祎頔, 王真祥, 2018. 上海市PM2.5浓度变化特征及其气象因子分析[J]. 干旱区地理, 41(5): 1088-1096. |
| WANG Y D, WANG Z X, 2018. Characteristics of PM2.5 concentration variability and its meteorological factors in Shanghai[J]. Arid Land Geography, 41(5): 1088-1096. | |
| [41] | 吴健生, 廖星, 彭建, 等, 2015. 重庆市PM2.5浓度空间分异模拟及影响因子[J]. 环境科学, 36(3): 759-767. |
| WU J S, LIAO X, PENG J, et al., 2015. Simulation and influencing factors of spatial distribution of PM2.5 concentrations in Chongqing[J]. Environmental Science, 36(3): 759-767. | |
| [42] | 吴浪, 周廷刚, 温莉, 等, 2018. 基于遥感数据的PM2.5与城市化的时空关系研究--以成渝城市群为例[J]. 长江流域资源与环境, 27(9): 2142-2152. |
| WU L, ZHOU T G, WEN L, et al., 2018. Study on Spatio-Temporal Relationship Between PM2.5 and Urbanization Based on Remote Sensing Data: A Case Study of Chengdu-Chongqing Urban Agglomeration[J]. Resources and Environment in the Yangtze Basin, 27(9): 2142-2152. | |
| [43] | 谢劭峰, 周志浩, 李国弘, 2020. 南宁市PM2.5浓度与气象因素的关系[J]. 科学技术与工程, 20(2): 460-466. |
| XIE S F, ZHOU Z H, LI G H, et al., 2020. Relationship between PM2.5 concentration and meteorological factors in Nanning[J]. Science Technology and Engineering, 20(2): 460-466. | |
| [44] | 杨兴川, 赵文吉, 熊秋林, 等, 2017. 2016年京津冀地区PM2.5时空分布特征及其与气象因素的关系[J]. 生态环境学报, 26(10): 1747-1754. |
| YANG X C, ZHAO W J, XIONG Q L, et al., 2017. Spatio-temporal distribution of PM2.5 in Beijing-Tianjin-Hebei (BTH) area in 2016 and its relationship with meteorological factors [J]. Ecology and Environmental Sciences, 26(10): 1747-1754. | |
| [45] | 姚青, 蔡子颖, 刘敬乐, 等, 2020. 气象条件对2009-2018年天津地区PM2.5质量浓度的影响[J]. 环境科学学报, 40(1): 65-75. |
| YAO Q, CAI Z Y, LIU J L, et al., 2020. Effects of meteorological conditions on PM2.5 concentration in Tianjin from 2009 to 2018 [J]. Acta Scientiae Circumstantiae, 40(1): 65-75. | |
| [46] | 姚荣鹏, 张勃, 王立兵, 等, 2021. 2015-2019年中东部地区PM2.5时空演变及其驱动力[J]. 生态学杂志, 40(3): 813-824. |
| YAO R P, ZHANG B, WANG L B, et al., 2021. Spatiotemporal variations of PM2.5 and driving factors over central and eastern China between 2015 and 2019[J]. Chinese Journal of Ecology, 40(3): 813-824. | |
| [47] |
周亮, 周成虎, 杨帆, 等, 2017. 2000-2011年中国PM2.5时空演化特征及驱动因素解析[J]. 地理学报, 72(11): 2079-2092.
DOI |
| ZHOU L, ZHOU C H, YANG F, et al., 2017. Spatio-temporal evolution and the influencing factors of PM2.5 in China between 2000 and 2011[J]. Acta Geographica Sinica, 72(11): 2079-2092. | |
| [48] | 周敏丹, 匡耀求, 云国梁, 2020. 基于地理探测器的广州市大气PM2.5浓度驱动因素分析[J]. 环境科学研究, 33(2): 271-279. |
| ZHOU M D, KUANG Y Q, YUN G L, 2020. Analysis of driving factors of atmospheric PM2.5 concentration in Guangzhou City based on Geo-Detector[J]. Research of Environmental Sciences, 33(2): 271-279. | |
| [49] | 张淑平, 韩立建, 周伟奇, 等, 2016. 城市规模对大气污染物NO2和PM2.5浓度的影响[J]. 生态学报, 36(16): 5049-5057. |
| ZHANG S P, HAN L J, ZHOU W Q, et al., 2016. Impact of urban population on concentrations of nitrogen dioxide (NO2) and fine particles (PM2.5) in China[J]. Acta Ecologica Sinica, 36(16): 5049-5057. | |
| [50] | 赵晨曦, 王云琦, 王玉杰, 等, 2014. 北京地区冬春PM2.5和PM10污染水平时空分布及其与气象条件的关系[J]. 环境科学, 35(2): 418-427. |
| ZHAO C X, WANG Y Q, WANG Y J, et al., 2014. Temporal and spatial distribution of PM2.5 and PM10 pollution status and the correlation of particulate matters and meteorological factors during winter and spring in Beijing[J]. Environmental Science, 35(2): 418-427. |
| [1] | DONG Jiefang, DENG Chun, ZHANG Zhongwu. Spatio-temporal Evolution and Population Exposure Risk to PM2.5 in the Weihe River Basin [J]. Ecology and Environment, 2023, 32(6): 1078-1088. |
| [2] | LI Jianhui, DANG Zheng, CHEN Lin. Spatial-temporal Characteristics of PM2.5 and Its Influencing Factors in the Yellow River Jiziwan Metropolitan Area [J]. Ecology and Environment, 2023, 32(4): 697-705. |
| [3] | ZHANG Li, LI Cheng, TAN Haoze, WEI Jiayi, CHENG Jiong, PENG Guixiang. Reduction Effect and Influencing Factors of Typical Urban Woodlands on Atmospheric Particulate Matter in Guangzhou [J]. Ecology and Environment, 2023, 32(2): 341-350. |
| [4] | LI Weiwen, HUANG Jinquan, QI Yujie, LIU Xiaolan, LIU Jigen, MAO Zhichao, GAO Xiufang. Meta-analysis of Soil Microbial Biomass Carbon Content and Its Influencing Factors under Soil Erosion [J]. Ecology and Environment, 2023, 32(1): 47-55. |
| [5] | JIANG Ming, ZHANG Ziyang, LI Tingting, LIN Boji, ZHANG Zhengen, LIAO Tong, YUAN Luan, PAN Suhong, LI Jun, ZHANG Gan. Source Apportionment of Ammonium in Atmospheric PM2.5 in the Pearl River Delta Based on Nitrogen Isotope [J]. Ecology and Environment, 2022, 31(9): 1840-1848. |
| [6] | CHEN Wenyu, XIA Lihua, XU Guoliang, YU Shiqin, CHEN Hang, CHEN Jinfeng. Dynamic Variation of NDVI and Its Influencing Factors in the Pearl River Basin from 2000 to 2020 [J]. Ecology and Environment, 2022, 31(7): 1306-1316. |
| [7] | LI Menghua, HAN Yingjuan, ZHAO Hui, WANG Yunxia. Analysis on Spatial-temporal Variation Characteristics and Driving Factors of Fractional Vegetation Cover in Ningxia Based on Geographical Detector [J]. Ecology and Environment, 2022, 31(7): 1317-1325. |
| [8] | WEI Xiaofeng, HAN Hong, YAN Xuejun, WANG Zaifeng, LI Shengzeng, TIAN Yong, LIANG Di, MA Mingliang, ZHANG Guiqin. Source Apportionment of PM2.5 during Heavy Pollution Process in Ji'nan Based on Satellite Remote Sensing and CMB Model [J]. Ecology and Environment, 2022, 31(6): 1175-1183. |
| [9] | GAO Siqi, DONG Guotao, JIANG Xiaohui, NIE Tong, GUO Xinwei, DANG Suzhen, LI Xinyu, LI Haoyang. Analysis of Vegetation Coverage Changes and Natural Driving Forces of Spatial Distribution in the Source Region of the Yellow River [J]. Ecology and Environment, 2022, 31(3): 429-439. |
| [10] | WANG Wei, CHENG Xinyue. Analysis of Temporal and Spatial Distribution Characteristics and Influencing Factors of PM2.5 and PM10 in Different Functional Street Canyons in Hefei City [J]. Ecology and Environment, 2022, 31(3): 524-534. |
| [11] | JIANG Bin, CHEN Duohong, ZHANG Tao, YUAN Luan, ZHOU Yan, SHEN Jing, ZHANG Chunlin, WANG Boguang. Characteristics and Sources of Carbonaceous Aerosols during the Crop Straw Burning Seasons in Southern China [J]. Ecology and Environment, 2022, 31(12): 2358-2366. |
| [12] | XING Ran, SHEN Guofeng, CHENG Hefa, TAO Shu. Changes of Residential Energy Structure and Regional Pollutant Emissions in Rural Areas of Northeast China [J]. Ecology and Environment, 2022, 31(12): 2367-2373. |
| [13] | LI Shengzeng, HAO Saimei, TAN Luyao, ZHANG Huaicheng, XU Biao, GU Shumao, PAN Guang, WANG Shuyan, YAN Huaizhong, ZHANG Guiqin. Characteristics of Spatiotemporal Variation, and Factors Influencing Secondary Components in PM2.5 in Ji'nan [J]. Ecology and Environment, 2022, 31(1): 100-109. |
| [14] | WANG Wei, CHENG Xinyue, HU Chun, XIA Sihan, WANG Tian. Spatio-temporal Distribution Characteristics of PM2.5 and Air Quality Evaluation in Urban Street Canyons: Take Changhuai Street in Hefei as An Example [J]. Ecology and Environment, 2021, 30(11): 2157-2164. |
| Viewed | ||||||
|
Full text |
|
|||||
|
Abstract |
|
|||||
Copyright © 2021 Editorial Office of ACTA PETROLEI SINICA
Address:No. 6 Liupukang Street, Xicheng District, Beijing, P.R.China, 510650
Tel: 86-010-62067128, 86-010-62067137, 86-010-62067139
Fax: 86-10-62067130
Email: syxb@cnpc.com.cn
Support byBeijing Magtech Co.ltd, E-mail:support@magtech.com.cn