生态环境学报 ›› 2024, Vol. 33 ›› Issue (2): 167-179.DOI: 10.16258/j.cnki.1674-5906.2024.02.001
• 研究论文【生态学】 •
下一篇
翟涌光1,*( ), 王晓妮1, 郝蕾2, 戚文超3, 王雅崧1, 耿佳玉1, 兰穹穹4, 王志国5
收稿日期:2023-10-20
出版日期:2024-02-18
发布日期:2024-04-03
通讯作者:
*作者简介:翟涌光(1986年生),男,副教授,博士,研究方向为遥感大数据处理和环境监测。E-mail: ychia@imau.edu.cn
基金资助:
ZHAI Yongguang1,*(), WANG Xiaoni1, HAO Lei2, QI Wenchao3, WANG Yasong1, GENG Jiayu1, LAN Qiongqiong4, WANG Zhiguo5
Received:2023-10-20
Online:2024-02-18
Published:2024-04-03
摘要:
掌握净生态系统生产力(NEP)时空格局对提高干旱/半干旱地区生态系统功能有重要意义。已有的NEP时空格局研究大多以年尺度开展分析,而NEP在多时间尺度上的特征差异尚不明晰。基于多源遥感、气象和地面实测数据,采用CASA模型、土壤呼吸地质统计模型(GSMSR)和土壤呼吸-土壤异养呼吸(Rs-Rh)关系模型耦合模拟内蒙古2001-2020年NEP,分析其年、季、月多时间尺度时空特征,并探讨8种不同植被NEP的多时间尺度特征差异。结果表明,1)内蒙古年尺度NEP的空间分布格局稳定,从东北向西南递减,这一格局与春夏秋3季及植被生长期的3-10月一致,而冬季植被进入休眠期使得空间差异显著减小。2)内蒙古多时间尺度NEP年际变化趋势有所不同:年尺度上,内蒙古总NEP呈波动上升趋势,年际变化率为C 3.75 Tg∙a−1;季尺度上,夏季增长趋势最大,占全年增长的41.6%,春秋两季对NEP的增长也起到至关重要的作用,分别占比34.9%和23.3%,冬季对NEP增长贡献非常有限;月尺度上,NEP年内变化与植被生长物候周期较为接近,1月和12月年际NEP为减少趋势,其余月份年际NEP均为上升趋势,其中9月增长趋势最大,占全年增长的19.3%。3)不同植被类型NEP年际趋势存在差异,5种植被类型年NEP呈增长趋势,3种呈下降趋势;草地在季尺度年际变化中均保持增长,在夏季最高,而灌木林在季尺度年际变化中均为降低趋势,夏季降幅最大;月尺度年际变化中灌木林均为降低趋势,1月降幅最大。该研究能够为明晰区域碳循环及改善生态系统功能提供科学依据。
中图分类号:
翟涌光, 王晓妮, 郝蕾, 戚文超, 王雅崧, 耿佳玉, 兰穹穹, 王志国. 2001-2020年内蒙古净生态系统生产力格局多时间尺度分析[J]. 生态环境学报, 2024, 33(2): 167-179.
ZHAI Yongguang, WANG Xiaoni, HAO Lei, QI Wenchao, WANG Yasong, GENG Jiayu, LAN Qiongqiong, WANG Zhiguo. Multi-time Scale Analysis of Net Ecosystem Productivity Pattern in Inner Mongolia from 2001 to 2020[J]. Ecology and Environment, 2024, 33(2): 167-179.

图1 研究区范围及土地覆盖类型 土地覆盖图来自MODIS MCD12Q1产品,2020年
Figure 1 Study area and its land cover
| 站点 名称 | 库布齐- 草地 | 库布齐- 林场 | 内蒙 | 科尔沁 | 锡林浩特 | 四子王 | 多伦- 耕地 | 多伦- 草地 | 锡林郭勒- 荒漠草原 | 锡林郭勒- 典型草原 | 东乌草原 |
|---|---|---|---|---|---|---|---|---|---|---|---|
| 纬度 | 40.38 | 40.54 | 44.53 | 43.29 | 43.55 | 41.79 | 42.05 | 42.05 | 44.09 | 44.13 | 45.56 |
| 经度 | 108.55 | 108.69 | 116.67 | 122.28 | 116.67 | 111.89 | 116.67 | 116.28 | 113.57 | 116.33 | 117.00 |
| 年份 | 2006 | 2006‒2010 | 2004‒2008 | 2011‒2012 | 2011‒2012 | 2010‒2011 | 2005‒2006 | 2005‒2006 | 2003‒2010 | 2003‒2010 | 2005‒2007 |
| 植被 | 干旱草地 | 林地 | 草地 | 草地 | 围封草地 | 干旱草地 (禁牧) | 耕地 | 耕地 | 荒漠草原 | 草地 | 典型草原 |
| 土壤 | 沙质土壤 | 沙质土壤 | 暗栗钙土 | 栗色土壤 | 栗钙土 | 淡栗钙土 | 栗色土壤 | 栗色土壤 | 棕色钙质土壤 | 栗色土壤 | 栗色土壤 |
表1 通量站点基本信息
Table 1 Flux sites basic information
| 站点 名称 | 库布齐- 草地 | 库布齐- 林场 | 内蒙 | 科尔沁 | 锡林浩特 | 四子王 | 多伦- 耕地 | 多伦- 草地 | 锡林郭勒- 荒漠草原 | 锡林郭勒- 典型草原 | 东乌草原 |
|---|---|---|---|---|---|---|---|---|---|---|---|
| 纬度 | 40.38 | 40.54 | 44.53 | 43.29 | 43.55 | 41.79 | 42.05 | 42.05 | 44.09 | 44.13 | 45.56 |
| 经度 | 108.55 | 108.69 | 116.67 | 122.28 | 116.67 | 111.89 | 116.67 | 116.28 | 113.57 | 116.33 | 117.00 |
| 年份 | 2006 | 2006‒2010 | 2004‒2008 | 2011‒2012 | 2011‒2012 | 2010‒2011 | 2005‒2006 | 2005‒2006 | 2003‒2010 | 2003‒2010 | 2005‒2007 |
| 植被 | 干旱草地 | 林地 | 草地 | 草地 | 围封草地 | 干旱草地 (禁牧) | 耕地 | 耕地 | 荒漠草原 | 草地 | 典型草原 |
| 土壤 | 沙质土壤 | 沙质土壤 | 暗栗钙土 | 栗色土壤 | 栗钙土 | 淡栗钙土 | 栗色土壤 | 栗色土壤 | 棕色钙质土壤 | 栗色土壤 | 栗色土壤 |
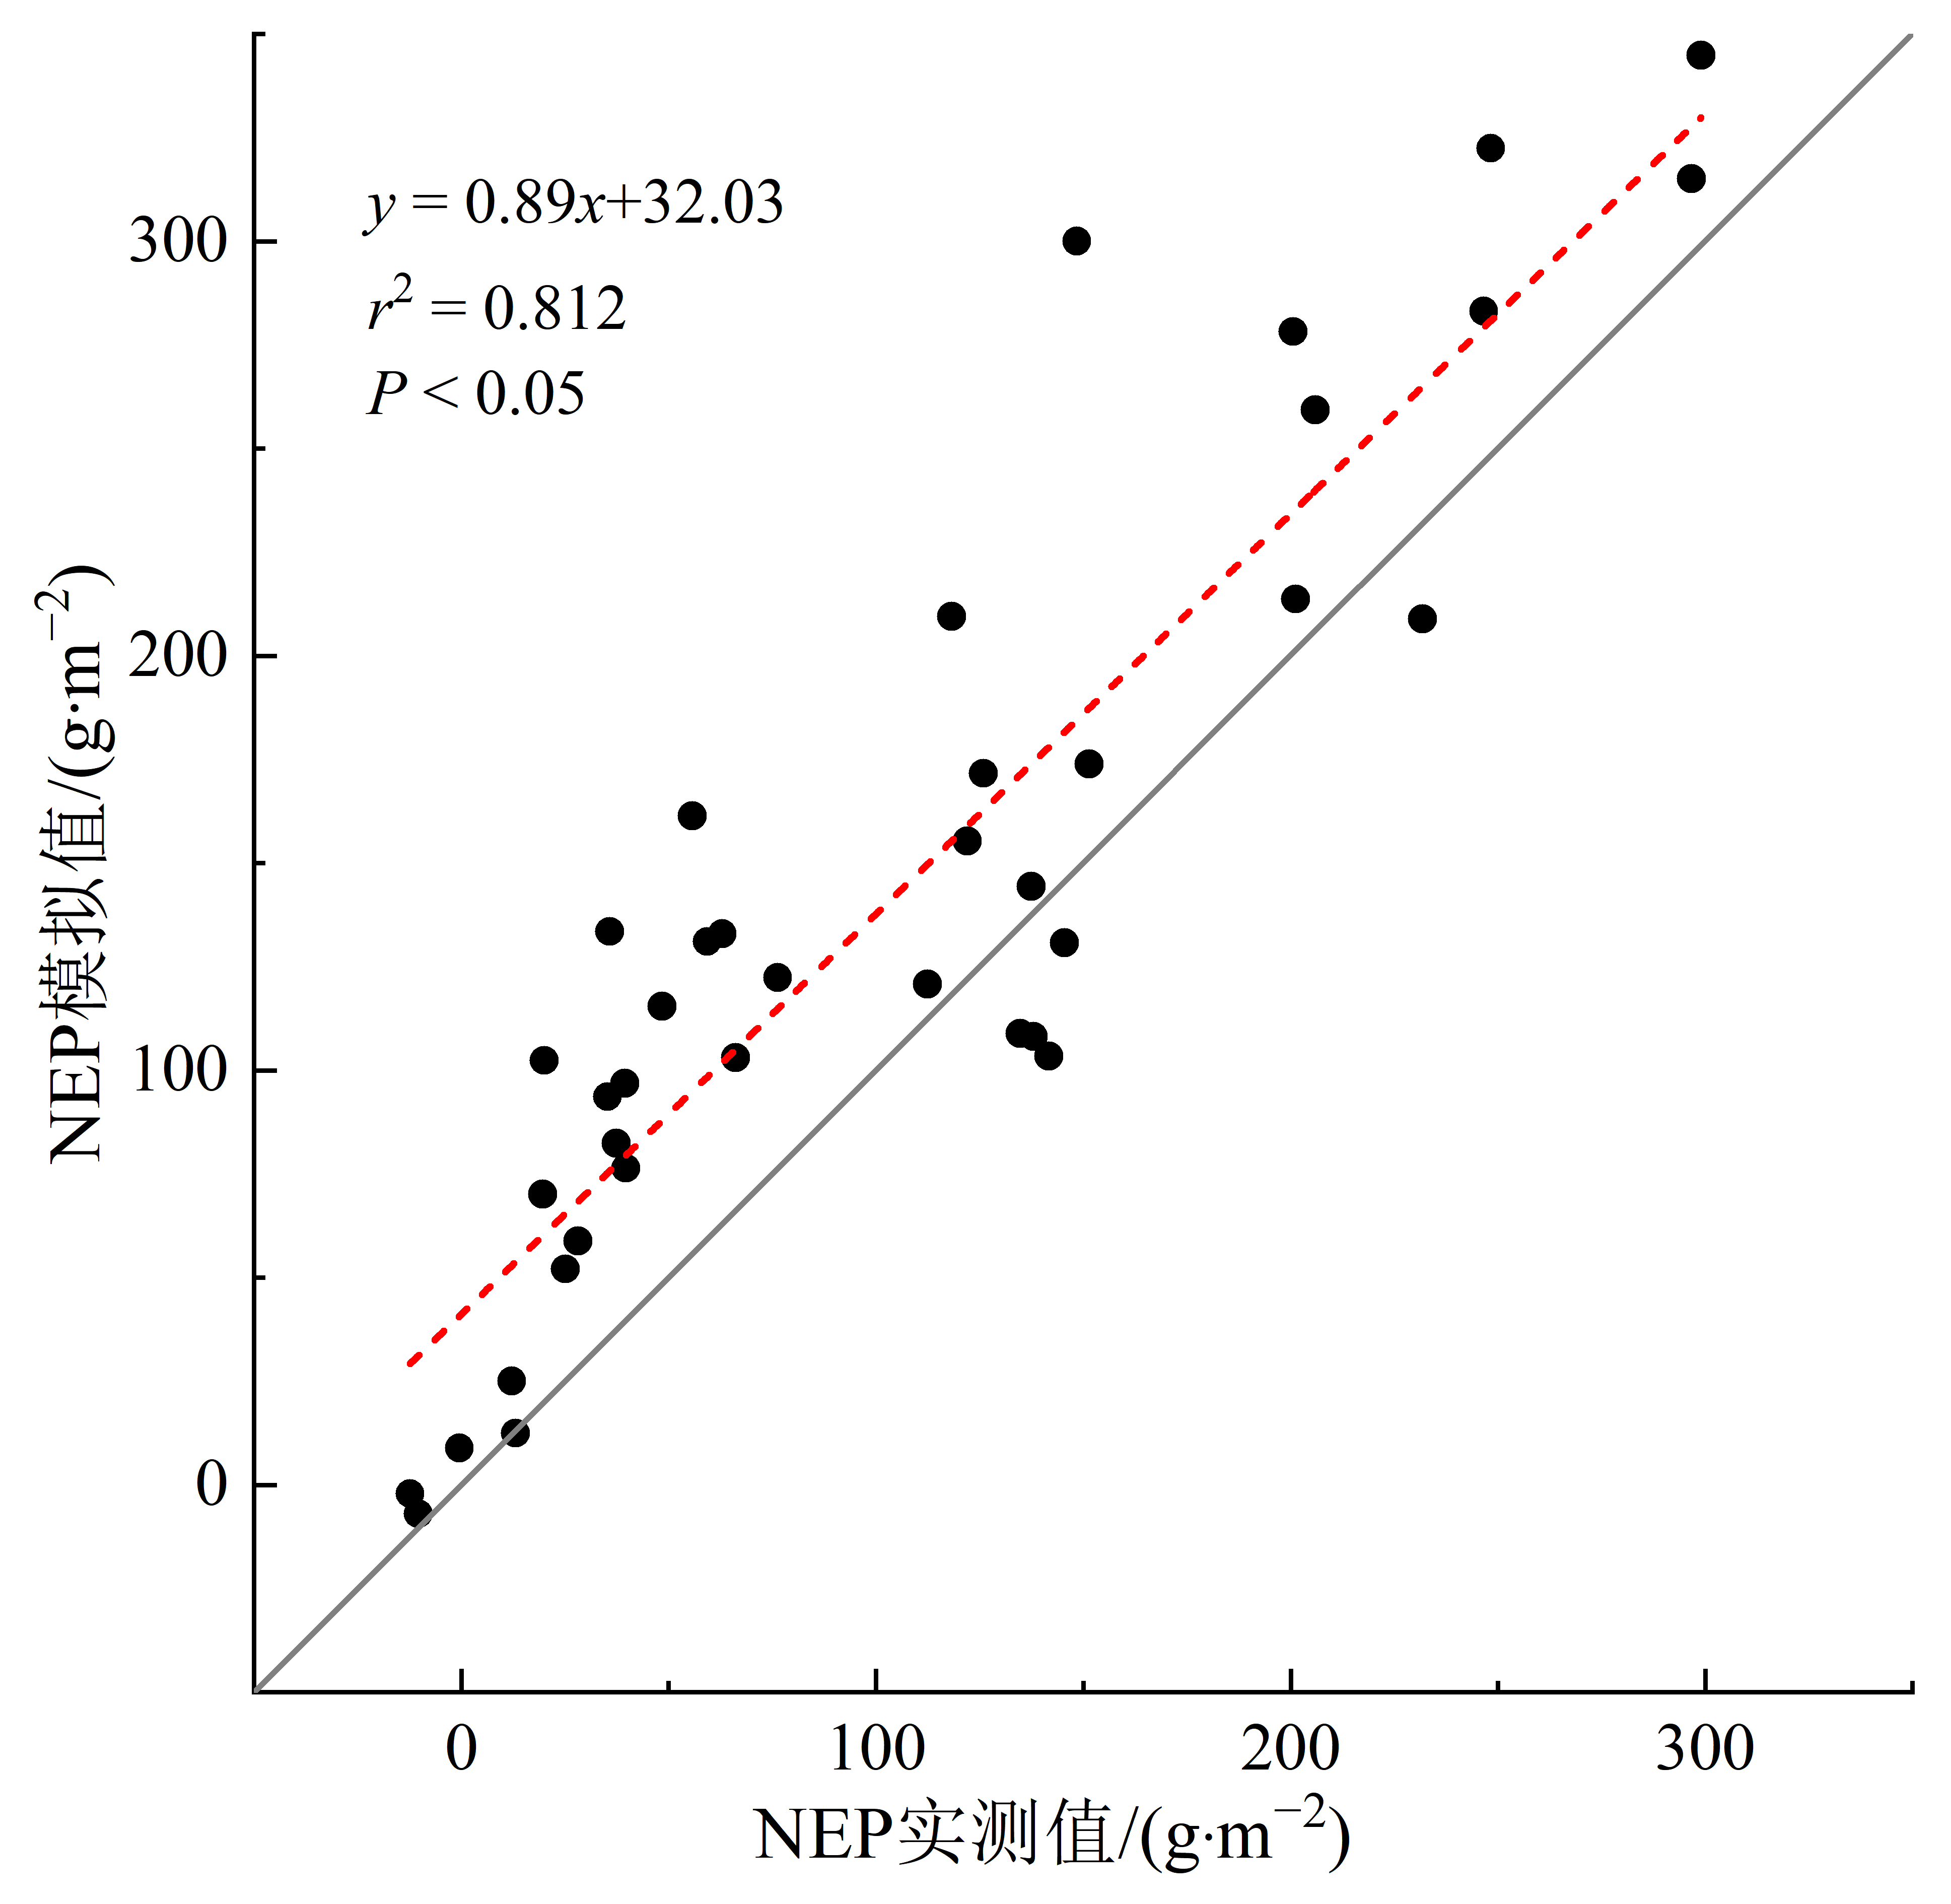
图2 内蒙古地区NEP模拟值与实测值相关性(y-模拟值、x-实测值)
Figure 2 Correlation between simulated and measured values of NEP in Inner Mongolia (y-simulated values, x-measured values)
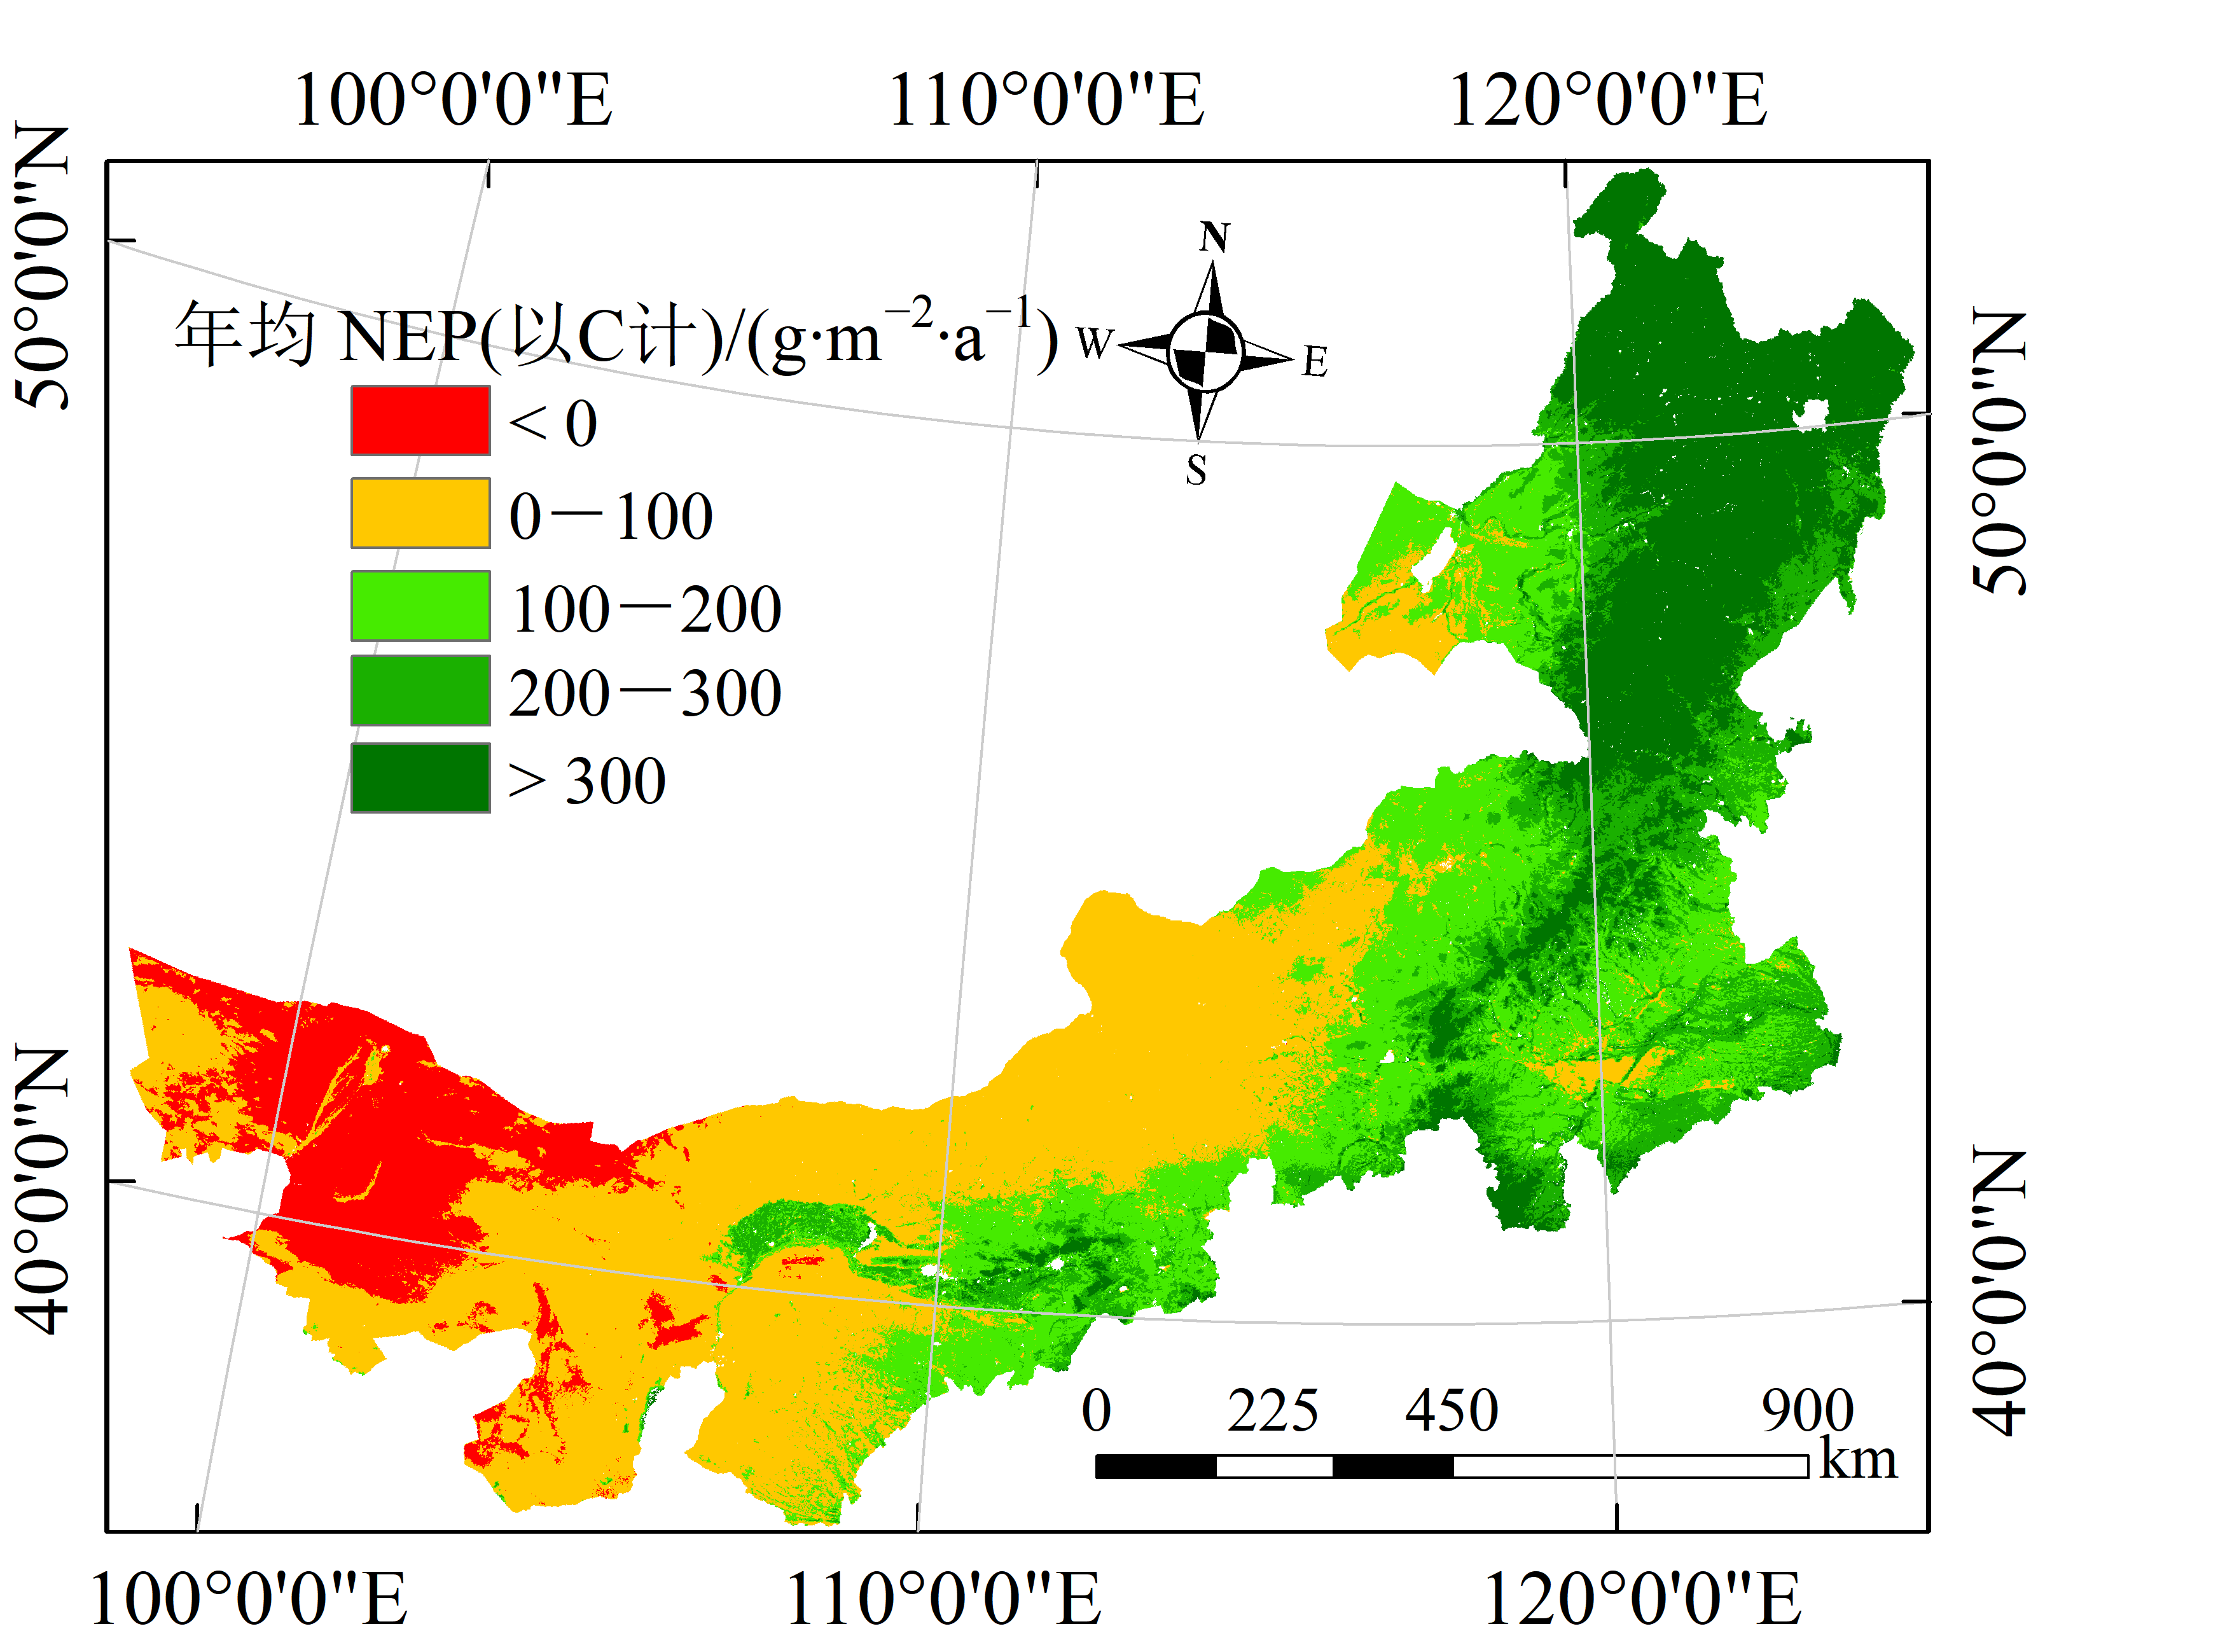
图3 2001-2020年内蒙古年均NEP空间分布
Figure 3 Spatial distribution of annual average NEP in Inner Mongolia from 2001 to 2020
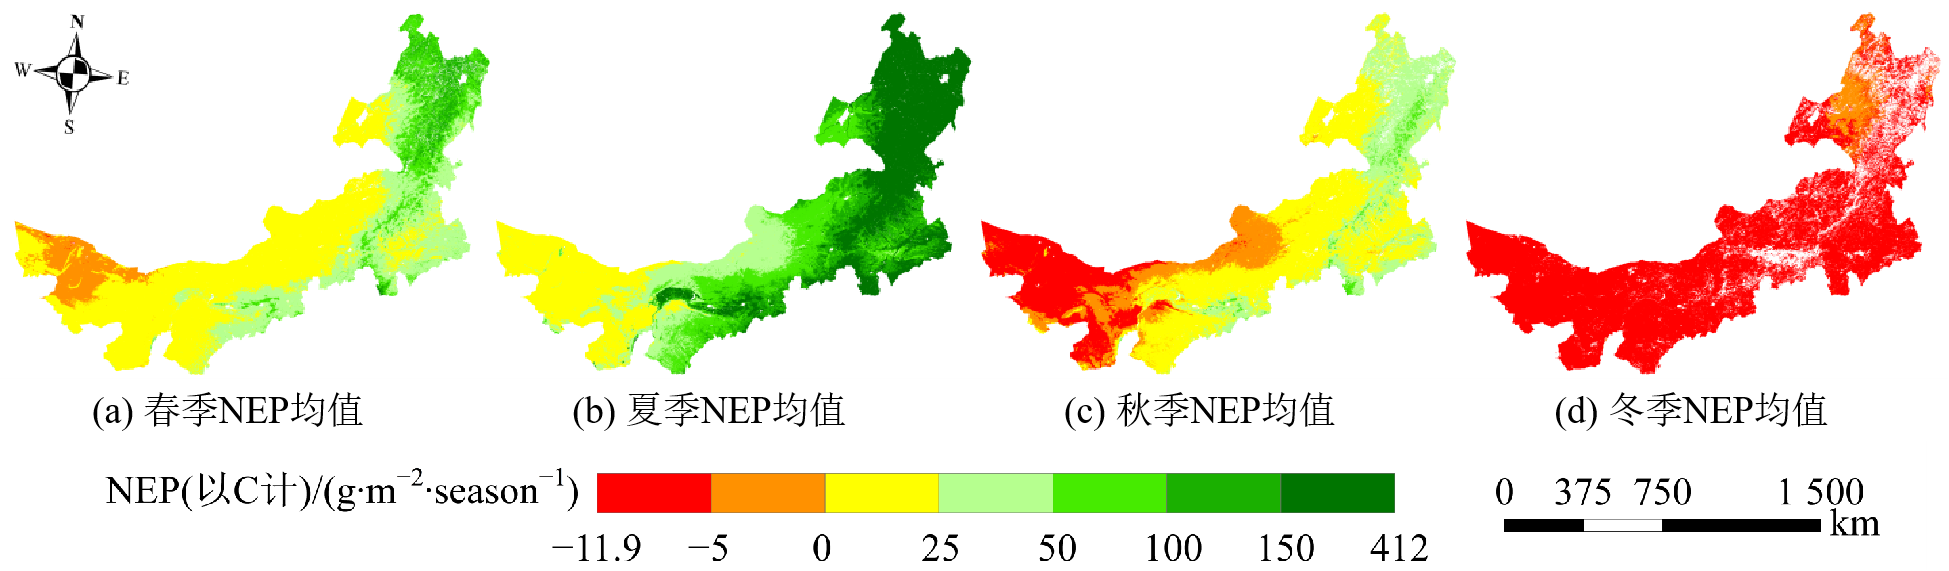
图4 2001-2020年内蒙古季均NEP空间分布格局
Figure 4 Spatial distribution of seasonal mean NEP in Inner Mongolia from 2001 to 2020

图5 2001-2020年内蒙古月均NEP空间分布格局
Figure 5 Spatial distribution of monthly average NEP in Inner Mongolia from 2001 to 2020
| NEP | 1月 | 2月 | 3月 | 4月 | 5月 | 6月 | 7月 | 8月 | 9月 | 10月 | 11月 | 12月 |
|---|---|---|---|---|---|---|---|---|---|---|---|---|
| NEP>0 | 0 | 0 | 71.7% | 91.5% | 100% | 100% | 100% | 100% | 90.8% | 59.4% | 0 | 0 |
| NEP<0 | 100% | 100% | 28.3% | 8.50% | 0 | 0 | 0 | 0 | 9.20% | 40.6% | 100% | 100% |
| 平均值(以C计)/(g∙m−2∙month−1) | −2.67 | −2.93 | −1.13 | 8.23 | 26.2 | 37.3 | 45.8 | 41.9 | 16.5 | −0.460 | −3.10 | −2.68 |
表2 2001-2020年内蒙古NEP月均值及面积占比
Table 2 Monthly mean values and the percentage of NEP in Inner Mongolia from 2001 to 2020
| NEP | 1月 | 2月 | 3月 | 4月 | 5月 | 6月 | 7月 | 8月 | 9月 | 10月 | 11月 | 12月 |
|---|---|---|---|---|---|---|---|---|---|---|---|---|
| NEP>0 | 0 | 0 | 71.7% | 91.5% | 100% | 100% | 100% | 100% | 90.8% | 59.4% | 0 | 0 |
| NEP<0 | 100% | 100% | 28.3% | 8.50% | 0 | 0 | 0 | 0 | 9.20% | 40.6% | 100% | 100% |
| 平均值(以C计)/(g∙m−2∙month−1) | −2.67 | −2.93 | −1.13 | 8.23 | 26.2 | 37.3 | 45.8 | 41.9 | 16.5 | −0.460 | −3.10 | −2.68 |
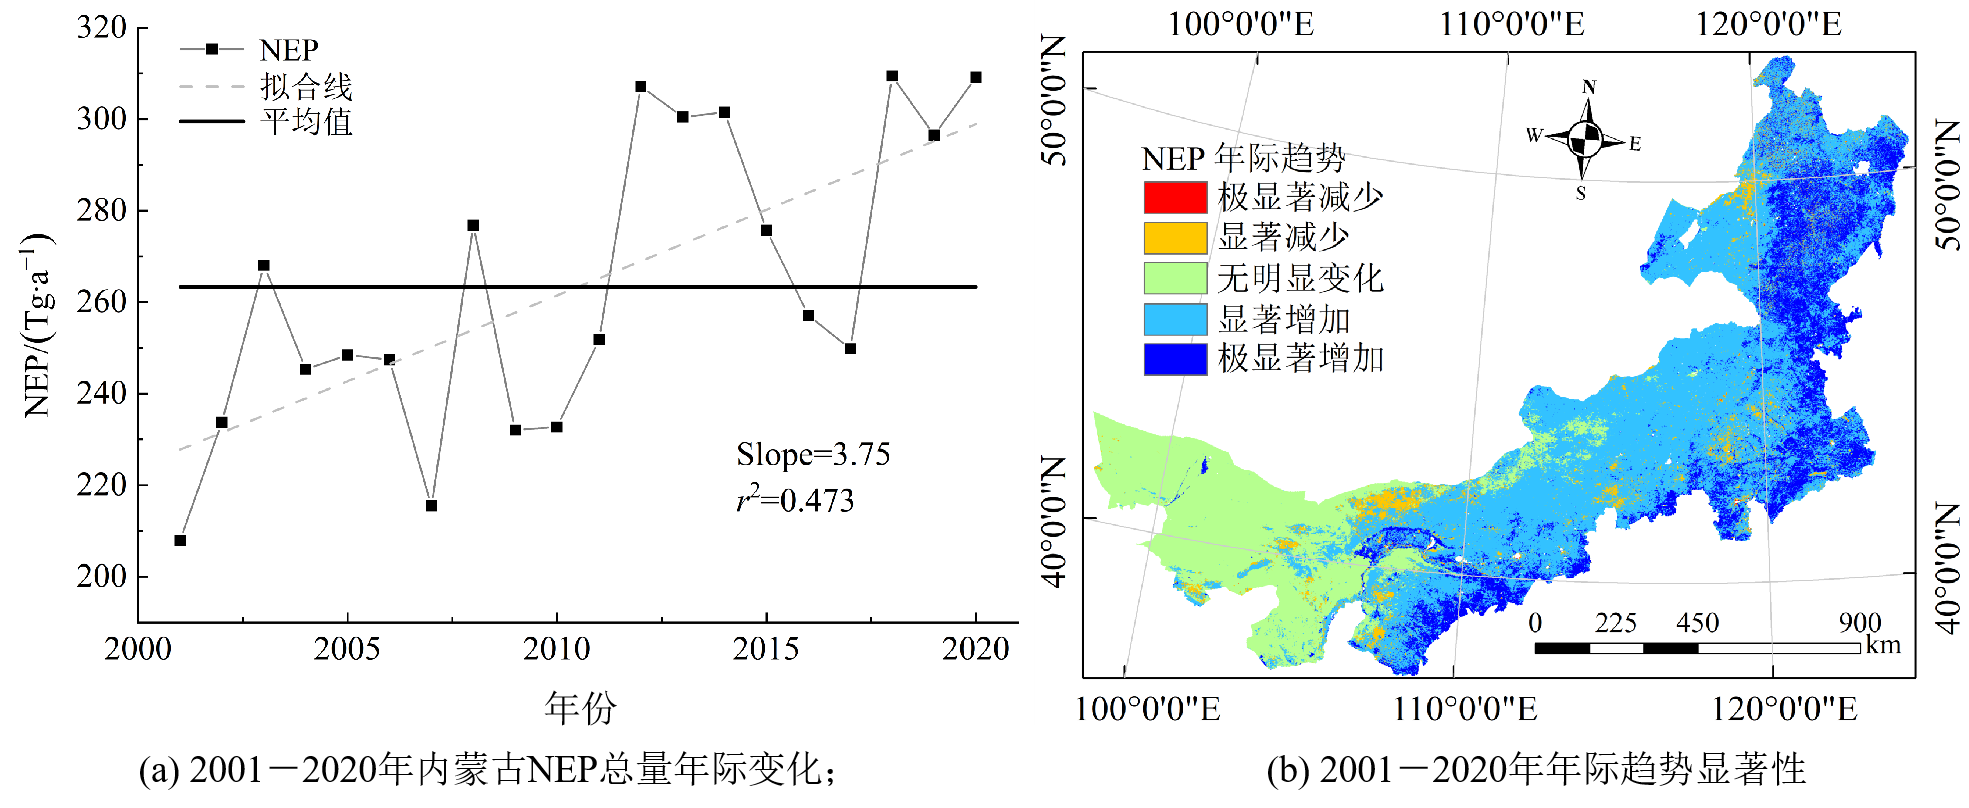
图6 2001―2020年内蒙古NEP年际变化及趋势显著性
Figure 6 The inter-annual change of NEP and the significance of inter annual change in Inner Mongolia from 2001 to 2020
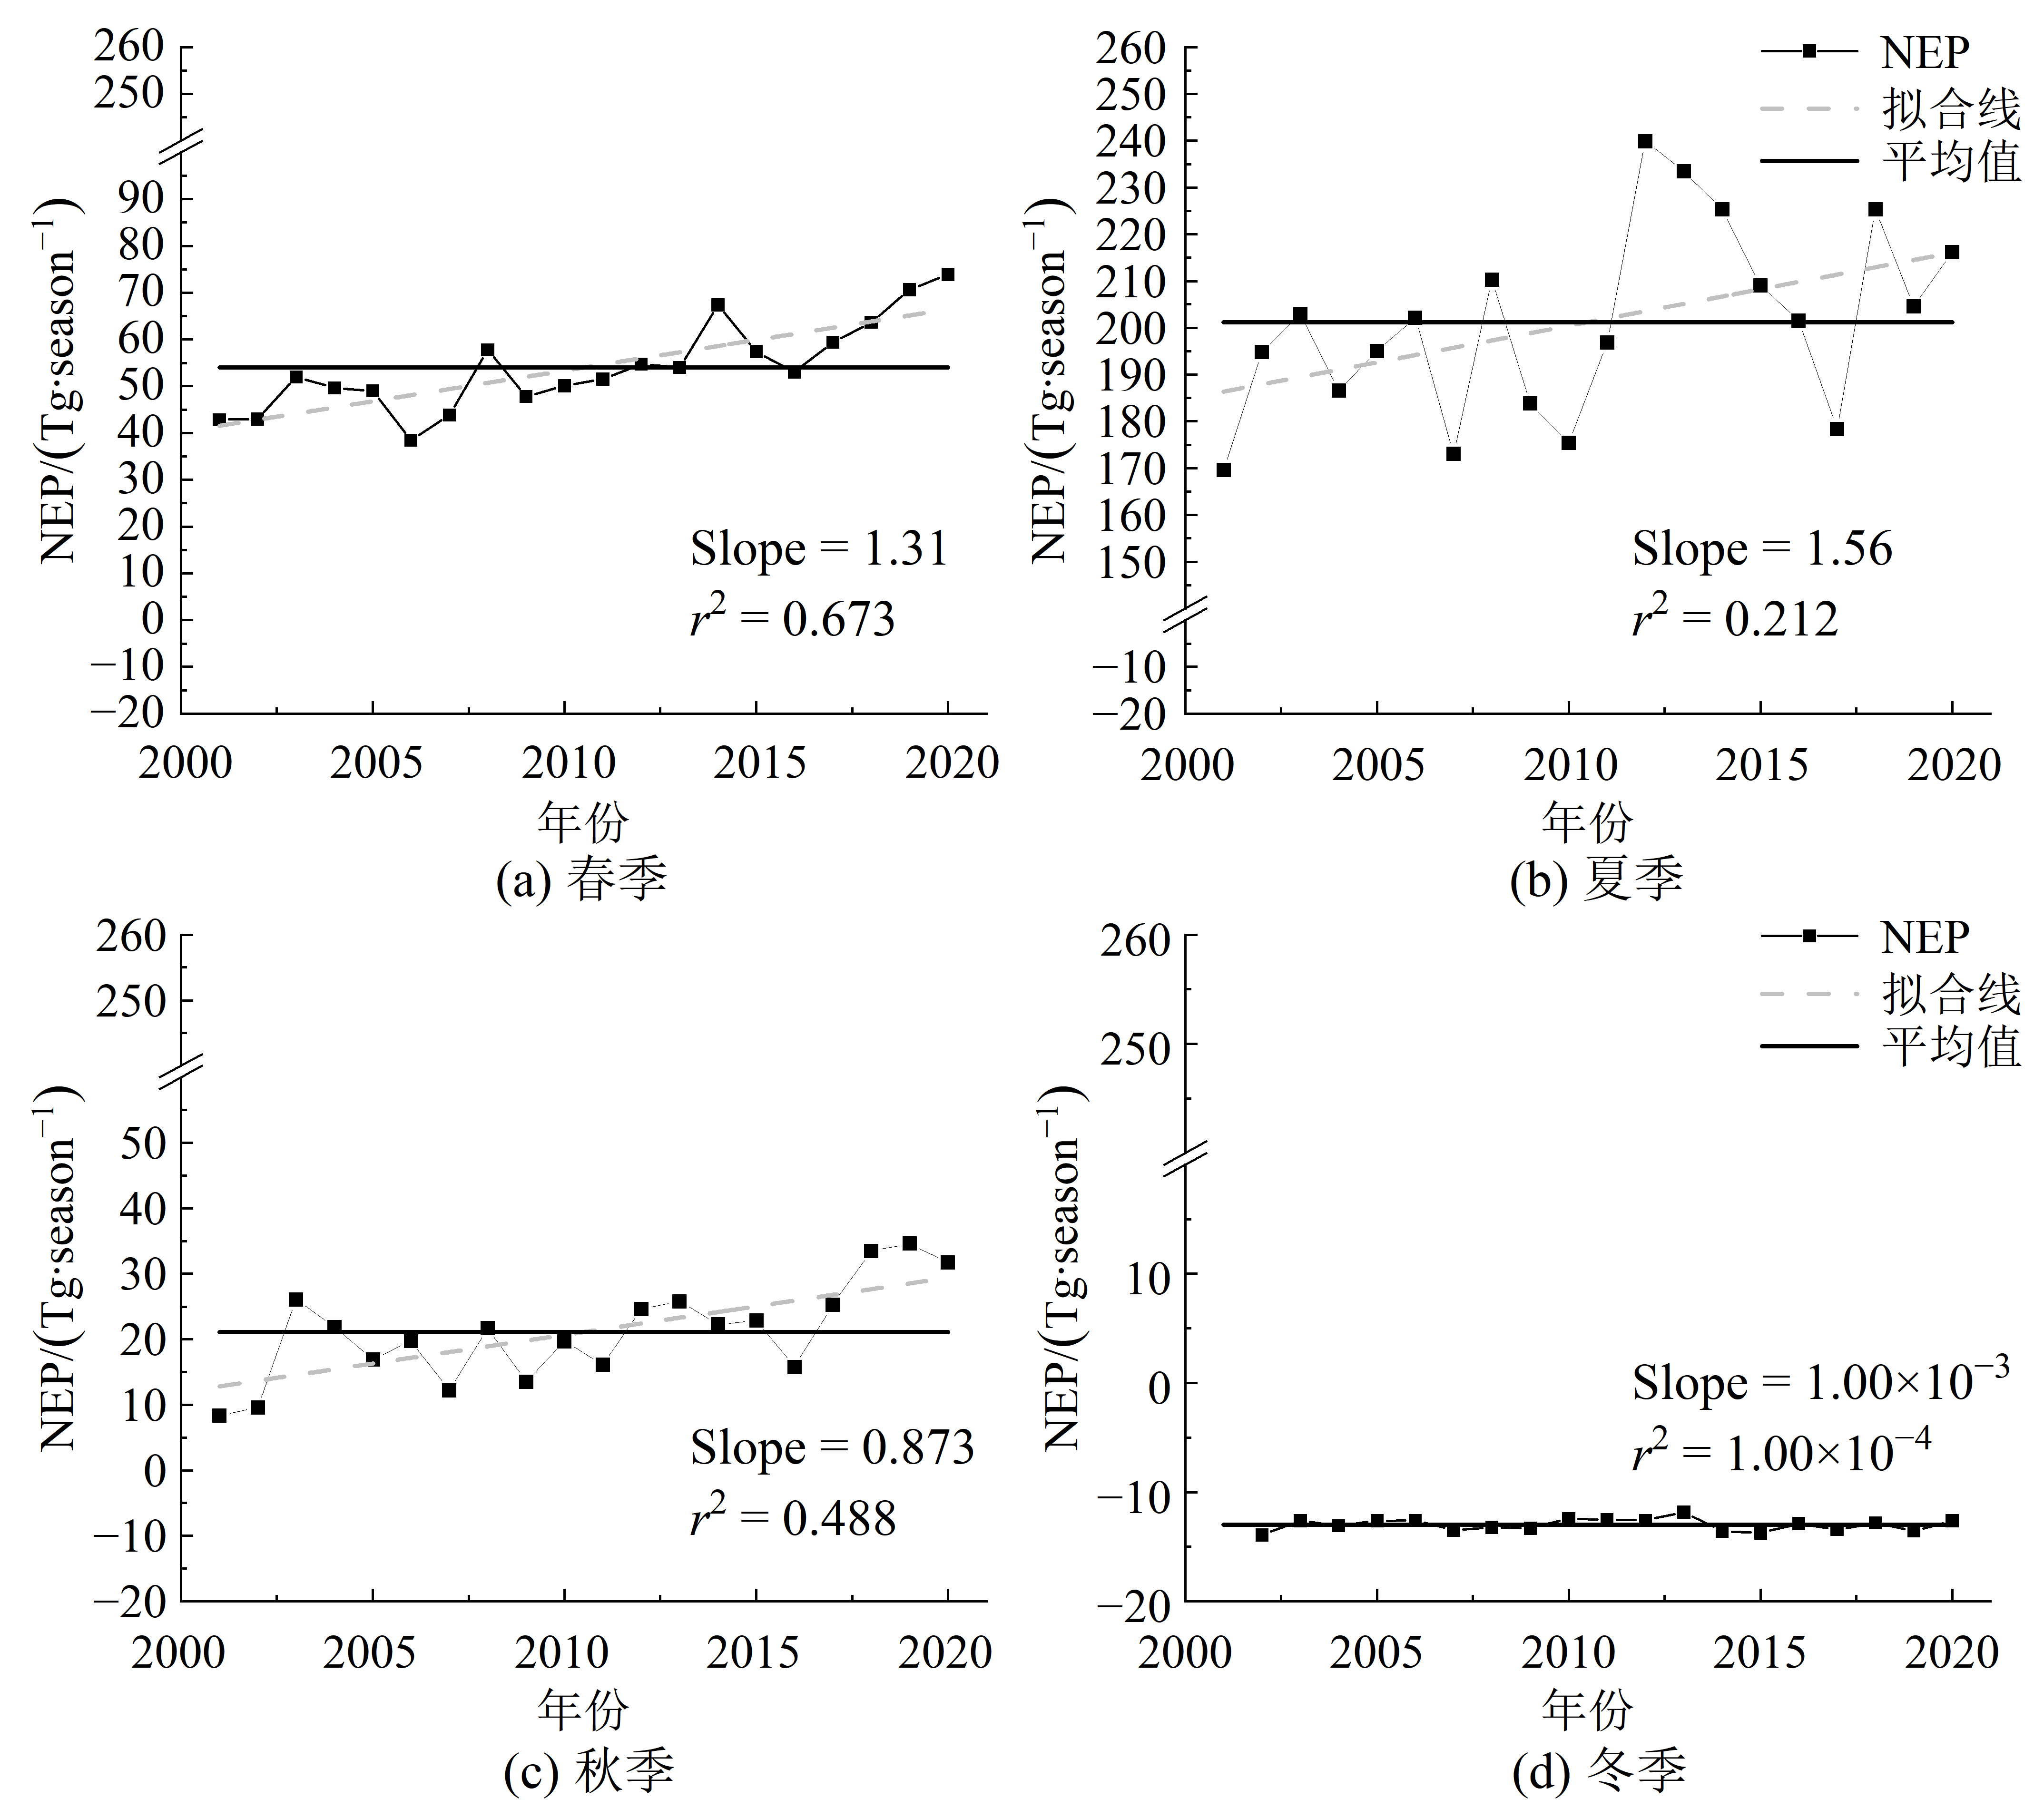
图7 2001-2020年内蒙古四季NEP年际变化
Figure 7 The inter-annual change of NEP in four seasons in Inner Mongolia from 2001 to 2020
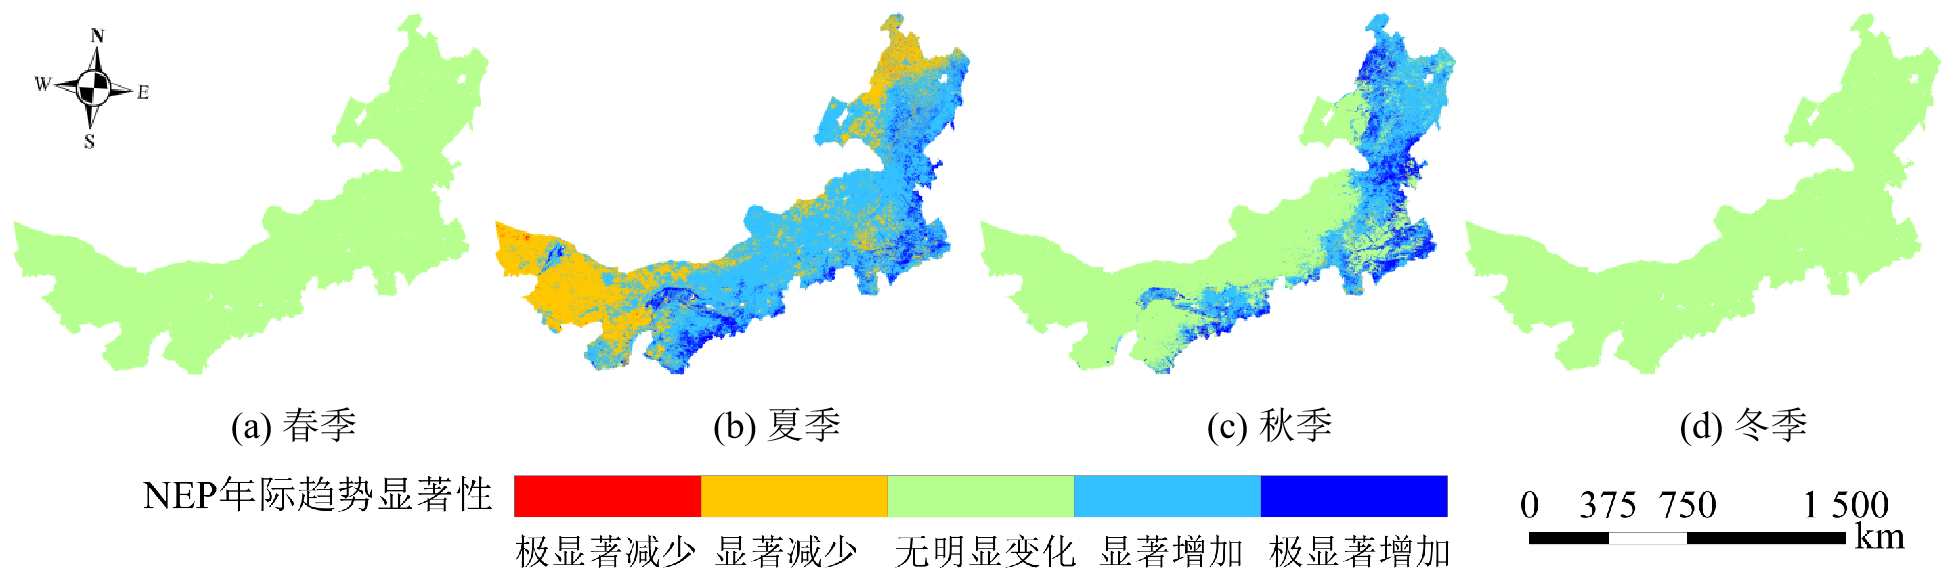
图8 2001-2020年内蒙古四季NEP年际趋势显著性
Figure 8 The significance of inter annual change of NEP in four seasons in Inner Mongolia from 2001 to 2020
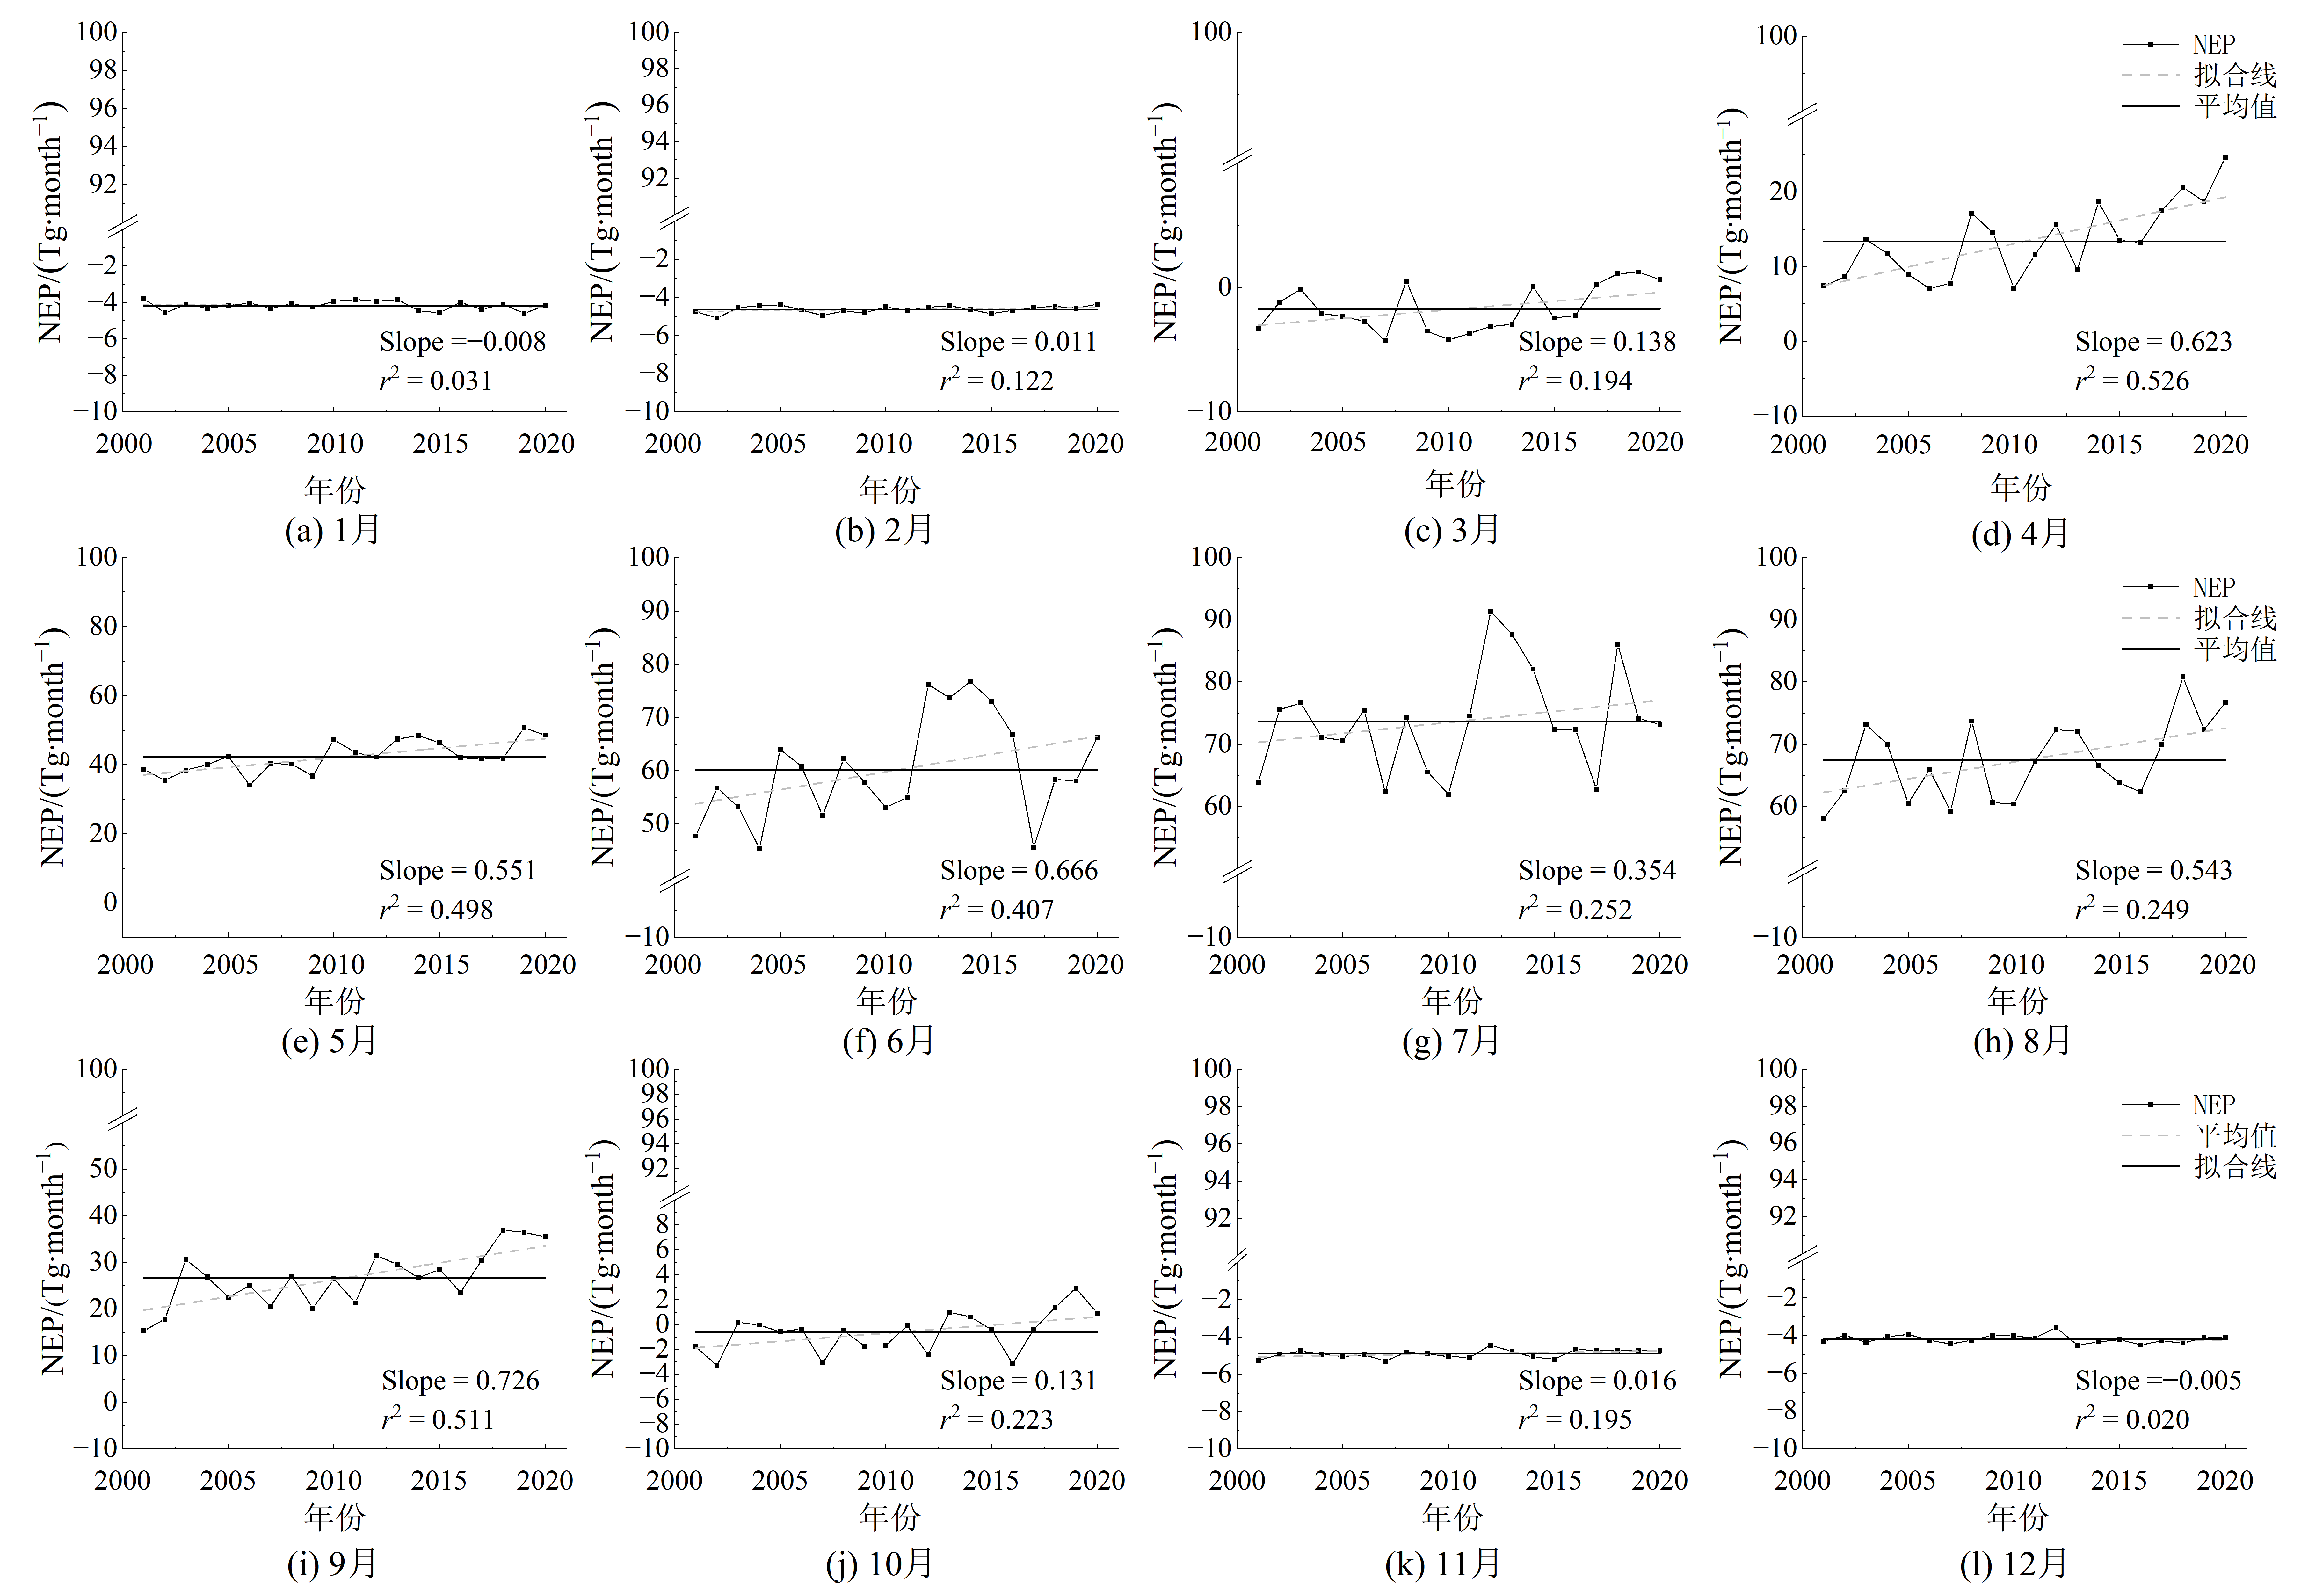
图9 2001-2020年内蒙古月NEP总量年际变化
Figure 9 The inter-annual change of total NEP for monthly in Inner Mongolia from 2001 to 2020
| 月份 | 极显著 减少% | 显著 减少% | 无明显 变化% | 显著 增加% | 极显著 增加% |
|---|---|---|---|---|---|
| 1 | 0 | 0 | 100 | 0 | 0 |
| 2 | 0 | 0 | 100 | 0 | 0 |
| 3 | 0 | 2.00×10⁻² | 99.3 | 0.690 | 4.00×10⁻² |
| 4 | 0 | 0.730 | 59.9 | 26.2 | 13.2 |
| 5 | 0 | 17.9 | 11.4 | 63.9 | 6.79 |
| 6 | 0 | 30.7 | 12.7 | 51.4 | 5.26 |
| 7 | 0 | 37.9 | 4.35 | 54.0 | 3.74 |
| 8 | 0 | 34.0 | 1.27 | 57.8 | 6.98 |
| 9 | 0 | 3.27 | 39.7 | 45.9 | 11.2 |
| 10 | 0 | 0.400 | 95.8 | 3.51 | 0.250 |
| 11 | 0 | 0 | 100 | 0 | 0 |
| 12 | 0 | 0 | 100 | 0 | 0 |
表3 2001-2020年内蒙古月NEP年际变化趋势面积占比
Table 3 The percentage of NEP in monthly in Inner Mongolia from 2001 to 2020
| 月份 | 极显著 减少% | 显著 减少% | 无明显 变化% | 显著 增加% | 极显著 增加% |
|---|---|---|---|---|---|
| 1 | 0 | 0 | 100 | 0 | 0 |
| 2 | 0 | 0 | 100 | 0 | 0 |
| 3 | 0 | 2.00×10⁻² | 99.3 | 0.690 | 4.00×10⁻² |
| 4 | 0 | 0.730 | 59.9 | 26.2 | 13.2 |
| 5 | 0 | 17.9 | 11.4 | 63.9 | 6.79 |
| 6 | 0 | 30.7 | 12.7 | 51.4 | 5.26 |
| 7 | 0 | 37.9 | 4.35 | 54.0 | 3.74 |
| 8 | 0 | 34.0 | 1.27 | 57.8 | 6.98 |
| 9 | 0 | 3.27 | 39.7 | 45.9 | 11.2 |
| 10 | 0 | 0.400 | 95.8 | 3.51 | 0.250 |
| 11 | 0 | 0 | 100 | 0 | 0 |
| 12 | 0 | 0 | 100 | 0 | 0 |
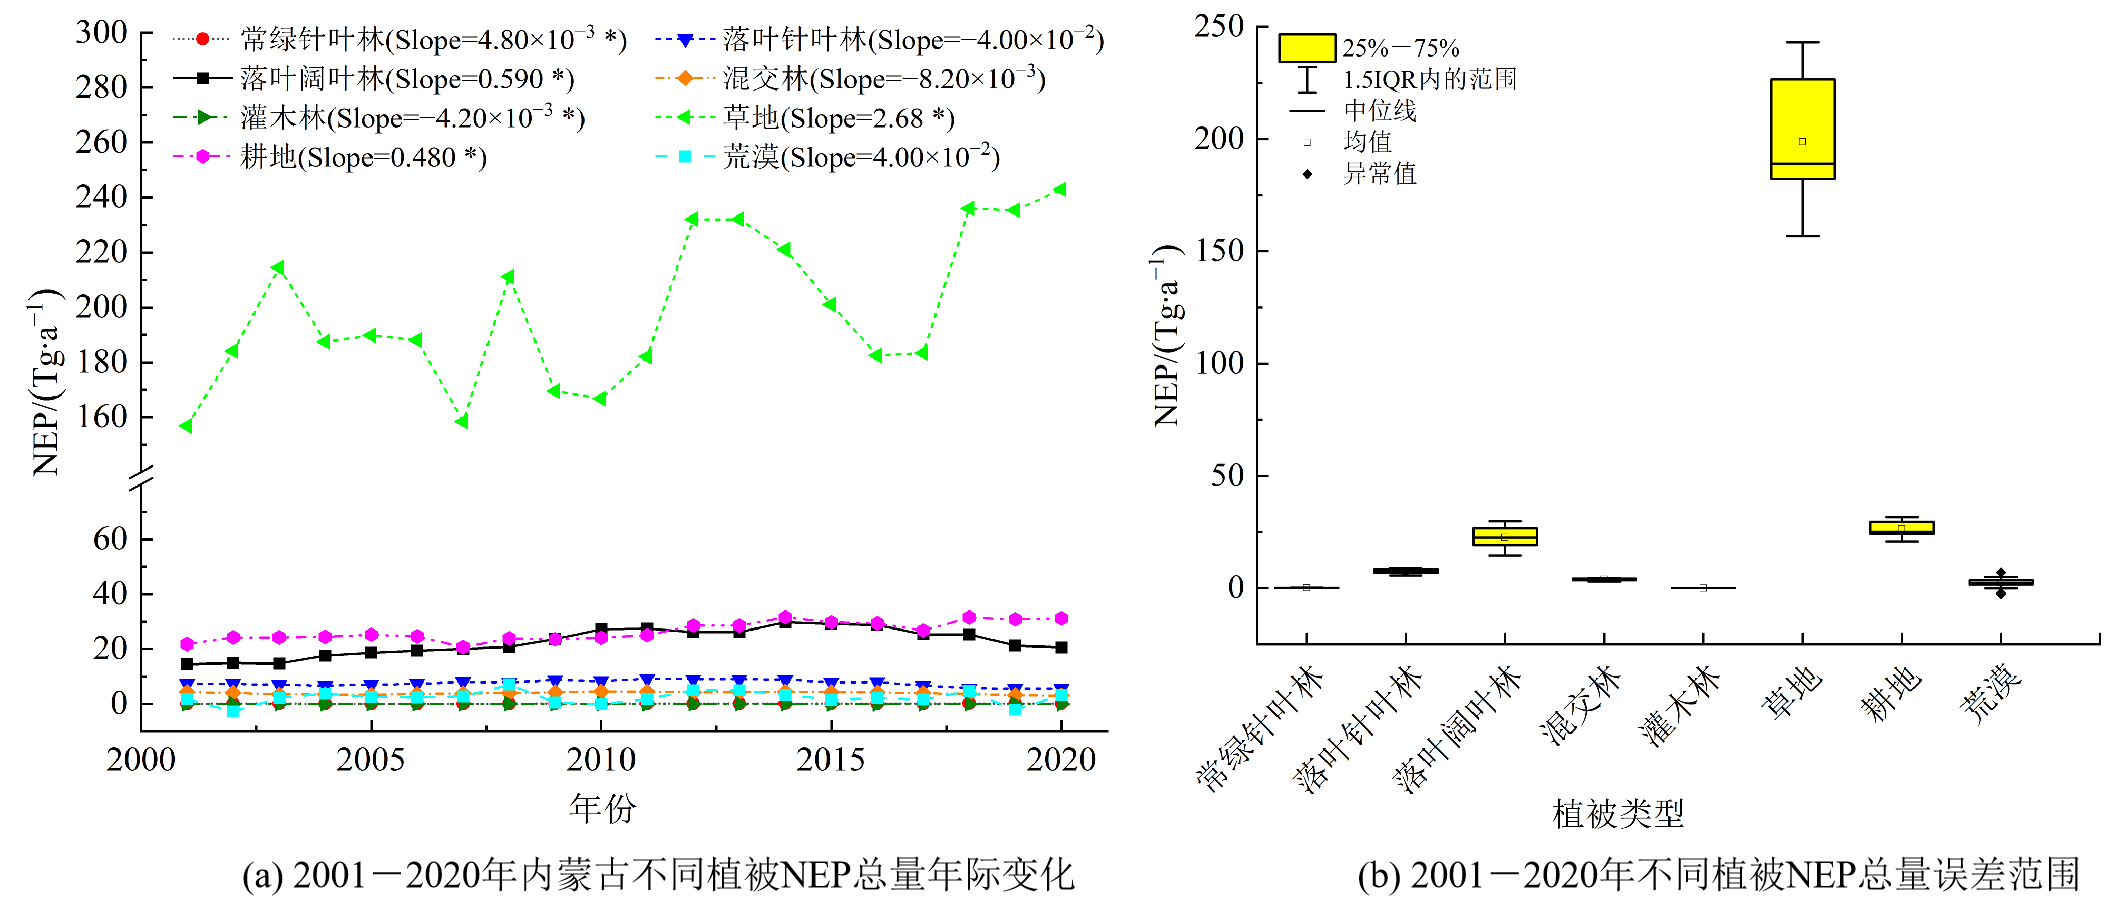
图10 内蒙古8种植被类型年NEP总量年际变化
Figure 10 Inter-annual change of total NEP in yearly for 8 vegetation types in Inner Mongolia
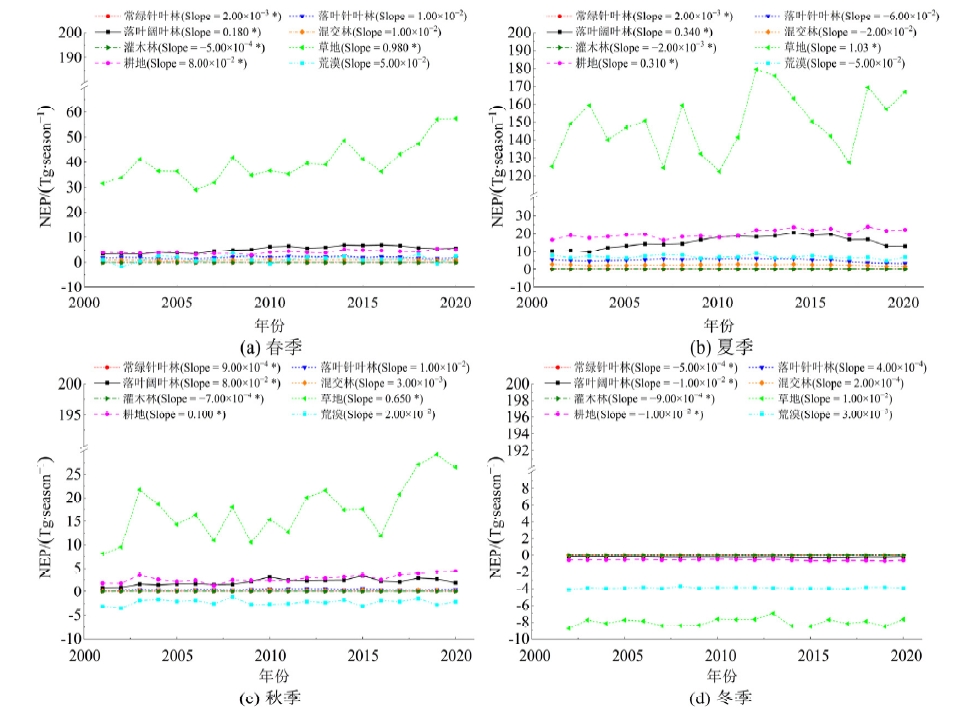
图11 2001-2020内蒙古8种植被类型四季NEP总量年际变化 ‘*’表示显著性为95%(P<0.05)
Figure 11 Inter-annual change of total NEP in four seasons for 8 vegetation types in Inner Mongolia from 2001 to 2020
| 植被类型 | 1月 | 2月 | 3月 | 4月 | 5月 | 6月 | 7月 | 8月 | 9月 | 10月 | 11月 | 12月 |
|---|---|---|---|---|---|---|---|---|---|---|---|---|
| 常绿针叶林 | −19.0* | −1.20* | 71.0 | 760* | 1.00×10³* | 910* | 56.0* | 660* | 620* | 250* | −7.10 | −17.0* |
| 落叶针叶林 | −39.0 | −200 | 390 | 1.10×10⁴ | −3.20×10³ | −7.30×10³ | −2.26×10⁴* | −2.75×10⁴* | 6.30×10³ | 1.30×10³ | −490* | −140 |
| 落叶阔叶林 | −2.10×10³* | −1.70×10³* | −4.70×10³ | 5.42×10⁴* | 1.25×10⁵* | 1.58×10⁵* | 1.12×10⁵* | 6.63×10⁴ | 6.99×10⁴* | 1.09×10⁴* | −1.20×10³ | −2.00×10³* |
| 混交林 | 190 | 180 | 540 | 7.40×10³* | −57.0 | −1.70×10³ | −7.70×10³ | −1.11×10⁴* | 2.40×10³ | 1.30×10³ | 280* | 33.0 |
| 灌木林 | −270* | −290* | −110* | −57.0 | −350* | −860* | −880* | −560* | −160 | −260* | −290* | −260* |
| 草地 | −4.10×10³ | 1.12×10⁴ | 1.14×10⁵* | 4.58×10⁵* | 4.04×10⁵* | 3.99×10⁵ | 1.84×10⁵ | 4.47×10⁵ | 5.33×10⁵* | 1.05×10⁵* | 1.45×10⁴* | −1.30×10³ |
| 耕地 | −3.10×10³* | 690 | 9.90×10³ | 3.57×10⁴* | 3.21×10⁴ | 1.33×10⁵* | 9.74×10⁴* | 7.44×10⁴* | 9.25×10⁴* | 1.12×10⁴* | −910 | −2.70×10³* |
| 荒漠 | 2.30×10³ | 2.50×10³ | 7.70×10³ | 5.19×10⁴ | −1.17×10⁴ | −2.23×10⁴ | −1.52×10⁴ | −1.12×10⁴ | 1.58×10⁴ | 220 | 3.40×10³* | 850 |
表4 2001-2020年内蒙古8种植被类型12个月NEP总量(以C计)年际变化
Table 4 Inter-annual change of total NEP (in terms of C) in twelve monthls for 8 vegetation types in Inner Mongolia from 2001 to 2020 Mg?month?1
| 植被类型 | 1月 | 2月 | 3月 | 4月 | 5月 | 6月 | 7月 | 8月 | 9月 | 10月 | 11月 | 12月 |
|---|---|---|---|---|---|---|---|---|---|---|---|---|
| 常绿针叶林 | −19.0* | −1.20* | 71.0 | 760* | 1.00×10³* | 910* | 56.0* | 660* | 620* | 250* | −7.10 | −17.0* |
| 落叶针叶林 | −39.0 | −200 | 390 | 1.10×10⁴ | −3.20×10³ | −7.30×10³ | −2.26×10⁴* | −2.75×10⁴* | 6.30×10³ | 1.30×10³ | −490* | −140 |
| 落叶阔叶林 | −2.10×10³* | −1.70×10³* | −4.70×10³ | 5.42×10⁴* | 1.25×10⁵* | 1.58×10⁵* | 1.12×10⁵* | 6.63×10⁴ | 6.99×10⁴* | 1.09×10⁴* | −1.20×10³ | −2.00×10³* |
| 混交林 | 190 | 180 | 540 | 7.40×10³* | −57.0 | −1.70×10³ | −7.70×10³ | −1.11×10⁴* | 2.40×10³ | 1.30×10³ | 280* | 33.0 |
| 灌木林 | −270* | −290* | −110* | −57.0 | −350* | −860* | −880* | −560* | −160 | −260* | −290* | −260* |
| 草地 | −4.10×10³ | 1.12×10⁴ | 1.14×10⁵* | 4.58×10⁵* | 4.04×10⁵* | 3.99×10⁵ | 1.84×10⁵ | 4.47×10⁵ | 5.33×10⁵* | 1.05×10⁵* | 1.45×10⁴* | −1.30×10³ |
| 耕地 | −3.10×10³* | 690 | 9.90×10³ | 3.57×10⁴* | 3.21×10⁴ | 1.33×10⁵* | 9.74×10⁴* | 7.44×10⁴* | 9.25×10⁴* | 1.12×10⁴* | −910 | −2.70×10³* |
| 荒漠 | 2.30×10³ | 2.50×10³ | 7.70×10³ | 5.19×10⁴ | −1.17×10⁴ | −2.23×10⁴ | −1.52×10⁴ | −1.12×10⁴ | 1.58×10⁴ | 220 | 3.40×10³* | 850 |
| [1] |
BALDOCCHI D, 2014. Measuring fluxes of trace gases and energy between ecosystems and the atmosphere-the state and future of the eddy covariance method[J]. Global Change Biology, 20(12): 3600-3609.
DOI URL |
| [2] |
BOND-LAMBERTY B, WANG C, GOWER S T, 2004. A global relationship between the heterotrophic and autotrophic components of soil respiration?[J]. Global Change Biology, 10(10): 1756-1766.
DOI URL |
| [3] | FANG J Y, TANG Y H, LIN J D, et al., 2000. Global ecology: Climate change and ecological responses[M]. Changing Global Climates, Beijing: Chinese Higher Education Press and Springer Heidelberg: 1-24. |
| [4] |
FERNÁNDEZ-MARTÍNEZ M, SARDANS J, CHEVALLIER F, et al., 2019. Global trends in carbon sinks and their relationships with CO2 and temperature[J]. Nature Climate Change, 9(1): 73-79.
DOI |
| [5] |
FRIEDLINGSTEIN P, JONES M W, O'SULLIVAN M, et al., 2022. Global carbon budget 2021[J]. Earth System Science Data, 14(4): 1917-2005.
DOI URL |
| [6] |
HAO L, WANG S, CUI X P, et al., 2021. Spatiotemporal dynamics of vegetation net primary productivity and its response to climate change in inner mongolia from 2002 to 2019[J]. Sustainability, 13(23): 13310.
DOI URL |
| [7] |
KOSTOPOULOU E, 2021. Applicability of ordinary Kriging modeling techniques for filling satellite data gaps in support of coastal management[J]. Modeling Earth Systems and Environment, 7(2): 1145-1158.
DOI |
| [8] |
LIANG L, GENG D, YAN J, et al., 2022. Remote sensing estimation and spatiotemporal pattern analysis of terrestrial net ecosystem productivity in China[J]. Remote Sensing, 14(8): 1902.
DOI URL |
| [9] |
LIU Y C, LI Z, CHEN Y N, et al., 2022. Evaluation of consistency among three NDVI products applied to High Mountain Asia in 2000-2015[J]. Remote Sensing of Environment, 269(10): 112821.
DOI URL |
| [10] |
LI H Q, ZHANG F W, LI Y N, et al., 2016. Seasonal and inter-annual variations in CO2 fluxes over 10 years in an alpine shrubland on the Qinghai-Tibetan Plateau, China[J]. Agricultural and Forest Meteorology, 228-229: 95-103.
DOI URL |
| [11] |
OHLSON J A, KIM S, 2015. Linear valuation without OLS: The Theil-Sen estimation approach[J]. Review of Accounting Studies, 20: 395-435.
DOI URL |
| [12] |
PIAO S, CIAIS P, FRIEDLINGSTEIN P, et al., 2008. Net carbon dioxide losses of northern ecosystems in response to autumn warming[J]. Nature, 451(7174): 49-52.
DOI |
| [13] |
RICHARDSON A D, ANDY BLACK T, CIAIS P, et al., 2010. Influence of spring and autumn phenological transitions on forest ecosystem productivity[J]. Philosophical Transactions of the Royal Society B: Biological Sciences, 365(1555): 3227-3246.
DOI URL |
| [14] |
SULLA-MENASHE D, GRAY J M, ABERCROMBIE S P, et al., 2019. Hierarchical mapping of annual global land cover 2001 to present: The MODIS Collection 6 Land Cover product[J]. Remote Sensing of Environment, 222: 183-194.
DOI URL |
| [15] |
TIAN H J, CAO C X, CHEN W, et al., 2015. Response of vegetation activity dynamic to climatic change and ecological restoration programs in Inner Mongolia from 2000 to 2012[J]. Ecological Engineering, 82: 276-289.
DOI URL |
| [16] |
TONG S Q, LI X Q, ZHANG J Q, et al., 2019. Spatial and temporal variability in extreme temperature and precipitation events in Inner Mongolia (China) during 1960-2017[J]. Science of the Total Environment, 649: 75-89.
DOI URL |
| [17] |
WANG Y L, XU X G, HUANG L S, et al., 2019. An improved CASA model for estimating winter wheat yield from remote sensing images[J]. Remote Sensing, 11(9): 1088.
DOI URL |
| [18] |
YAO Y T, LI Z J, WANG T, et al., 2018. A new estimation of China's net ecosystem productivity based on eddy covariance measurements and a model tree ensemble approach[J]. Agricultural and Forest Meteorology, 253-254: 84-93.
DOI URL |
| [19] |
YU G R, ZHENG Z M, WANG Q F, et al., 2010. Spatiotemporal pattern of soil respiration of terrestrial ecosystems in China: The development of a geostatistical model and its simulation[J]. Environmental Science & Technology, 44(16): 6074-6080.
DOI URL |
| [20] |
ZHAI Y G, ROY D P, MARTINS V S, et al., 2022. Conterminous United States Landsat-8 top of atmosphere and surface reflectance tasseled cap transformation coefficients[J]. Remote Sensing of Environment, 274: 112992.
DOI URL |
| [21] |
ZHOU W, YANG H, ZHOU L, et al., 2018. Dynamics of grassland carbon sequestration and its coupling relation with hydrothermal factor of Inner Mongolia[J]. Ecological Indicators, 95(Part 1): 1-11.
DOI URL |
| [22] | 布和, 乌兰图雅, 斯琴朝克图, 等, 2023. 1982-2099年内蒙古地区植被覆盖变化对气象干旱的响应[J]. 西北林学院学报, 38(5): 1-9. |
| BU H, WULAN T Y, SIQIN C K T, et al., 2023. Response of vegetation fraction cover change to meteorological drought in Inner Mongolia from 1982 to 2099[J]. Journal of Northwest Forestry University, 38(5): 1-9. | |
| [23] | 戴尔阜, 黄宇, 吴卓, 等, 2016. 内蒙古草地生态系统碳源/汇时空格局及其与气候因子的关系[J]. 地理学报, 26(3): 297-312. |
|
DAI E F, HUANG Y, WU Z, et al., 2016. Analysis of spatio-temporal features of a carbon source/sink and its relationship to climatic factors in the Inner Mongolia grassland ecosystem[J]. Journal of Geographical Sciences, 26(3): 297-312.
DOI |
|
| [24] | 范也平, 2018. 河西走廊植被碳源/汇时空变化及其对气候变化的响应[D]. 兰州: 西北师范大学: 1-53. |
| FAN Y P, 2018. Spatio-temporal variation of carbon source/sink of vegetation and its response to climate change in the Hexi Corridor[D]. Lanzhou, Northwest Normal University: 1-53. | |
| [25] |
郝蕾, 翟涌光, 戚文超, 等, 2023. 2001-2020年内蒙古植被碳源/碳汇时空动态及对气候因子的响应[J]. 生态环境学报, 32(5): 825-834.
DOI |
| HAO L, ZHAI Y G, QI W C, et al., 2023. Spatial-temporal dynamics of vegetation carbon sources/sinks in Inner Mongolia from 2001 to 2020 and Its Response to Climate Change[J]. Ecology and Environmental Sciences, 32(5): 825-834. | |
| [26] | 刘应帅, 余瑞, 郑彬彬, 等, 2022. 海南岛森林植被NEP季节性时空变化规律及气候驱动因素分析[J]. 热带生物学报, 13(2): 166-176. |
| LIU Y S, YU R, ZHENG B B, et al., 2022. Analysis of seasonal spatial and temporal variation patterns of forest vegetation NEP and climate drivers in Hainan Island[J]. Journal of Tropical Biology, 13(2): 166-176. | |
| [27] | 穆少杰, 2019. 气候变化和LUCC对内蒙古草地碳循环时空格局及演变趋势的影响[D]. 南京: 南京大学: 1-183. |
| MU S J, 2019. Impacts of climate change and Lucc on spatio-temporal dynamics of the carbon cycle in Inner Mongolia grassland[D]. Nanjing, Nanjing University: 1-183. | |
| [28] |
魏丽萍, 王孝安, 王世雄, 等, 2011. 黄土高原马栏林区基于不同植被组织尺度的群落物种多样性[J]. 植物生态学报, 35(1): 17-26.
DOI |
|
WEI L P, WANG X A, WANG S X, et al., 2011. Species diversity of communities based on different vegetation organizational scales in China's Malan forest region[J]. Chinese Journal of Plant Ecology, 35(1): 17-26.
DOI URL |
|
| [29] | 解宪丽, 2005. 基于GIS的国家尺度和区域尺度土壤有机碳库研究[D]. 南京: 南京师范大学: 1-108. |
| XIE X L, 2005. Study on soil organic carbon stocks in national and regional scale suing on GIS[D]. Nanjing: Nanjing Normal University: 1-108. | |
| [30] | 赵宁, 周蕾, 庄杰, 等, 2021. 中国陆地生态系统碳源/汇整合分析[J]. 生态学报, 41(19): 7648-7658. |
| ZHAO N, ZHOU L, ZHUANG J, et al., 2021. Integration analysis of the carbon sources and sinks in terrestrial ecosystems, China[J]. Acta Ecologica Sinica, 41(19): 7648-7658. | |
| [31] | 张新中, 李育, 张成琦, 等, 2020. 2000-2014年石羊河流域净生态系统生产力变化分析[J]. 兰州大学学报(自然科学版), 56(4): 486-492. |
| ZHANG X Z, LI Y, ZHANG C Q, et al., 2020. Analysis of the net ecosystem production changes in the Shiyang River Basin from 2000 to 2014[J]. Journal of Lanzhou University (Natural Sciences), 56(4): 486-492. | |
| [32] | 张祯祺, 蔡惠文, 张平平, 等, 2023. 基于GEE遥感云平台的三江源植被碳源/汇时空变化研究[J]. 自然资源遥感, 35(1): 231-242. |
| ZHANG Z Q, CAI H W, ZHANG P P, et al., 2023. Temporal and spatial variation of vegetation carbon source/sink in the Three-River Headwaters region based on GEE[J]. Remote Sensing for Natural Resources, 35(1): 231-242. | |
| [33] | 周涛, 史培军, 孙睿, 等, 2004. 气候变化对净生态系统生产力的影响[J]. 地理学报, 59(3): 357-365. |
|
ZHOU T, SHI P J, SUN R, et al., 2004. The impacts of climate change on net ecosystem production in China[J]. Acta Geographica Sinica, 59(3): 357-365.
DOI |
| [1] | 姚林杰, 张佳宁, 张恒瑞, 赵艳云, 张庆, 李元恒. 基于生态足迹的内蒙古自然资源可持续利用分析[J]. 生态环境学报, 2023, 32(8): 1525-1536. |
| [2] | 郝蕾, 翟涌光, 戚文超, 兰穹穹. 2001-2020年内蒙古植被碳源/碳汇时空动态及对气候因子的响应[J]. 生态环境学报, 2023, 32(5): 825-834. |
| [3] | 翁升恒, 张玉琴, 姜冬昕, 潘卫华, 李丽纯, 张方敏. 福建省森林植被NEP时空变化及影响因子分析[J]. 生态环境学报, 2023, 32(5): 845-856. |
| [4] | 杨春亮, 刘旻霞, 王千月, 苗乐乐, 肖音迪, 王敏. 单户与联户放牧经营下草玉梅与嵩草种群空间格局及其关联性[J]. 生态环境学报, 2023, 32(4): 651-659. |
| [5] | 宋志斌, 周佳诚, 谭路, 唐涛. 高原河流着生藻类群落沿海拔梯度的变化特征--以西藏黑曲、雪曲为例[J]. 生态环境学报, 2023, 32(2): 274-282. |
| [6] | 向兴, 满百膺, 张俊忠, 罗洋, 毛小涛, 张超, 孙丙华, 王希. 黄山土壤细菌群落及氮循环功能群的垂向分布格局[J]. 生态环境学报, 2023, 32(1): 56-69. |
| [7] | 石文静, 周翰鹏, 孙涛, 黄金涛, 杨文焕, 李卫平. 矿区周边土壤重金属污染优先控制因子及健康风险评价研究[J]. 生态环境学报, 2022, 31(8): 1616-1628. |
| [8] | 朱立安, 张会化, 程炯, 李婷, 林梓, 李俊杰. 珠江三角洲林业用地土壤重金属潜在生态风险格局分析[J]. 生态环境学报, 2022, 31(6): 1253-1262. |
| [9] | 温智峰, 魏识广, 李林, 叶万辉, 练琚愉. 南亚热带常绿阔叶林植物不同分类水平上的空间分布格局及空间关联[J]. 生态环境学报, 2022, 31(3): 440-450. |
| [10] | 曹云, 孙应龙, 姜月清, 万君. 黄河流域净生态系统生产力的时空分异特征及其驱动因子分析[J]. 生态环境学报, 2022, 31(11): 2101-2110. |
| [11] | 李巧玉, 张小晶, 陈娟, 刘媛, 刘锦春, 陶建平. 川西亚高山彩叶林景观分布格局及其地形影响研究[J]. 生态环境学报, 2021, 30(8): 1581-1588. |
| [12] | 田义超, 杨棠, 徐欣. 北部湾典型入海流域植被净初级生产力时空分布特征及其影响因素[J]. 生态环境学报, 2021, 30(5): 938-948. |
| [13] | 郭彩云, 张雷, 高孝威, 苏艳龙, 李琳, 王晓江, 杨九艳. 内蒙古大青山4种典型植被类型生态系统服务权衡与协同[J]. 生态环境学报, 2021, 30(10): 1999-2009. |
| [14] | 武岩, 靳拓, 王跃飞, 贺鹏程, 罗军, 刘宏金, 张雷, 郭晓宇, 陈瑞英. 内蒙古阴山北麓马铃薯应用PBAT/PLA全生物降解地膜可行性分析[J]. 生态环境学报, 2021, 30(10): 2100-2108. |
| 阅读次数 | ||||||
|
全文 |
|
|||||
|
摘要 |
|
|||||