生态环境学报 ›› 2021, Vol. 30 ›› Issue (5): 938-948.DOI: 10.16258/j.cnki.1674-5906.2021.05.006
田义超1,2,3( ), 杨棠1, 徐欣1
收稿日期:2020-02-15
出版日期:2021-05-18
发布日期:2021-08-06
作者简介:田义超(1986年生),男,副教授,博士,主要从事资源环境遥感及海岸带生态环境监测的相关研究。E-mail:tianyichao1314@yeah.net
基金资助:
TIAN Yichao1,2,3(), YANG Tang1, XU Xin1
Received:2020-02-15
Online:2021-05-18
Published:2021-08-06
摘要:
北部湾入海流域处于典型河口-近海岸相互作用地带,是中国南亚热带地区典型的独流入海河流,对该地区的植被净初级生产力(NPP)进行定量化研究,可为中国南亚热带地区典型独流入海流域碳循环研究及其生态恢复提供科学依据。以北部湾典型入海流域为研究对象,基于CASA模型并结合Theil-Sen趋势、Hurst指数、偏相关分析等数理统计方法,定量化分析了流域2000—2017年NPP的时空变化特征、未来趋势及其影响因素。结果表明,时间尺度上,流域多年月均NPP介于8.50—95.86 g∙m-2(以C计,下同)之间,呈倒“V”型结构;年际变化上,多年NPP总体呈现波动上升趋势,增速为8.83 g∙m-2∙a-1,快于广西壮族自治区(增速为0.001 g∙m-2∙a-1)。空间尺度上,典型入海流域NPP呈明显地域分异规律,NPP高值区主要位于西南部的十万大山南麓,低值区散布钦江河道附近、南流江流域的上游以及下游的西南部地区。流域NPP总体上以改善为主,NPP增加区域是减少区域的3.05倍。流域NPP的Hurst指数范围介于0.20973—1之间,总体上以持续序列为主,预示研究区NPP未来处于持续增加趋势。影响因素上,气温是影响NPP的主导因素,NPP与多年平均气温存在正相关关系,与降水存在负相关关系。NPP在不同覆被类型、海拔和坡度梯度上均呈现出显著的地域分异规律以及时空差异性特征。该研究表明北部湾入海典型流域NPP呈逐年增加趋势,气温是流域NPP的主导因素。
中图分类号:
田义超, 杨棠, 徐欣. 北部湾典型入海流域植被净初级生产力时空分布特征及其影响因素[J]. 生态环境学报, 2021, 30(5): 938-948.
TIAN Yichao, YANG Tang, XU Xin. Temporal and Spatial Distribution Characteristics and Influencing Factors of Net Primary Productivity of Vegetation in Typical Basin Entering the Sea in Beibu Gulf[J]. Ecology and Environment, 2021, 30(5): 938-948.

图1 北部湾入海典型流域地理位置
Fig. 1 Geographical location map of typical basins entering the sea in Beibu Gulf
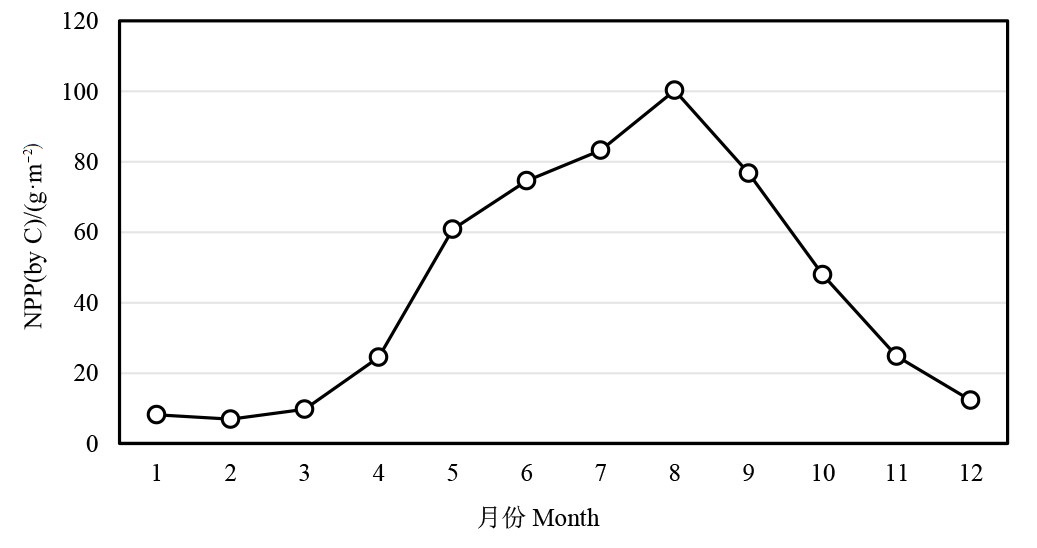
图2 北部湾入海典型流域年内NPP变化
Fig. 2 Annual variation of NPP in typical basin entering the sea in Beibu Gulf
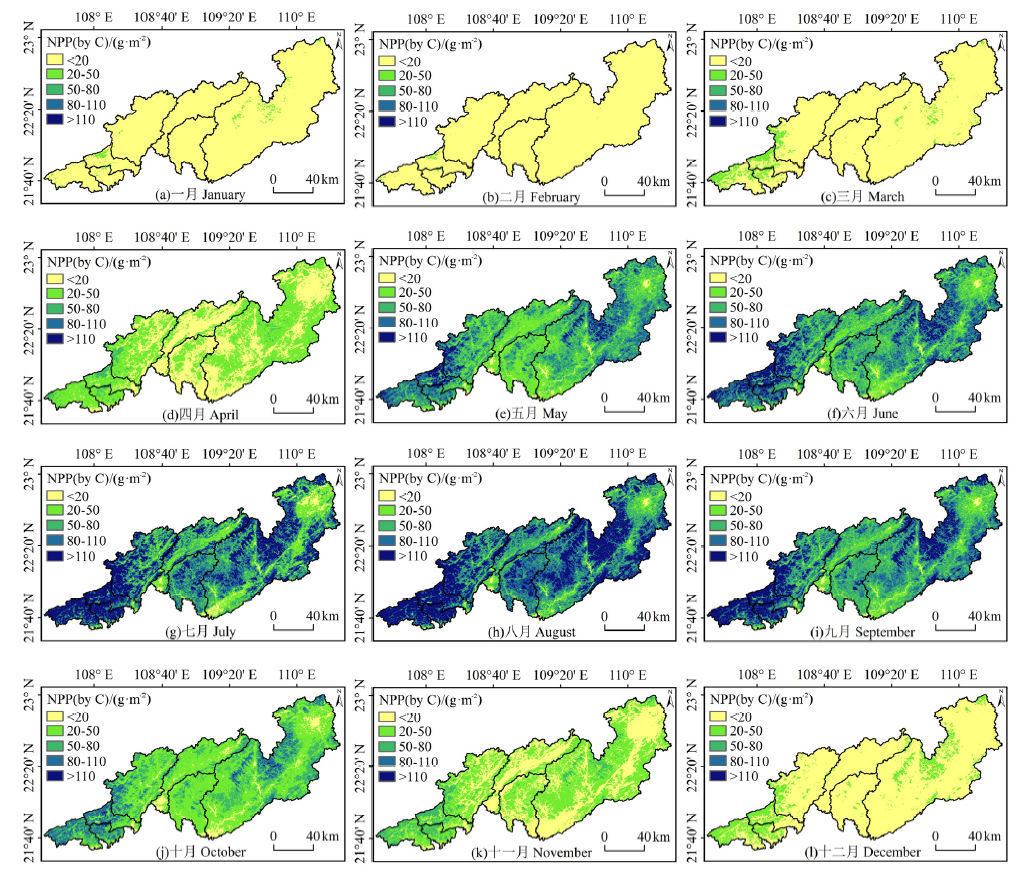
图3 北部湾入海典型流域年内NPP月均值空间分布格局
Fig. 3 Temporal and spatial distribution pattern of monthly NPP average in typical basin entering the sea in Beibu Gulf
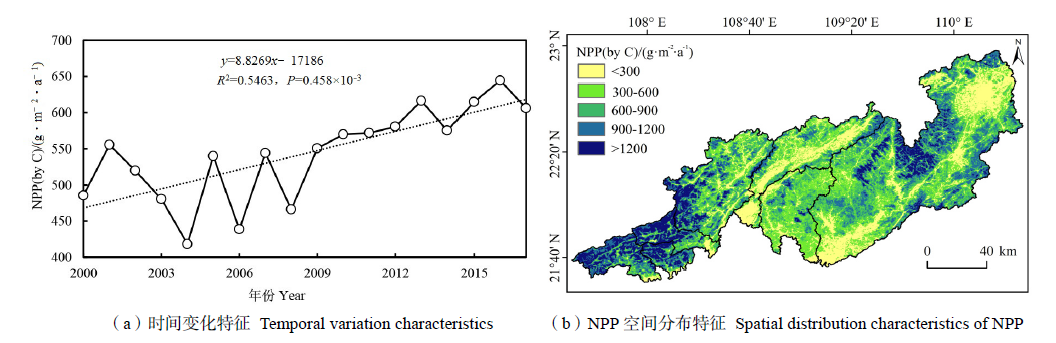
图4 2000—2017年北部湾入海典型流域NPP(a)时间变化特征和(b)NPP空间分布特征
Fig. 4 The temporal variation of NPP (a) and the spatial distribution of NPP (b) in typical basins entering the sea of Beibu Gulf from 2000 to 2017
| 植被变化趋势 Vegetation change trend | NPP变化趋势 NPP change trend | 面积 Area/km2 | 百分比 Proportion/% | |
|---|---|---|---|---|
| Sen趋势 Sen trend | P值 P value | |||
| 明显改善 Significant improvement | >0 | P<0.01 | 6225.88 | 0.33 |
| 中度改善 Moderate improvement | >0 | 0.01≤P<0.05 | 2195.31 | 0.12 |
| 轻微改善 Slight improvement | >0 | P≥0.05 | 5667.00 | 0.31 |
| 轻微减少 Slightly decrease | <0 | P≥0.05 | 3042.25 | 0.16 |
| 中度减少 Moderate decrease | <0 | 0.01≤P<0.05 | 612.88 | 0.03 |
| 严重减少 Seriously decrease | <0 | P<0.01 | 970.31 | 0.05 |
表1 2000—2017年北部湾入海典型流域NPP趋势变化统计
Table 1 Statistics of NPP trend changes in typical basins entering the sea of Beibu Gulf from 2000 to 2017
| 植被变化趋势 Vegetation change trend | NPP变化趋势 NPP change trend | 面积 Area/km2 | 百分比 Proportion/% | |
|---|---|---|---|---|
| Sen趋势 Sen trend | P值 P value | |||
| 明显改善 Significant improvement | >0 | P<0.01 | 6225.88 | 0.33 |
| 中度改善 Moderate improvement | >0 | 0.01≤P<0.05 | 2195.31 | 0.12 |
| 轻微改善 Slight improvement | >0 | P≥0.05 | 5667.00 | 0.31 |
| 轻微减少 Slightly decrease | <0 | P≥0.05 | 3042.25 | 0.16 |
| 中度减少 Moderate decrease | <0 | 0.01≤P<0.05 | 612.88 | 0.03 |
| 严重减少 Seriously decrease | <0 | P<0.01 | 970.31 | 0.05 |

图5 北部湾入海典型流域Sen趋势空间变化
Fig. 5 Spatial variation of Sen trend in typical basin entering the sea in Beibu Gulf
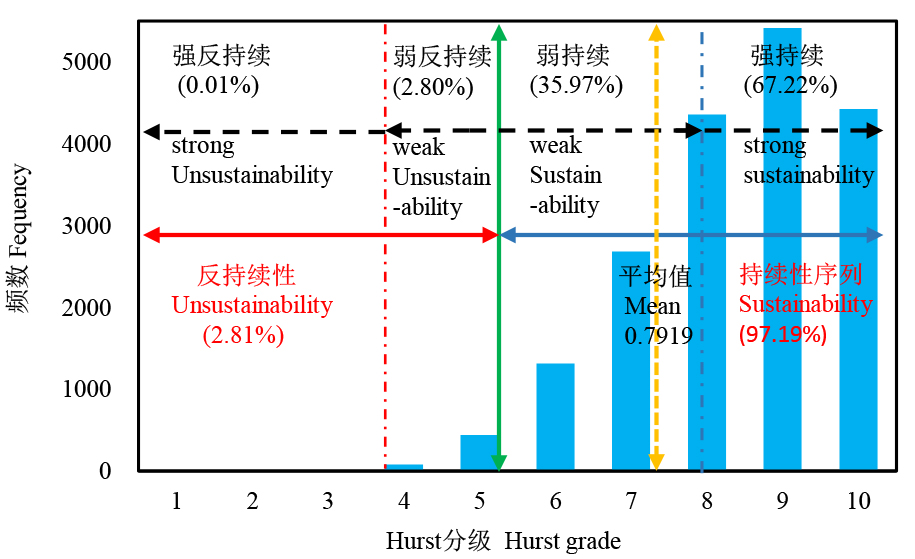
图6 Hurst指数正态分布
Fig. 6 Normal distribution diagram of Hurst index

图7 Hurst指数空间分级
Fig. 7 Spatial classification of Hurst index
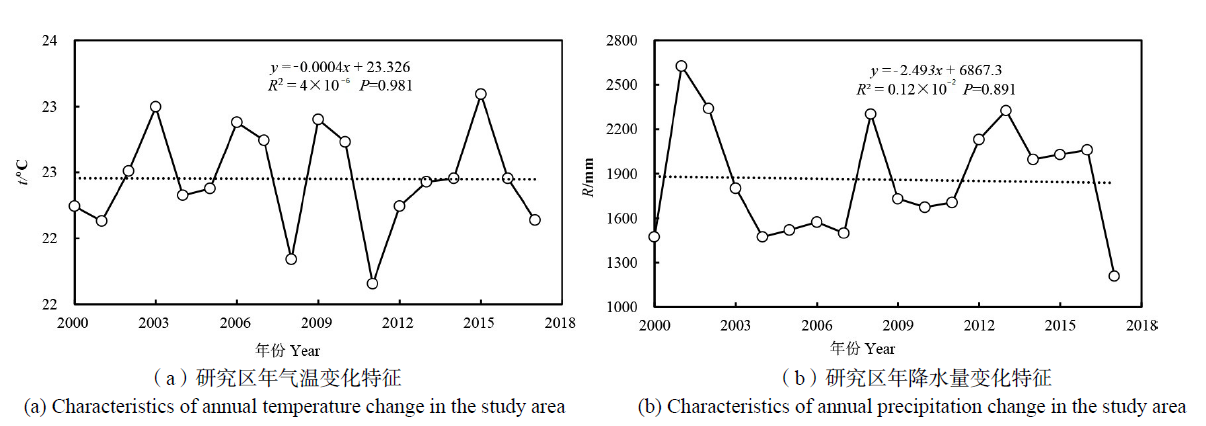
图8 研究区多年气温(t)和降水(R)变化特征
Fig. 8 Variation trend and spatial distribution of mean value of multi-year temperature (t) and precipitation (P) in research area

图9 研究区多年气温和降水变化均值空间分布特征
Fig. 9 Variation trend and spatial distribution of mean value of multi-year temperature and precipitation in research area
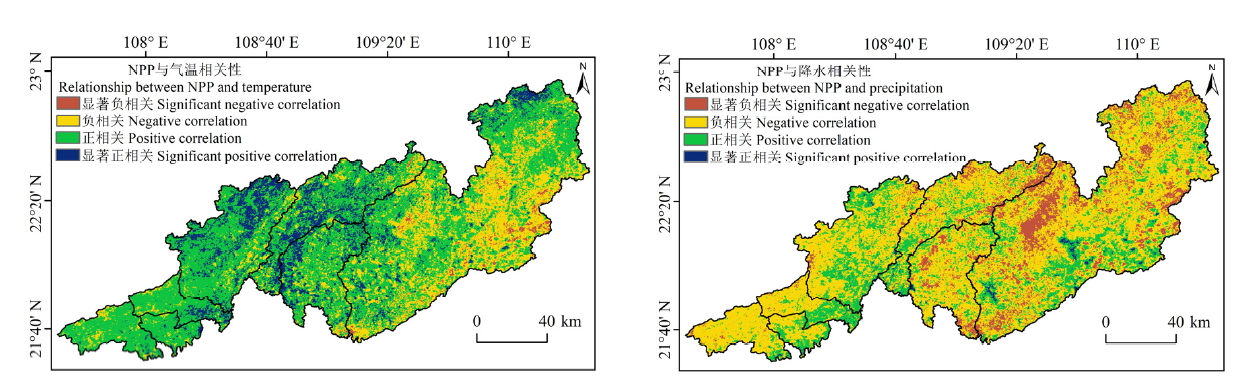
图10 研究区NPP与气温和降水的偏相关系数
Fig. 10 Partial correlation coefficient between NPP and temperature and precipitation in the study area
| 土地利用 land use | 年份 Year | 平均值 Average | |||
|---|---|---|---|---|---|
| 2000 | 2005 | 2010 | 2015 | ||
| 耕地 Arable land | 383.16 | 428.70 | 451.52 | 468.61 | 433.00 |
| 灌木 Bushwood | 605.96 | 669.00 | 721.35 | 798.66 | 698.74 |
| 林地 Woodland | 651.18 | 732.47 | 759.20 | 846.37 | 747.31 |
| 草地 Grassland | 345.15 | 389.14 | 385.58 | 338.38 | 364.56 |
| 湿地 Wetland | 289.36 | 269.49 | 290.12 | 309.15 | 289.53 |
| 其他用地 Other land | 256.50 | 273.68 | 211.55 | 187.14 | 232.22 |
表2 北部湾入海典型流域不同覆被类型的NPP平均值
Table 2 Average NPP of different covering types in typical basins entering the sea of Beibu Gulf g·m-2·a-1
| 土地利用 land use | 年份 Year | 平均值 Average | |||
|---|---|---|---|---|---|
| 2000 | 2005 | 2010 | 2015 | ||
| 耕地 Arable land | 383.16 | 428.70 | 451.52 | 468.61 | 433.00 |
| 灌木 Bushwood | 605.96 | 669.00 | 721.35 | 798.66 | 698.74 |
| 林地 Woodland | 651.18 | 732.47 | 759.20 | 846.37 | 747.31 |
| 草地 Grassland | 345.15 | 389.14 | 385.58 | 338.38 | 364.56 |
| 湿地 Wetland | 289.36 | 269.49 | 290.12 | 309.15 | 289.53 |
| 其他用地 Other land | 256.50 | 273.68 | 211.55 | 187.14 | 232.22 |
| 海拔类别 Gradient classfication | 年份 Year | 平均值 Average | |||
|---|---|---|---|---|---|
| 2000 | 2005 | 2010 | 2015 | ||
| 第一梯度 First gradient (<250 m) | 441.23 | 495.07 | 529.13 | 566.05 | 500.62 |
| 第二梯度 Second gradient (250‒500 m) | 799.81 | 863.38 | 870.13 | 971.28 | 853.54 |
| 第三梯度 Third gradient (500‒800 m) | 828.25 | 884.71 | 883.75 | 974.88 | 865.89 |
| 第四梯度 Fourth gradient (>800 m) | 768.98 | 848.74 | 750.80 | 890.09 | 776.52 |
表3 北部湾入海典型流域NPP海拔梯度差异
Table.3 Altitude gradient difference of NPP in typical basins entering the sea in Beibu Gulf g∙m-2∙a-1
| 海拔类别 Gradient classfication | 年份 Year | 平均值 Average | |||
|---|---|---|---|---|---|
| 2000 | 2005 | 2010 | 2015 | ||
| 第一梯度 First gradient (<250 m) | 441.23 | 495.07 | 529.13 | 566.05 | 500.62 |
| 第二梯度 Second gradient (250‒500 m) | 799.81 | 863.38 | 870.13 | 971.28 | 853.54 |
| 第三梯度 Third gradient (500‒800 m) | 828.25 | 884.71 | 883.75 | 974.88 | 865.89 |
| 第四梯度 Fourth gradient (>800 m) | 768.98 | 848.74 | 750.80 | 890.09 | 776.52 |
| 坡度分类 Slope classification | 坡度 Slope/ (°) | NPPave/ (g∙m-2∙a-1) | 面积 Area/ km2 | 比例 Proportion/% |
|---|---|---|---|---|
| 缓倾斜坡 Gentle slope | <5 | 454.95 | 13449.44 | 71.87 |
| 中等斜坡 Medium slope | 5‒8 | 684.08 | 1868.75 | 9.98 |
| 斜坡 Slope | 8‒15 | 789.30 | 2288.38 | 12.23 |
| 陡坡 Steep slope | 15‒25 | 887.06 | 914.69 | 4.89 |
| 急坡 Sharp slope | 25‒35 | 905.10 | 187.50 | 1.00 |
| 急陡坡 Sharp steep slope | >35 | 842.96 | 4.88 | 0.03 |
表4 北部湾入海典型流域坡度梯度差异
Table 4 Gradient difference of slope in typical Basins entering the sea in Beibu Gulf
| 坡度分类 Slope classification | 坡度 Slope/ (°) | NPPave/ (g∙m-2∙a-1) | 面积 Area/ km2 | 比例 Proportion/% |
|---|---|---|---|---|
| 缓倾斜坡 Gentle slope | <5 | 454.95 | 13449.44 | 71.87 |
| 中等斜坡 Medium slope | 5‒8 | 684.08 | 1868.75 | 9.98 |
| 斜坡 Slope | 8‒15 | 789.30 | 2288.38 | 12.23 |
| 陡坡 Steep slope | 15‒25 | 887.06 | 914.69 | 4.89 |
| 急坡 Sharp slope | 25‒35 | 905.10 | 187.50 | 1.00 |
| 急陡坡 Sharp steep slope | >35 | 842.96 | 4.88 | 0.03 |
| [1] | ALESSANDRI A, NAVARRA A, 2008. On the coupling between vegetation and rainfall inter-annual anomalies: Possible contributions to seasonal rainfall predictability over land areas[J]. Geophysical Research Letters, 35(2): 209-212. |
| [2] |
CHEN X F, CHEN J M, AN S Q, et al., 2007. Effects of topography on simulated net primary productivity at landscape scale[J]. Journal of Environmental Management, 85(3): 585-596.
DOI URL |
| [3] | CRAMER W, FIELD C B, 1995. Comparing global models of terrestial net primary productivity (NPP): Introduction[J]. Global Change Biology, 5(s1): 3-4. |
| [4] |
FIELD C B, RANDERSON J T, MALMSTROEM C M, 1995. Global net primary production: Combining ecology and remote sensing[J]. Remote Sensing of Environment, 51(1): 74-88.
DOI URL |
| [5] |
HURST H E, 1951. Closure to long-term storage capacity of reservoirs[J]. Transactions of the American Society of Civil Engineers, 116: 804-808.
DOI URL |
| [6] | MONTEITH J L, MOSS C J, 1977. Climate and the Efficiency of Crop Production in Britain and Discussion[J]. Philosophical Transactions of the Royal Society of London, 281(980): 277-294. |
| [7] |
MONTEITH J L, 1972. Solar Radiation and Productivity in Tropical Ecosystems[J]. Journal of Applied Ecology, 9(3): 747-766.
DOI URL |
| [8] | PENG S L, GUO Z H, WANG B S, 2000. Use of GIS and RS to estimate the light utilization efficiency of the vegetation in Guangdong, China[J]. Acta Ecologica Sinica, 20(6): 903-909. |
| [9] |
POTTER C S, RANDERSON J T, FIELD C B, et al., 1993. Terrestrial ecosystemproduction: a process model based on global satellite and surface data[J]. Global Biogeochemical Cycles, 7(4): 811-841.
DOI URL |
| [10] |
UCHIJIMA Z, SEINO H, 1985. Agroclimatic Evaluation of Net Primary Productivity of Natural Vegetations:(1) Chikugo Model for Evaluating Net Primary Productivity[J]. Journal of Agricultural Meteorology, 40(4): 343-352.
DOI URL |
| [11] | 车风, 黄国清, 刘韬, 等, 2019. 2004—2015年湖北省植被NPP时空分布特征及其与气候因素关系[J]. 水土保持研究, 26(6): 198-204, 225. |
| CHE F, HUANG G Q, LIU T, et al., 2019. Spatiotemporal distribution of net primary productivity and its correlation with meteorological factors in Hubei province from 2004 to 2015 [J]. Research of Soil and Water Conservation, 26(6): 198-204, 225. | |
| [12] | 陈强, 陈云浩, 王萌杰, 等, 2014. 2001—2010年黄河流域生态系统植被净第一性生产力变化及气候因素驱动分析[J]. 应用生态学报, 25(10): 2811-2818. |
| CHEN Q, CHEN Y H, WANG M J, et al., 2014. Change of vegetation net primary productivity in Yellow River watersheds from 2001-2010 and its climatic driving factors analysis [J]. Chinese Journal of Applied Ecology, 25(10): 2811-2818. | |
| [13] | 董丹, 倪健, 2011. 利用CASA模型模拟西南喀斯特植被净第一性生产力[J]. 生态学报, 31(7): 1855-1866. |
| DONG D, NI J, 2011. Modeling changes of net primary productivity of karst vegetation in southwestern China using the CASA model[J]. Acta Ecologica Sinica, 31(7): 1855-1866. | |
| [14] | 韩王亚, 张超, 曾源, 等, 2018. 2000—2015年拉萨河流域NPP时空变化及驱动因子[J]. 生态学报, 38(24): 8787-8798. |
| HAN W Y, ZHANG C, ZENG Y, et al., 2018. Spatio-temporal changes and driving factors in net primary productivity of Lhasa River Basin from 2000 to 2015 [J]. Acta Ecologica Sinica, 38(24): 8787-8798. | |
| [15] | 侯英雨, 柳钦火, 延昊, 等, 2007. 我国陆地植被净初级生产力变化规律及其对气候的响应[J]. 应用生态学报, 18(7): 1546-1553. |
| HOU Y Y, LIU Q H, YAN H, et al., 2007. Variation trends of China terrestrial vegetation net primary productivity and its responses to climate factors in 1982-2000 [J]. Chinese Journal of Applied Ecology, 18(7): 1546-1553. | |
| [16] | 李燕丽, 潘贤章, 王昌昆, 等, 2014. 2000—2011年广西植被净初级生产力时空分布特征及其驱动因素[J]. 生态学报, 34(18): 5220-5228. |
| LI Y L, PAN X Z, WANG C K, et al., 2014. Change of vegetation net primary productivity and its driving factors from 2000 to 2011 in Guanxi, China[J]. Acta Ecologica Sinica, 34(18): 5220-5228. | |
| [17] | 刘海江, 尹思阳, 孙聪, 等, 2015. 2000—2010年锡林郭勒草原NPP时空变化及其气候响应[J]. 草业科学, 32(11): 1709-1720. |
| LIU H J, YIN S Y, SUN C, et al., 2015. Temporal and variation of net primary productivity (NPP) and its presponses with climatic changes in the Xilingol grassland from 2000-2010 [J]. Pratacultural Science, 32(11): 1709-1720. | |
| [18] | 刘洋, 李诚志, 刘志辉, 等, 2016. 1982—2013年基于GIMMS-NDVI的新疆植被覆盖时空变化[J]. 生态学报, 36(19): 6198-6208. |
| LIU Y, LI C Z, LIU Z H, et al., 2016. Assessment of spatio-temporal variations in vegetation cover in Xinjiang from 1982 to 2013 based on GIMMS-NDVI[J]. ActaEcologica Sinica, 36(19): 6198-6208. | |
| [19] | 苗茜, 黄枚, 李仁强, 2010. 长江流域植被净初级生产力对未来气候变化的相应[J]. 自然资源学报, 25(8): 1296-1305. |
| MIAO Q, HUANG M, LI R Q, 2010. The impacts of climate change on vegetation net primary productivity of the Yangtze River Basin[J]. Journal of Natural Resources, 25(8): 1296-1305. | |
| [20] | 莫建飞, 莫伟华, 陈燕丽, 2019. 基于净初级生产力的广西喀斯特区生物多样性维护功能评价[J]. 科学技术与工程, 19(29): 371-377. |
| MO J F, MO W H, CHEN Y L, 2019. Evaluation of biodiversity maintenance function in karst area of Guangxi based on NPP[J]. Science Technology and Engineering, 19(29): 371-377. | |
| [21] | 苏宗明, 1998. 广西植被的自然环境条件对广西植被的影响[J]. 广西科学, 5(1): 51-57. |
| SU Z M, 2019. Influence of natural environmental conditions on the vegetation in Guangxi[J]. Guangxi Science, 5(1): 51-57. | |
| [22] | 索玉霞, 王正兴, 刘闯, 等, 2009. 中亚地区1982年至2002年植被指数与气温和降水的相关性分析[J]. 资源科学, 31(8): 1422-1429. |
| SUO Y X, WANG Z X, LIU C, et al., 2009. Relationship between NDVI and Precipitation and Temperature in Middle Asia during 1982-2002 [J]. Resources Science, 31(8): 1422-1429. | |
| [23] | 宋艺, 李小军, 江涛, 2017. 2008—2014年植被覆盖变化对黑河流域净初级生产力的影响研究[J]. 水土保持研究, 24(4): 204-209, 218. |
| SONG Y, LI X J, JIANG T, 2017. Effects of vegetation coverage change on net primary productivity of Heihe river basin during 2008-2014 [J]. Research of Soil and Water Conservation, 24(4): 204-209, 208. | |
| [24] | 孙红雨, 王长耀, 牛铮, 等, 1998. 中国地表植被覆盖变化及其与气候因子关系——基于NOAA时间序列数据分析[J]. 遥感学报, 2(3): 204-210. |
| SUN H Y, WANG C Y, NIU Z, et al., 1998. Analysis of the vegetation cover change and the relationship between NDVI and environment factors by using NOAA time series data[J]. Journal of Remote Sensing, 2(3): 204-210. | |
| [25] | 田慧文, 毕如田, 朱洪芬, 等, 2019. 汾河流域植被净初级生产力的驱动因素及梯度效应[J]. 生态学杂志, 38(10): 3066-3074. |
| TIAN H W, BI R T, ZHU H F, et al., 2019. Driving factors and gradient effect of net primary productivity in Fenhe River Basin[J]. Chinese Journal of Ecology, 38(10): 3066-3074. | |
| [26] | 田义超, 黄远林, 张强, 等, 2019. 北部湾南流江流域植被净初级生产力时空分布及其驱动因素[J]. 生态学报, 39(11): 1-16. |
|
TIAN Y C, HUANG Y L, ZHANG Q, et al., 2019. Spatiotemporal distribution of net primary productivity and its driving factors in the Nanliu River basin in the Beibu Gulf[J]. Acta Ecologica Sinica, 39(21): 1-16.
DOI URL |
|
| [27] | 田义超, 梁铭忠, 2016. 北部湾沿海地区植被覆盖对气温和降水的旬响应特征[J]. 自然资源学报, 31(3): 488-502. |
| TIAN Y C, LIANG M Z, 2016. The NDVI Characteristics of Vegetation and Its Ten-day Response to Temperature and Precipitation in Beibu Gulf Coastal Region[J]. Journal of Natural Resources, 31(3): 488-502. | |
| [28] | 信忠保, 许炯心, 郑伟, 2007. 气候变化和人类活动对黄土高原植被覆盖变化的影响[J]. 中国科学 (D辑),37(11): 1504-1514. |
| XIN Z B, XU J X, ZHENG W, 2007. Effects of climate change and human activities on vegetation cover change in the Loess Plateau[J]. Science in China (Series D: Earth Sciences), 37(11): 1504-1514. | |
| [29] | 王强, 张婷斌, 易桂花, 等, 2017. 横断山区2004—2014年植被NPP时空变化及其驱动因子[J]. 生态学报, 37(9): 3084-3095. |
| WANG Q, ZHANG T B, YI G H, et al., 2017. Tempo-spatial variation and driving factors analysis of net primary productivity in the Hengduan mountain area from 2004 to 2014 [J]. Acta Ecologica Sinica, 37(9): 3084-3095. | |
| [30] | 许静, 陈迪, 李文龙, 等, 2019. 基于光能利用率模型的甘南州植被净初级生产力研究[J]. 草业科学, 36(10): 2455-2465. |
| XU J, CHEN D, LI W L, et al., 2019. Study of vegetation net primary productivity in Gannan based on light use efficiency model[J]. Pratacultural Science, 36(10): 2455-2465. | |
| [31] | 赵国帅, 王军邦, 范文义, 等, 2011. 2000—2008年中国东北地区植被净初级生产力的模拟及季节变化[J]. 应用生态学报, 22(3): 621-630. |
| ZHAO G S, WANG J B, FAN W Y, et al., 2011. Vegetation net primary productivity in Northeast China in 2000-2008 [J]. Chinese Journal of Applied Ecology, 22(3): 621-630. | |
| [32] | 赵苗苗, 刘熠, 杨吉林, 等, 2019. 基于HASM的中国植被NPP时空变化特征及其与气候的关系[J]. 生态环境学报, 28(2): 215-225. |
| ZHAO M M, LIU Y, YANG J L, et al., 2019. Spatio-temporal patterns of NPP and its ralations to climate in China based on HASM[J]. Ecology and Environmental Sciences, 28(2): 215-225. | |
| [33] | 周爱萍, 向悟生, 姚月锋, 等, 2014. 广西植被净初级生产力 (NPP) 时空演变及主要影响因素分析[J]. 广西植物, 34(5): 622-628. |
| ZHOU A P, XIANG W S, YAO Y F, et al., 2014. Analyzing variation characteristics of vegetation net primary productivity (NPP) in Guangxi[J]. Guihaia, 34(5): 622-628. | |
| [34] | 周广胜, 张新时, 1996. 全球气候变化的中国自然植被的净第一性生产力研究[J]. 植物生态学报, 20(1): 11-19. |
| ZHOU G S, ZHANG X S, 1996. Study on NPP of natural vegetation in china under global climate change[J]. Acta Phytoecologica Sinica, 20(1): 11-19. | |
| [35] | 朱士华, 艳燕, 邵华, 等, 2017. 1980—2014年中亚地区植被净初级生产力对气候和CO2变化的响应[J]. 自然资源学报, 32(11): 1844-1856. |
| ZHU S H, YAN Y, SHAO H, et al., 2017. The responses of the net primary productivity of the dryland ecosystems in central Asia to the CO2 and climate changes during the past 35 years[J]. Journal of Natural Resources, 32(11): 1844-1856. | |
| [36] | 朱文泉, 潘耀忠, 阳小琼, 等, 2007a. 气候变化对中国陆地植被净初级生产力的影响分析[J]. 科学通报, 52(21): 2535-2541. |
| ZHU W Q, PAN Y Z, YANG X Q, et al., 2007. Impact of climate change on net primary productivity of terrestril vegetation in china[J]. Chinese Science Bulletin, 52(3): 2535-2541. | |
| [37] | 朱文泉, 潘耀忠, 张锦水, 2007b. 中国陆地植被净初级生产力遥感估算[J]. 植物生态学报, 31(3): 413-424. |
| ZHU W Q, PAN Y Z, ZHANG J S, 2007. Estimation of net primary productivity of chinese terrestrial vegetation based on remote sensing[J]. Journal of Plant Ecology, 31(3): 413-424. |
| [1] | 郝蕾, 翟涌光, 戚文超, 兰穹穹. 2001-2020年内蒙古植被碳源/碳汇时空动态及对气候因子的响应[J]. 生态环境学报, 2023, 32(5): 825-834. |
| [2] | 王超, 杨倩楠, 张池, 刘同旭, 张晓龙, 陈静, 刘科学. 丹霞山不同土地利用方式土壤磷组分特征及其有效性[J]. 生态环境学报, 2023, 32(5): 889-897. |
| [3] | 李建辉, 党争, 陈琳. 黄河几字弯都市圈PM2.5时空特征及影响因素分析[J]. 生态环境学报, 2023, 32(4): 697-705. |
| [4] | 张林, 齐实, 周飘, 伍冰晨, 张岱, 张岩. 北京山区针阔混交林地土壤有机碳含量的影响因素研究[J]. 生态环境学报, 2023, 32(3): 450-458. |
| [5] | 何艳虎, 龚镇杰, 吴海彬, 蔡宴朋, 杨志峰, 陈晓宏. 粤港澳大湾区城市生态效率时空演变及影响因素[J]. 生态环境学报, 2023, 32(3): 469-480. |
| [6] | 郝金虎, 韦玮, 李胜男, 马牧源, 李肖夏, 杨洪国, 姜琦宇, 柴沛东. 基于GEE平台的京津冀长时序水体时空格局及其影响因素[J]. 生态环境学报, 2023, 32(3): 556-566. |
| [7] | 张莉, 李铖, 谭皓泽, 韦家怡, 程炯, 彭桂香. 广州典型城市林地对大气颗粒物的削减效应及影响因素[J]. 生态环境学报, 2023, 32(2): 341-350. |
| [8] | 郑晓豪, 陈颖彪, 郑子豪, 郭城, 黄卓男, 周泳诗. 湖北省生态系统服务价值动态变化及其影响因素演变[J]. 生态环境学报, 2023, 32(1): 195-206. |
| [9] | 袁林江, 李梦博, 冷钢, 钟冰冰, 夏大朋, 王景华. 厌氧环境下硫酸盐还原与氨氧化的协同作用[J]. 生态环境学报, 2023, 32(1): 207-214. |
| [10] | 刘希林, 卓瑞娜. 崩岗崩积体坡面初始产流时间影响因素及其临界阈值[J]. 生态环境学报, 2023, 32(1): 36-46. |
| [11] | 李威闻, 黄金权, 齐瑜洁, 刘小岚, 刘纪根, 毛治超, 高绣纺. 土壤侵蚀条件下土壤微生物生物量碳含量变化及其影响因素的Meta分析[J]. 生态环境学报, 2023, 32(1): 47-55. |
| [12] | 苏泳松, 宋松, 陈叶, 叶子强, 钟润菲, 王昭尧. 珠江三角洲人类活动净氮输入时空特征及其影响因素[J]. 生态环境学报, 2022, 31(8): 1599-1609. |
| [13] | 陈文裕, 夏丽华, 徐国良, 余世钦, 陈行, 陈金凤. 2000—2020年珠江流域NDVI动态变化及影响因素研究[J]. 生态环境学报, 2022, 31(7): 1306-1316. |
| [14] | 李登科, 王钊. 气候变化和人类活动对陕西省植被NPP影响的定量分析[J]. 生态环境学报, 2022, 31(6): 1071-1079. |
| [15] | 段文军, 李达, 李冲. 5种不同林龄尾巨桉人工林林下植物多样性及其影响因素分析[J]. 生态环境学报, 2022, 31(5): 857-864. |
| 阅读次数 | ||||||
|
全文 |
|
|||||
|
摘要 |
|
|||||