生态环境学报 ›› 2025, Vol. 34 ›› Issue (12): 1930-1943.DOI: 10.16258/j.cnki.1674-5906.2025.12.010
李清云1( ), 肖亦敏1, 林卫2,4, 雷金睿2,5,*(), 王韫镭3, 孔玫蔓1, 杨云芳1
收稿日期:2025-07-08
出版日期:2025-12-18
发布日期:2025-12-10
通讯作者:
*E-mail:raykingre@163.com
作者简介:李清云(1987年生),女,博士研究生,研究方向为湿地生态与水环境科学。E-mail: lqy181268@126.com
基金资助:
LI Qingyun1(), XIAO Yimin1, LIN Wei2,4, LEI Jinrui2,5,*(), WANG Yunlei3, KONG Meiman1, YANG Yunfang1
Received:2025-07-08
Online:2025-12-18
Published:2025-12-10
摘要: 土地利用景观是影响城市重要水域水质分布的关键因素,精确、高效监测水域水质对解释水质与景观格局之间的相关性具有重要意义,同时也是水质监管与治理的重要基础。选取海口市长钦湖为研究区,通过同步采集水质样品与无人机多光谱遥感数据,建立旱、雨季湿地水体总磷(TP)、总氮(TN)、浊度(TUB)和叶绿素a(Chl-a)浓度的最优反演模型,生成水体水质参数的空间分布,并分析其空间变化与景观格局的相互关系。结果表明,1)长钦湖湿地旱、雨季TP、TN、Chl-a反演模型均以多项式模型呈现最优精度,在TN反演模型中旱季以线性回归模型精度最优,在TUB反演模型中雨季以幂函数回归模型精度最高,反演结果显示长钦湖水质污染程度轻、状况较好。2)长钦湖水质参数存在一定时空变异特性,TP、TN、Chl-a平均及最大浓度雨季大于旱季,TUB平均及最大浓度旱季显著大于雨季。3)缓冲区尺度120 m为长钦湖景观变化重要节点,随缓冲区扩大,AI、LPI值递增,CONTAG、SHDI、SHEI值递减,DIVISION、PD、LSI先减后增,120 m后景观异质性与破碎化程度随半径增大而升高。4)旱季在特定尺度内水质参数与建设用地、旱地、LPI具有相关性;雨季TP、TUB浓度与各景观类型及格局指数无相关性,TN浓度与道路、PD、SHDI显著正相关,Chl-a浓度与建设用地呈正相关。研究成果可为城市重点湿地水质的高效监测及保护工作提供科学层面的支撑。
中图分类号:
李清云, 肖亦敏, 林卫, 雷金睿, 王韫镭, 孔玫蔓, 杨云芳. 基于无人机多光谱数据的海口长钦湖水质参数遥感反演及其与景观格局的相互关系[J]. 生态环境学报, 2025, 34(12): 1930-1943.
LI Qingyun, XIAO Yimin, LIN Wei, LEI Jinrui, WANG Yunlei, KONG Meiman, YANG Yunfang. Remote Sensing Inversion of Water Quality Parameters and Their Correlation with Landscape Patterns in Haikou Changqin Lake Based on UAV Multispectral Data[J]. Ecology and Environmental Sciences, 2025, 34(12): 1930-1943.

图1 研究区位置及土地利用分布图
Figure 1 Location of the study area and distribution of sampling points

图2 研究区水质采样点与无人机多光谱
Figure 2 Water quality sampling points and UAV multispectral in the study area
| 光谱参数 | 计算公式 | 光谱参数 | 计算公式 |
|---|---|---|---|
| V1 | R1 | V9 | (R2+R3)/R5 |
| V2 | R2 | V10 | (R2+R3)R5 |
| V3 | R3 | V11 | R1/(R5+R2) |
| V4 | R4 | V12 | R2+R3 |
| V5 | R5 | V13 | R2+R3+R5 |
| V6 | R3/R2 | V14 | R3/R5 |
| V7 | R2+R5 | V15 | R2/R1 |
| V8 | (R3+R5)/R2 | V16 | R5/R1 |
表1 光谱参数及组合计算式表达
Table 1 The computational expressions for spectral parameters and their combinations
| 光谱参数 | 计算公式 | 光谱参数 | 计算公式 |
|---|---|---|---|
| V1 | R1 | V9 | (R2+R3)/R5 |
| V2 | R2 | V10 | (R2+R3)R5 |
| V3 | R3 | V11 | R1/(R5+R2) |
| V4 | R4 | V12 | R2+R3 |
| V5 | R5 | V13 | R2+R3+R5 |
| V6 | R3/R2 | V14 | R3/R5 |
| V7 | R2+R5 | V15 | R2/R1 |
| V8 | (R3+R5)/R2 | V16 | R5/R1 |

图3 光谱参数与水质要素的相关性分析 TP、TN、TUB和Chl-a分别表示总磷、总氮、浊度和叶绿素a;*、**分别表示在0.05、0.01水平上显著相关。下同
Figure 3 Correlation analysis of spectral parameters and water quality factors
| 水质要素 | 旱季模型 | TP模型表达式 | r | RMSE | 水质要素 | 雨季模型 | 模型表达式 | r | RMSE |
|---|---|---|---|---|---|---|---|---|---|
| TP | UTP1 | y=0.001x−0.296 | 0.0793 | 0.258 | TP | UTP15 | y=1.166x−1.950 | 0.4767 | 0.080 |
| ETP1 | y=0.067e0.001x | 0.0578 | 0.690 | ETP15 | y=0.002e2.652x | 0.4202 | 0.203 | ||
| PTP1 | y=0.153×10−3x1.091 | 0.0330 | 0.699 | PTP15 | y =0.009x5.366 | 0.4152 | 0.204 | ||
| PLTP1 | y=9.204×10−6x2−0.019x+9.799 | 0.6686 | 0.156 | PLTP15 | y=5.429x2−20.958x+20.568 | 0.5364 | 0.076 | ||
| TN | UTN8 | y= −18.983x+27.059 | 0.6313 | 0.656 | TN | UTN4 | y= −0.008x+10.210 | 0.4578 | 0.748 |
| ETN8 | y=1.515×10⁵e−8.607x | 0.5964 | 0.320 | ETN4 | y=63.535e−0.004x | 0.4623 | 0.328 | ||
| PTN8 | y=40.683x−11.327 | 0.6008 | 0.319 | PTN4 | y=1.311×10⁹x −2.952 | 0.4309 | 0.337 | ||
| PLTN8 | y=133.490x2−369.451x+256.818 | 0.7158 | 0.582 | PLTN4 | y= −4.206×10−5x2+0.064x−20.474 | 0.5806 | 0.665 | ||
| TUB | UTUB14 | y= −8.585x+24.670 | 0.1661 | 2.198 | TUB | UTUB5 | y=0.048x−49.652 | 0.8828 | 1.824 |
| ETUB14 | y=1.162×10²e−1.444x | 0.2347 | 0.298 | ETUB5 | y=0.160e0.003x | 0.8184 | 0.163 | ||
| PTUB14 | y=35.051x−2.385 | 0.2066 | 0.303 | PTUB5 | y=5.709×10−14x4.601 | 0.8396 | 0.154 | ||
| PLTUB14 | y= −101.361x2+349.731x−290.720 | 0.6497 | 1.440 | PLTUB5 | y= −2.591×10−5x2+0.119x−98.470 | 0.8885 | 1.798 | ||
| Chl-a | UCHL14 | y=22.879x−37.235 | 0.4177 | 2.787 | Chl-a | UCHL9 | y= −5.989x +36.235 | 0.3067 | 4.193 |
| ECHL14 | y=1.804×10⁻⁶e7.790x | 0.3154 | 1.184 | ECHL9 | y=148.488e−0.680x | 0.1614 | 0.722 | ||
| PCHL14 | y=0.001x13.567 | 0.3068 | 1.192 | PCHL9 | y=1506.542x−3.566 | 0.1819 | 0.713 | ||
| PLCHL14 | y=213.491x2−732.793x+629.278 | 0.7241 | 1.939 | PLCHL9 | y=14.054x2−145.658x+380.245 | 0.6299 | 3.096 |
表2 水质参数反演模型
Table 2 Inversion model of water quality parameters
| 水质要素 | 旱季模型 | TP模型表达式 | r | RMSE | 水质要素 | 雨季模型 | 模型表达式 | r | RMSE |
|---|---|---|---|---|---|---|---|---|---|
| TP | UTP1 | y=0.001x−0.296 | 0.0793 | 0.258 | TP | UTP15 | y=1.166x−1.950 | 0.4767 | 0.080 |
| ETP1 | y=0.067e0.001x | 0.0578 | 0.690 | ETP15 | y=0.002e2.652x | 0.4202 | 0.203 | ||
| PTP1 | y=0.153×10−3x1.091 | 0.0330 | 0.699 | PTP15 | y =0.009x5.366 | 0.4152 | 0.204 | ||
| PLTP1 | y=9.204×10−6x2−0.019x+9.799 | 0.6686 | 0.156 | PLTP15 | y=5.429x2−20.958x+20.568 | 0.5364 | 0.076 | ||
| TN | UTN8 | y= −18.983x+27.059 | 0.6313 | 0.656 | TN | UTN4 | y= −0.008x+10.210 | 0.4578 | 0.748 |
| ETN8 | y=1.515×10⁵e−8.607x | 0.5964 | 0.320 | ETN4 | y=63.535e−0.004x | 0.4623 | 0.328 | ||
| PTN8 | y=40.683x−11.327 | 0.6008 | 0.319 | PTN4 | y=1.311×10⁹x −2.952 | 0.4309 | 0.337 | ||
| PLTN8 | y=133.490x2−369.451x+256.818 | 0.7158 | 0.582 | PLTN4 | y= −4.206×10−5x2+0.064x−20.474 | 0.5806 | 0.665 | ||
| TUB | UTUB14 | y= −8.585x+24.670 | 0.1661 | 2.198 | TUB | UTUB5 | y=0.048x−49.652 | 0.8828 | 1.824 |
| ETUB14 | y=1.162×10²e−1.444x | 0.2347 | 0.298 | ETUB5 | y=0.160e0.003x | 0.8184 | 0.163 | ||
| PTUB14 | y=35.051x−2.385 | 0.2066 | 0.303 | PTUB5 | y=5.709×10−14x4.601 | 0.8396 | 0.154 | ||
| PLTUB14 | y= −101.361x2+349.731x−290.720 | 0.6497 | 1.440 | PLTUB5 | y= −2.591×10−5x2+0.119x−98.470 | 0.8885 | 1.798 | ||
| Chl-a | UCHL14 | y=22.879x−37.235 | 0.4177 | 2.787 | Chl-a | UCHL9 | y= −5.989x +36.235 | 0.3067 | 4.193 |
| ECHL14 | y=1.804×10⁻⁶e7.790x | 0.3154 | 1.184 | ECHL9 | y=148.488e−0.680x | 0.1614 | 0.722 | ||
| PCHL14 | y=0.001x13.567 | 0.3068 | 1.192 | PCHL9 | y=1506.542x−3.566 | 0.1819 | 0.713 | ||
| PLCHL14 | y=213.491x2−732.793x+629.278 | 0.7241 | 1.939 | PLCHL9 | y=14.054x2−145.658x+380.245 | 0.6299 | 3.096 |

图4 旱季反演模型拟合图
Figure 4 Fitting diagram of the inversion model in the dry season

图5 雨季反演模型拟合图
Figure 5 Fitting diagram of the inversion model in the rainy season
| 水质要素 | 旱季模型 | TP回归方程 | r | 回归方程斜率 | 水质要素 | 雨季模型 | TP回归方程 | r | 回归方程斜率 |
|---|---|---|---|---|---|---|---|---|---|
| TP | UTP1 | y=0.072x+0.839 | 0.0374 | 0.0720 | TP | UTP15 | y=0.354x+0.267 | 0.5377 | 0.3539 |
| ETP1 | y=0.018x+0.208 | 0.0610 | 0.0183 | ETP15 | y=0.398x+0.277 | 0.6183 | 0.3979 | ||
| PTP1 | y=0.023x+0.330 | 0.0391 | 0.0232 | PTP15 | y=0.356x+0.259 | 0.6023 | 0.3557 | ||
| PLTP1 | y=0.442x+0.215 | 0.5356 | 0.4421 | PLTP15 | y=0.472x+0.230 | 0.7627 | 0.4715 | ||
| TN | UTN8 | y=0.667x+0.577 | 0.7745 | 0.6677 | TN | UTN4 | y=0.533x+1.511 | 0.5917 | 0.5327 |
| ETN8 | y=0.530x+0.744 | 0.7403 | 0.5298 | ETN4 | y=0.440x+0.756 | 0.5063 | 0.4403 | ||
| PTN8 | y=0.529x+0.745 | 0.7345 | 0.5288 | PTN4 | y=0.525x+1.358 | 0.4906 | 0.5247 | ||
| PLTN8 | y=0.545x+0.796 | 0.6691 | 0.5452 | PLTN4 | y=0.909x−0.284 | 0.6802 | 0.9085 | ||
| TUB | UTUB14 | y=0.262x+7.042 | 0.2844 | 0.2616 | TUB | UTUB5 | y=0.838x−0.888 | 0.9642 | 0.8376 |
| ETUB14 | y=0.363x+5.800 | 0.2311 | 0.3634 | ETUB5 | y=0.729x−2.597 | 0.9809 | 0.7294 | ||
| PTUB14 | y=0.330x+6.113 | 0.2135 | 0.3300 | PTUB5 | y=1.183x−5.147 | 0.9821 | 1.1825 | ||
| PLTUB14 | y=0.671x+2.792 | 0.7670 | 0.6713 | PLTUB5 | y=0.759x−0.620 | 0.9414 | 0.7592 | ||
| Chl-a | UCHL14 | y=0.465x+2.120 | 0.6844 | 0.4654 | Chl-a | UCHL9 | y=0.467x+3.825 | 0.2836 | 0.4674 |
| ECHL14 | y=0.493x+1.039 | 0.8304 | 0.4932 | ECHL9 | y=0.278x+3.650 | 0.3460 | 0.2784 | ||
| PCHL14 | y=0.588x+1.432 | 0.8163 | 0.5877 | PCHL9 | y=0.294x+3.516 | 0.3669 | 0.2944 | ||
| PLCHL14 | y=0.940x+0.461 | 0.8416 | 0.9395 | PLCHL9 | y=0.546x+2.479 | 0.6691 | 0.5456 |
表3 水质参数反演模型精度检验
Table 3 Accuracy test of inversion model for water quality parameters
| 水质要素 | 旱季模型 | TP回归方程 | r | 回归方程斜率 | 水质要素 | 雨季模型 | TP回归方程 | r | 回归方程斜率 |
|---|---|---|---|---|---|---|---|---|---|
| TP | UTP1 | y=0.072x+0.839 | 0.0374 | 0.0720 | TP | UTP15 | y=0.354x+0.267 | 0.5377 | 0.3539 |
| ETP1 | y=0.018x+0.208 | 0.0610 | 0.0183 | ETP15 | y=0.398x+0.277 | 0.6183 | 0.3979 | ||
| PTP1 | y=0.023x+0.330 | 0.0391 | 0.0232 | PTP15 | y=0.356x+0.259 | 0.6023 | 0.3557 | ||
| PLTP1 | y=0.442x+0.215 | 0.5356 | 0.4421 | PLTP15 | y=0.472x+0.230 | 0.7627 | 0.4715 | ||
| TN | UTN8 | y=0.667x+0.577 | 0.7745 | 0.6677 | TN | UTN4 | y=0.533x+1.511 | 0.5917 | 0.5327 |
| ETN8 | y=0.530x+0.744 | 0.7403 | 0.5298 | ETN4 | y=0.440x+0.756 | 0.5063 | 0.4403 | ||
| PTN8 | y=0.529x+0.745 | 0.7345 | 0.5288 | PTN4 | y=0.525x+1.358 | 0.4906 | 0.5247 | ||
| PLTN8 | y=0.545x+0.796 | 0.6691 | 0.5452 | PLTN4 | y=0.909x−0.284 | 0.6802 | 0.9085 | ||
| TUB | UTUB14 | y=0.262x+7.042 | 0.2844 | 0.2616 | TUB | UTUB5 | y=0.838x−0.888 | 0.9642 | 0.8376 |
| ETUB14 | y=0.363x+5.800 | 0.2311 | 0.3634 | ETUB5 | y=0.729x−2.597 | 0.9809 | 0.7294 | ||
| PTUB14 | y=0.330x+6.113 | 0.2135 | 0.3300 | PTUB5 | y=1.183x−5.147 | 0.9821 | 1.1825 | ||
| PLTUB14 | y=0.671x+2.792 | 0.7670 | 0.6713 | PLTUB5 | y=0.759x−0.620 | 0.9414 | 0.7592 | ||
| Chl-a | UCHL14 | y=0.465x+2.120 | 0.6844 | 0.4654 | Chl-a | UCHL9 | y=0.467x+3.825 | 0.2836 | 0.4674 |
| ECHL14 | y=0.493x+1.039 | 0.8304 | 0.4932 | ECHL9 | y=0.278x+3.650 | 0.3460 | 0.2784 | ||
| PCHL14 | y=0.588x+1.432 | 0.8163 | 0.5877 | PCHL9 | y=0.294x+3.516 | 0.3669 | 0.2944 | ||
| PLCHL14 | y=0.940x+0.461 | 0.8416 | 0.9395 | PLCHL9 | y=0.546x+2.479 | 0.6691 | 0.5456 |
| 水质参数 | 季节 | 最大值 | 最小值 | 平均值 | 标准差 |
|---|---|---|---|---|---|
| ρ(TP)/ (mg·L−1) | 旱季 | 1.20 | 0.01 | 0.28 | 0.22 |
| 雨季 | 0.62 | 0.34 | 0.48 | 0.07 | |
| ρ(TN)/ (mg·L−1) | 旱季 | 5.72 | 1.25 | 2.57 | 0.75 |
| 雨季 | 3.87 | 1.66 | 3.47 | 0.43 | |
| ρ(TUB)/ (mg·L−1) | 旱季 | 10.95 | 1.85 | 9.07 | 1.55 |
| 雨季 | 3.47 | 0.84 | 1.57 | 0.54 | |
| ρ(Chl-a)/ (μg·L−1) | 旱季 | 20.79 | 0.46 | 4.83 | 3.48 |
| 雨季 | 13.67 | 2.85 | 6.14 | 2.02 |
表4 长钦湖各项水质参数统计表
Table 4 Statistical table of various water quality parameters in Changqin Lake
| 水质参数 | 季节 | 最大值 | 最小值 | 平均值 | 标准差 |
|---|---|---|---|---|---|
| ρ(TP)/ (mg·L−1) | 旱季 | 1.20 | 0.01 | 0.28 | 0.22 |
| 雨季 | 0.62 | 0.34 | 0.48 | 0.07 | |
| ρ(TN)/ (mg·L−1) | 旱季 | 5.72 | 1.25 | 2.57 | 0.75 |
| 雨季 | 3.87 | 1.66 | 3.47 | 0.43 | |
| ρ(TUB)/ (mg·L−1) | 旱季 | 10.95 | 1.85 | 9.07 | 1.55 |
| 雨季 | 3.47 | 0.84 | 1.57 | 0.54 | |
| ρ(Chl-a)/ (μg·L−1) | 旱季 | 20.79 | 0.46 | 4.83 | 3.48 |
| 雨季 | 13.67 | 2.85 | 6.14 | 2.02 |

图6 长钦湖各项水质参数反距离插值图
Figure 6 Inverse distance interpolation map of various water quality parameters in Changqin Lake
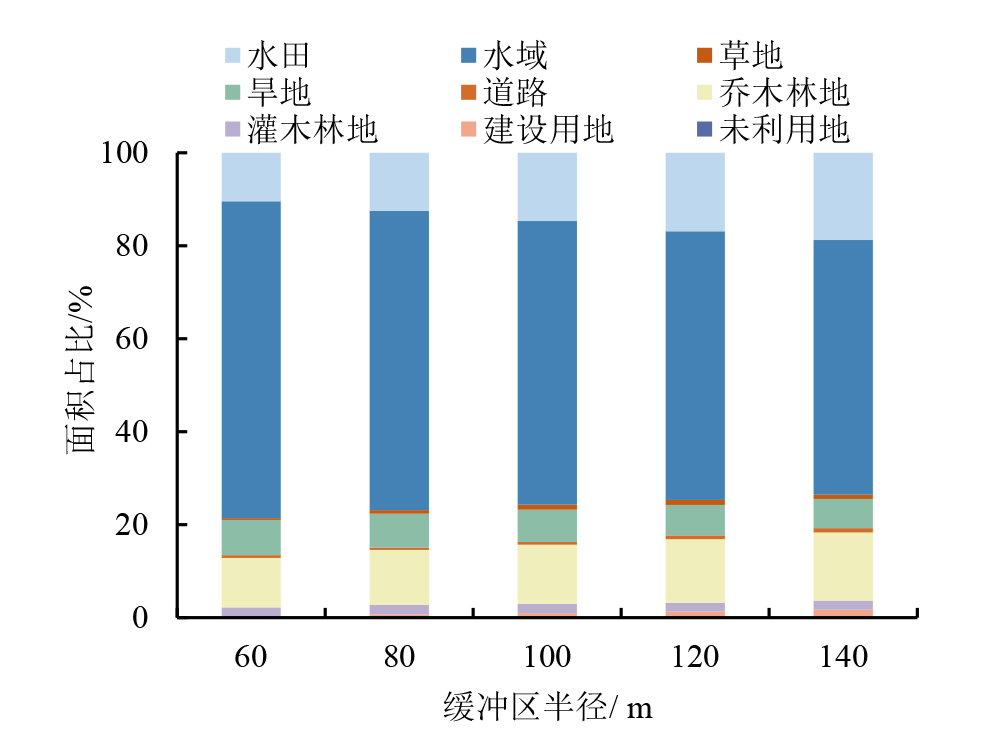
图7 长钦湖不同缓冲区景观类型组成
Figure 7 Composition of landscape types in different buffer zones of Changqin Lake

图8 长钦湖不同缓冲区景观指数变化
Figure 8 Changes in landscape indices of different buffer zones in Changqin Lake

图9 景观类型与水质参数的相关性分析
Figure 9 Correlation analysis between landscape types and water quality parameters

图10 景观格局与水质参数的相关性分析
Figure 10 Correlation analysis between landscape patterns and water quality parameters
| [1] |
CHENG X, SONG J P, YAN J Z, 2023. Influences of landscape pattern on water quality at multiple scales in an agricultural basin of western China[J]. Environmental Pollution, 319: 120986.
DOI URL |
| [2] |
DOU J H, XIA R, CHEN Y, et al., 2022. Mixed spatial scale effects of landscape structure on water quality in the Yellow River[J]. Journal of Cleaner Production, 368: 133008.
DOI URL |
| [3] |
DE KEUKELAERE L, MOELANS R, KNAEPS E, et al., 2023. Airborne drones for water quality mapping in inland, transitional and coastal waters—MapEO water data processing and validation[J]. Remote Sensing, 15(5): 1345.
DOI URL |
| [4] |
GHOLIZADEH M H, MELESSE A M, REDDI L, 2016. A comprehensive review on water quality parameters estimation using remote sensing techniques[J]. Sensors, 16(8): 1298.
DOI URL |
| [5] |
HOU Y, ZHANG A, LV R, et al., 2023. Machine learning algorithm inversion experiment and pollution analysis of water quality parameters in urban small and medium-sized rivers based on UAV multispectral data[J]. Environmental Science and Pollution Research, 30(32): 78913-78932.
DOI |
| [6] | HAN H J, YAN X, XIE H W, et al., 2023. Incorporating a new landscape intensity indicator into landscape metrics to better understand controls of water quality and optimal width of riparian buffer zone[J]. Journal of Hydrology, 625(Part B): 130088. |
| [7] |
JONES E R, BIERKENS M F P, VAN P P J T M, et al., 2023. Sub-Saharan Africa will increasingly become the dominant hotspot of surface water pollution[J]. Nature Water, 1(7): 602-613.
DOI |
| [8] | LUNT J, SMEED L, 2019. Turbidity alters estuarine biodiversity and species composition[J]. Journal of Marine Science, 77(1): 379-387. |
| [9] |
LEE S, MCCARTT G W, MOGLEN G E, et al., 2020. Assessing the effectiveness of riparian buffers for reducing organic nitrogen loads in the Coastal Plain of the Chesapeake Bay watershed using a watershed model[J]. Journal of Hydrology, 585: 124779.
DOI URL |
| [10] |
LAURA S M, IZAGUIRRE I, ZAGARESE H, et al., 2023. Drivers of planktonic chlorophyll a in pampean shallow lakes[J]. Ecological Indicators, 146: 109834.
DOI URL |
| [11] |
MA T, SUN S A, FU G T, et al., 2020. Pollution exacerbates China’s water scarcity and its regional inequality[J]. Nature Communications, 11(1): 650.
DOI |
| [12] |
MISHRA A, ALNAHIT A, CAMPBELL B, 2021. Impact of land uses, drought, flood, wildfire, and cascading events on water quality and microbial communities: A review and analysis[J]. Journal of Hydrology, 596: 125707.
DOI URL |
| [13] |
SIRABAHENDA Z, ST-HILAIRE A, COURTENAY S C, et al., 2020. Assessment of the effective width of riparian buffer strips to reduce suspended sediment in an agricultural landscape using ANFIS and SWAT models[J]. Catena, 195: 104762.
DOI URL |
| [14] |
WANG J, FU Z, QIAO H, et al., 2019. Assessment of eutrophication and water quality in the estuarine area of Lake Wuli, Lake Taihu, China[J]. Science of the Total Environment, 650(Part 1): 1392-1402.
DOI URL |
| [15] |
XU Q Y, YAN T Z, WANG C Y, et al., 2023. Managing landscape patterns at the riparian zone and sub-basin scale is equally important for water quality protection[J]. Water Research, 229: 119280.
DOI URL |
| [16] |
ZHANG J, LI S, DONG R, et al., 2019. Influences of land use metrics at multi-spatial scales on seasonal water quality: A case study of river systems in the Three Gorges Reservoir Area, China[J]. Journal of Cleaner Production, 206: 76-85.
DOI URL |
| [17] |
ZHANG F, CHEN Y, WANG W W, et al., 2022. Impact of land-use/land-cover and landscape pattern on seasonal in-stream water quality in small watersheds[J]. Journal of Cleaner Production, 357: 131907.
DOI URL |
| [18] |
ZOU W, ZHU G, XU H, et al., 2022. Elucidating phytoplankton limiting factors in lakes and reservoirs of the Chinese Eastern Plains ecoregion[J]. Journal of Environmental Management, 318: 115542.
DOI URL |
| [19] |
ZHANG H X, CAO X H, HUO S, et al., 2023. Changes in China’s river water quality since 1980: Management implications from sustainable development[J]. npj Clean Water, 6(1): 45.
DOI |
| [20] | 范雅双, 于婉晴, 张婧, 等, 2021. 太湖上游水源区河流水质对景观格局变化的响应关系——以东苕溪上游为例[J]. 湖泊科学, 33(5): 1478-1489. |
|
FAN Y S, YU W Q, ZHANG J, et al., 2021. Response of water quality to landscape pattern change in the water source area of upper reaches of lake Taihu: A case study in the upper reaches of Dongtiaoxi River[J]. Journal of Lake Sciences, 33(5): 1478-1489.
DOI URL |
|
| [21] | 黄华, 李茂亿, 陈吟晖, 等, 2021. 基于PLSR的珠江口城市河流水质高光谱反演[J]. 水资源保护, 37(5): 36-42. |
| HUANG H, LI M Y, CHEN Y H, et al., 2021. Water quality retrieval by hyperspectral for city rivers in Pearl River Estuary based on partial least squares regression[J]. Water Resources Protection, 37(5): 36-42. | |
| [22] | 胡艳芳, 范中亚, 陈昭婷, 等, 2021. 汕头市练江流域景观格局与水质的关联分析[J]. 中国环境监测, 37(3): 126133. |
| HU Y F, FANG Z Y, CHEN Z T, et al., 2021. Correlation Analysis Between Landscape Pattern and Water Quality in the Lianjiang River Watershed in Shantou City[J]. Environmental Monitoring in China, 37(3): 126133. | |
| [23] | 胡丛巧, 迪丽努尔·阿吉, 李茹霞, 等, 2025. 博斯腾湖不同时空尺度下土地利用景观格局对水质的影响[J]. 水生态学杂志, 46(1): 34-44. |
| HU C Q, DILINUER A, LI R X, et al., 2025. Effect of land use pattern on water quality in Bosten Lake at different temporal and spatial scales[J]. Journal of Hydroecology, 46(1): 34-44. | |
| [24] | 刘彦君, 夏凯, 冯海林, 等, 2019. 基于无人机多光谱影像的小微水域水质要素反演[J]. 环境科学学报, 39(4): 1241-1249. |
| LIU Y J, XIA K, FENG H L, et al., 2019. Inversion of water quality elements in small and micro-size water region using multispectral image by UAV[J]. Acta Scientiae Circumstantiae, 39(4): 1241-1249. | |
| [25] | 李雪, 张婧, 于婉晴, 等, 2021. 京杭运河杭州段城市景观格局对河网水环境的影响[J]. 生态学报, 41(13): 5242-5253. |
| LI X, ZHANG J, YU W Q, et al., 2021. Impact of the urban landscape pattern in the Hangzhou Section of the Beijing-Hangzhou Grand Canal on the river aquatic environment[J]. Acta Ecologica Sinica, 41(13): 5242-5253. | |
| [26] | 刘智琦, 潘保柱, 韩谞, 等, 2022. 青藏高原湖泊水环境特征及水质评价[J]. 环境科学, 43(11): 5073-5083. |
|
LIU Z Q, PAN B Z, HAN X, et al., 2022. Water environmental characteristics and water quality assessment of Lakes in Tibetan Plateau[J]. Environmental Science, 43(11): 5073-5083.
DOI URL |
|
| [27] | 刘小欢, 张文, 郑和松, 等, 2024. 1980-2020年长江中游阳新县湖群湿地景观格局演变及影响因素[J]. 西北林学院学报, 39(3): 239-247. |
| LIU X H, ZHANG W, ZHENG H S, et al., 2024. Driving force analysis of wetland landscape pattern changes of the Lakes inYangxin in the middle reaches of Yangtze River from 1980 to 2020[J]. Journal of North west Forestry University, 39(3): 239-247. | |
| [28] | 时浩南, 梅琨, 吴宇鹏, 等, 2024. 温瑞塘河流域景观格局对水质影响的空间尺度效应[J]. 环境科学学报, 44(12): 390-402. |
| SHI H N, MEI K, WU Y P, et al., 2024. The spatial scale effects of landscape pattern on water quality in the Wen-Rui Tang River watershed[J]. Acta Scientiae Circumstantiae, 44(12): 390-402. | |
| [29] | 宋继鹏, 2022. 景观格局与河流水质的关系研究——以重庆市龙溪河流域为例[D]. 重庆: 西南大学. |
| SONG J P, 2020. Study on the relationship between landscape pattern and river water quality: A case study of the Longxi River Basin in Chongqing[D]. Chongqing: Southwest University. | |
| [30] | 邬建国, 2007. 景观生态学—格局、过程、尺度与等级[M]. 第2版. 北京: 高等教育出版社. |
| WU J G, 2007. Landscape ecology:Pattern, process, scale and hierarchy[M]. Second Edition. .Beijing: Higher Education Press. | |
| [31] |
吴艾璞, 马春子, 霍守亮, 等, 2025. 河岸带景观格局对密云水库流域河流水质的影响[J]. 地理学报, 80(3): 724-741.
DOI |
|
WU A P, MA C Z, HUO S L, et al., 2025. Impact of riparian landscape patterns on river water quality in the Miyun Reservoir Basin[J]. Acta Geographica Sinica, 80(3): 724-741.
DOI |
|
| [32] | 中华人民共和国环境保护部, 2002. GB 3838—2002中华人民共和国地表水环境质量标准[S]. 北京: 中国环境科学出版社出版. |
| Ministry of Environmental Protection of the People’s Republic of China, 2002. GB 3838—2002 Environmental quality standards for surfacewater of the People’s Republic of China[S]. Being: China Environmental Science Press. | |
| [33] | 张乐, 雷金睿, 陈毅青, 等, 2023. 基于无人机多光谱数据的水质参数反演与评价——以海口市永庄水库为例[J]. 中国环境科学, 43(S1): 258-267. |
| ZHANG L, LEI J R, CHEN Y Q, et al., 2023. Inversion and evaluation of water quality parameters based on UAV multispectral data: A case study of Yongzhuang Reservoir in Haikou[J]. China Environmental Science, 43(S1): 258-267. | |
| [34] | 章佩丽, 宋亮楚, 王昱, 等, 2022. 基于无人机多光谱的城市水体典型河道水质参数反演模型构建[J]. 环境污染与防治, 44(10): 1351-1356. |
| ZHANG P L, SONG L C, WANG Y, et al., 2022. Establishment of Inversion model for water quality parameters in typical urban rivers based on unmanned aerial vehicle multispectral data[J]. Environmental Pollution & Control, 44(10): 1351-1356. | |
| [35] | 张伟燕, 马龙, 吉力力·阿不都外力, 等, 2019. 博尔塔拉河地表水重金属来源分析及其污染评价[J]. 干旱区资源与环境, 33(7): 100-106. |
| ZHANG W Y, MA L, JILILI A, et al., 2019. Source analysis and pollution assessment of heavy metals in surface water of Bortala River[J]. Journal of Arid Land Resources and Environment, 33(7): 100-106. | |
| [36] | 周添红, 苏思霖, 马凯, 等, 2024. 典型区域土地利用/景观格局对黄河上游水体TN的影响[J]. 环境科学, 45(10): 5768-5776. |
| ZHOU T H, SU S L, MA K, et al., 2024. Influence of typical regional land use/landscape pattern on water TN of the upper Yellow River[J]. Environmental Science, 45(10): 5768-5776. | |
| [37] | 朱云芳, 朱利, 李家国, 等, 2017. 基于GF-1 WFV影像和BP神经网络的太湖叶绿素a反演[J]. 环境科学学报, 37(1): 130-137. |
| ZHU Y F, ZHU L, LI J G, et al., 2017. The study of inversion of chlorophyll a in Taihu based on GF-1 WFV image and BP neural network[J]. Acta Scientiae Circumstantiae, 37(1): 130-137. |
| [1] | 杨昊彧, 黄康江, 陈晓东, 赵劼, 熊军, 田康. 贵州省生态空间效率演变及景观格局的影响归因[J]. 生态环境学报, 2025, 34(6): 902-913. |
| [2] | 刘鸿林, 赵方凯, 杨磊, 沈琳钧, 杨恺丰, 李敏, 陈利顶. 城市公园土壤重金属污染及影响因素研究——以宁波市为例[J]. 生态环境学报, 2025, 34(5): 773-783. |
| [3] | 周乐乐, 万霞, 丁黎明, 魏星宇, 王建平, 陈静, 李鑫, 樊敏, 黎猛, 喻萧斌. 四川省碳排放-碳储存与碳供需比空间分布特征研究[J]. 生态环境学报, 2025, 34(3): 368-379. |
| [4] | 张任菲, 肖萌, 刘志成. 京津冀地区景观破碎化的时空异质性及驱动因素研究[J]. 生态环境学报, 2025, 34(3): 461-473. |
| [5] | 王宗阳, 曾雪兰, 祝振昌, 郭芬, 罗丽娟, 张武英, 杜青平, 张远. 湛江市红树林植被及土壤碳密度空间分布及其驱动机制分析[J]. 生态环境学报, 2025, 34(11): 1705-1714. |
| [6] | 张宝东, 王彪, 吴艳兰, 孟玉, 徐升, 钱贞兵, 秦军. 安徽省农村黑臭水体特征分析及识别[J]. 生态环境学报, 2024, 33(8): 1257-1268. |
| [7] | 吕金岭, 尤克, 何斌, 刘霜, 梁少民, 郭战玲. 玉米基肥期农田土壤氨挥发量与近地表氨浓度相关性研究[J]. 生态环境学报, 2024, 33(3): 399-407. |
| [8] | 古佳玮, 郭彩霞, 朱铧楠, 谭玉坤, 陈红跃. 广东丰溪省级自然保护区景观格局变化及其驱动力研究[J]. 生态环境学报, 2024, 33(2): 222-230. |
| [9] | 张钧韦, 夏圣洁, 陈慧儒, 刘艳红. 山西中部城市群景观格局演变对其热环境的影响研究[J]. 生态环境学报, 2023, 32(5): 943-955. |
| [10] | 刘紫薇, 葛继稳, 王月环, 杨诗雨, 姚东, 谢金林. 大九湖泥炭湿地甲烷通量变异特征及影响因素[J]. 生态环境学报, 2023, 32(4): 706-714. |
| [11] | 李文菁, 黄月群, 黄亮亮, 李向通, 苏琼源, 孙扬言. 北部湾海洋鱼类微塑料污染特征及其风险评估[J]. 生态环境学报, 2023, 32(11): 1913-1921. |
| [12] | 王晨茜, 张琼锐, 张若琪, 孙学超, 徐颂军. 广东省珠江流域景观格局对水质净化服务的影响[J]. 生态环境学报, 2022, 31(7): 1425-1433. |
| [13] | 孙建波, 畅文军, 李文彬, 张世清, 李春强, 彭明. 香蕉不同生育期根际微生物生物量及土壤酶活的变化研究[J]. 生态环境学报, 2022, 31(6): 1169-1174. |
| [14] | 玄锦, 李祖婵, 邹诚, 秦子博, 吴雅华, 黄柳菁. 江心洲景观类型和格局对植物多样性的多尺度影响——以闽江流域福州段为例[J]. 生态环境学报, 2022, 31(12): 2320-2330. |
| [15] | 陈漾, 张金谱, 邱晓暖, 琚鸿, 黄俊. 2021年广州市臭氧污染特征及气象因子影响分析[J]. 生态环境学报, 2022, 31(10): 2028-2038. |
| 阅读次数 | ||||||
|
全文 |
|
|||||
|
摘要 |
|
|||||