生态环境学报 ›› 2023, Vol. 32 ›› Issue (9): 1654-1662.DOI: 10.16258/j.cnki.1674-5906.2023.09.012
温丽容1,3( ), 林勃机2, 李婷婷2, 张子洋2, 张正恩2, 江明1, 周炎1, 张涛1, 李军2,*(), 张干2
收稿日期:2023-05-19
出版日期:2023-09-18
发布日期:2023-12-11
通讯作者:
*李军。E-mail: junli@gig.ac.cn作者简介:温丽容(1975年生),女,副高级工程师,硕士,主要研究方向环境空气质量监测与研究。E-mail: 105771055@qq.com
基金资助:
WEN Lirong1,3(), LIN Boji2, LI Tingting2, ZHANG Ziyang2, ZHANG Zhengen2, JIANG Ming1, ZHOU Yan1, ZHANG Tao1, LI Jun2,*(), ZHANG Gan2
Received:2023-05-19
Online:2023-09-18
Published:2023-12-11
摘要:
二次无机气溶胶(SIA,Secondary inorganic aerosol)是PM2.5中的重要组成部分,其快速形成是导致大气能见度下降的重要原因。二次无机气溶胶主要包括硫酸根、硝酸根和铵根离子,其来源广、生成途径复杂,识别其来源存在一定的挑战。最近,基于稳定同位素(δ34S-SO42−、δ15N-NO3−、δ18O-NO3−、δ15N-NH4+)的源解析方法被应用到相应污染物的来源解析。选取珠三角鹤山大气超级站作为研究地点,开展了为期1年的大气PM2.5样品采集,在分析了70个样品的水溶性离子、痕量金属元素、有机碳、无机碳的基础上,选取其中的37个大气PM2.5样品,分析了相应的δ34S-SO42−、δ15N-NO3−和δ18O-NO3−、δ15N-NH4+同位素值,结合稳定同位素平衡和优化的贝叶斯模型进行源解析,定量了各污染源对二次无机气溶胶的影响。结果表明,PM2.5年平均质量浓度为39.8 μg•m−3。PM2.5中SIA占比年均29.8%,呈现春季>冬季>夏季>秋季的季节变化规律,冬季二次污染程度较2013年明显下降;年均各SIA对颗粒质量浓度贡献顺序为硫酸根>硝酸根>铵根。δ34S-SO42−值范围为1.8‰-9.6‰,平均值为4.5‰±1.7‰。源解析结果显示采样期间燃煤、燃油、生物成因硫排放对鹤山SO42−分别贡献了41.8%、32.9%、25.3%。δ15N-NO3−范围为0.8‰-8.3‰,平均值为4.7‰±2.0‰。贝叶斯源解析结果显示,燃煤排放是鹤山NO3−最主要来源,年均贡献率达到41.6%,其余污染源年均贡献率排序为,生物质燃烧 (BB)>汽油车>船舶>土壤微生物,贡献率依次为20.9%、15.6%、13.9%、8.0%。将各SIA浓度与对应的源解析结果合并,结果表明非化石源对总SIA贡献最大,为37.2%,其次为燃煤源及燃油源,分别为35.6%、27.2%。排放清单法可能低估了非化石源对SIA的贡献,在珠三角地区低估值约为10%。清洁大气时期燃油对SIA的贡献显著高于轻度污染与重度污染时期,最高可达48.4%。
中图分类号:
温丽容, 林勃机, 李婷婷, 张子洋, 张正恩, 江明, 周炎, 张涛, 李军, 张干. 基于多同位素的珠三角PM2.5中二次无机气溶胶来源解析[J]. 生态环境学报, 2023, 32(9): 1654-1662.
WEN Lirong, LIN Boji, LI Tingting, ZHANG Ziyang, ZHANG Zhengen, JIANG Ming, ZHOU Yan, ZHANG Tao, LI Jun, ZHANG Gan. Source Apportionment of Ammonium in Atmospheric PM2.5 in the Pearl River Delta Based on Nitrogen Isotope[J]. Ecology and Environment, 2023, 32(9): 1654-1662.
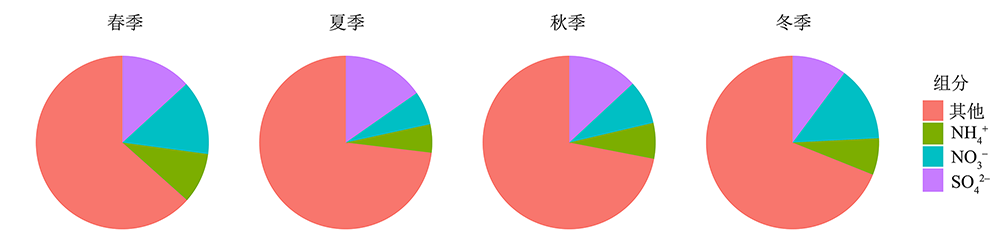
图1 各季节SIA对PM2.5贡献占比
Figure 1 Proportion of secondary inorganic aerosols in PM2.5
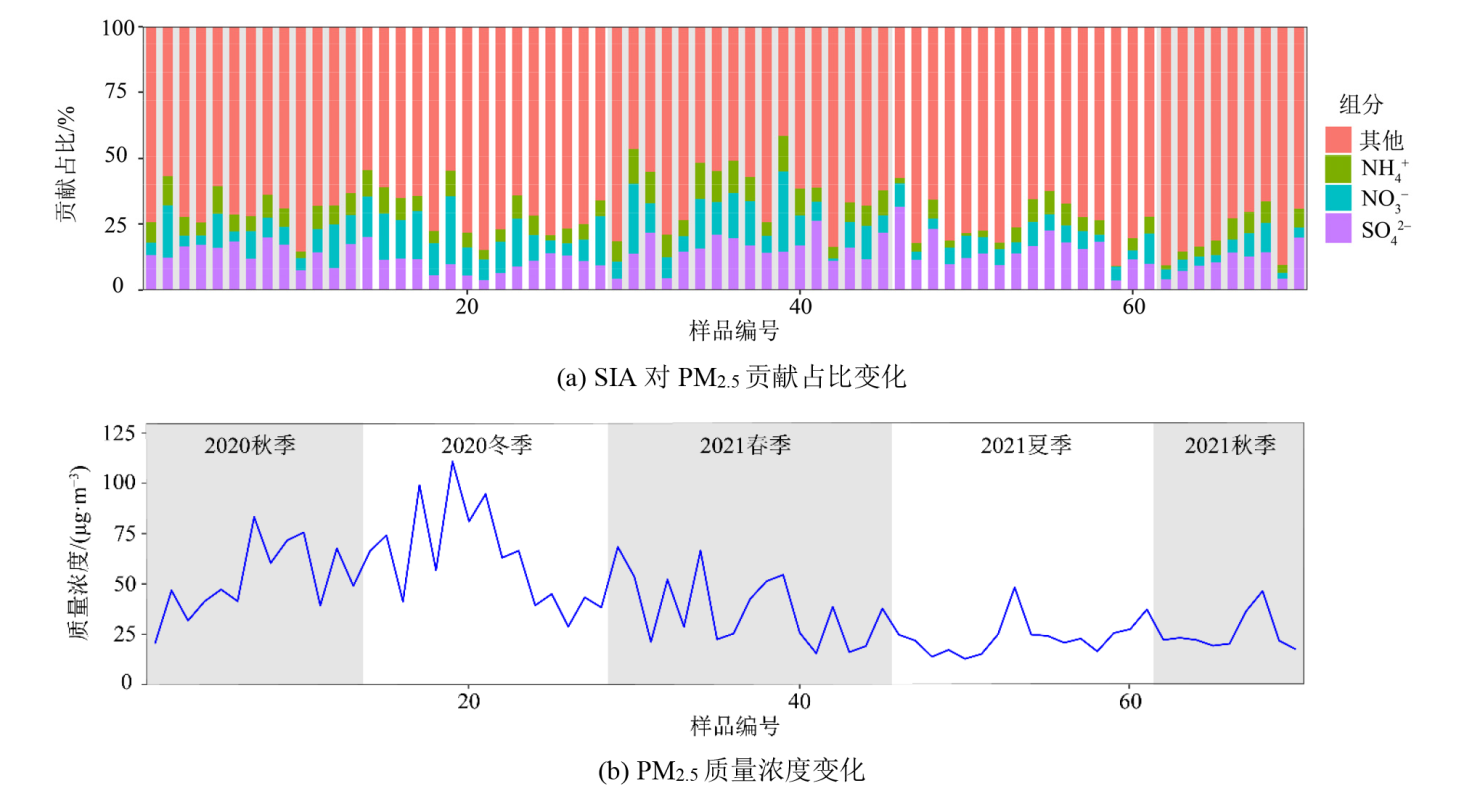
图2 采样期间SIA对PM2.5贡献占比变化与PM2.5质量浓度变化
Figure 2 Changes in the proportion of secondary inorganic aerosols in PM2.5 and the time series of PM2.5 concentration during the sampling period
| 统计项目 | PM2.5 | NO3− | SO42− | NH4+ |
|---|---|---|---|---|
| 平均值 | 39.8 | 4.45 | 4.96 | 2.85 |
| 标准差 | 22.6 | 4.97 | 2.88 | 2.22 |
| 最小值 | 11.6 | 0.34 | 0.86 | 0.07 |
| 最大值 | 109 | 28.1 | 13.0 | 10.9 |
表1 采样期间PM2.5中SIA质量浓度
Table 1 Concentration of SIA in PM2.5 during the sampling period μg•m−3
| 统计项目 | PM2.5 | NO3− | SO42− | NH4+ |
|---|---|---|---|---|
| 平均值 | 39.8 | 4.45 | 4.96 | 2.85 |
| 标准差 | 22.6 | 4.97 | 2.88 | 2.22 |
| 最小值 | 11.6 | 0.34 | 0.86 | 0.07 |
| 最大值 | 109 | 28.1 | 13.0 | 10.9 |
| 采样时段 | SIA/PM2.5 | NO3−/PM2.5 | SO42−/PM2.5 | NH4+/PM2.5 |
|---|---|---|---|---|
| 全年 | 29.8 | 9.5 | 13.5 | 6.8 |
| 春季 | 36.9 | 12.9 | 14.8 | 9.1 |
| 夏季 | 26.6 | 6.2 | 15.5 | 5.0 |
| 秋季 | 26.3 | 7.1 | 12.8 | 6.5 |
| 冬季 | 30.1 | 12.7 | 10.8 | 6.7 |
表2 采样期间鹤山SIA对PM2.5质量浓度相对贡献
Table 2 Relative contribution of SIA to PM2.5 mass concentration in Heshan during the sampling period %
| 采样时段 | SIA/PM2.5 | NO3−/PM2.5 | SO42−/PM2.5 | NH4+/PM2.5 |
|---|---|---|---|---|
| 全年 | 29.8 | 9.5 | 13.5 | 6.8 |
| 春季 | 36.9 | 12.9 | 14.8 | 9.1 |
| 夏季 | 26.6 | 6.2 | 15.5 | 5.0 |
| 秋季 | 26.3 | 7.1 | 12.8 | 6.5 |
| 冬季 | 30.1 | 12.7 | 10.8 | 6.7 |
| 采样时段 | 燃煤 | 燃油 | 生物成因硫 |
|---|---|---|---|
| 全年 | 41.8±5.76 | 32.9±9.3 | 25.3±4.2 |
| 春季 | 37.5±5.2 | 39.7±9.5 | 22.8±4.9 |
| 夏季 | 32.9±8.6 | 45.3±11.0 | 21.8±2.3 |
| 秋季 | 45.7±2.4 | 26.5±4.5 | 27. 8±3.0 |
| 冬季 | 44.5±3.2 | 29.1±4.5 | 26.4±2.6 |
表3 采样期间鹤山SO42−主要来源占比
Table 3 Source apportionments of sulfate aerosols in Heshan during the sampling period %
| 采样时段 | 燃煤 | 燃油 | 生物成因硫 |
|---|---|---|---|
| 全年 | 41.8±5.76 | 32.9±9.3 | 25.3±4.2 |
| 春季 | 37.5±5.2 | 39.7±9.5 | 22.8±4.9 |
| 夏季 | 32.9±8.6 | 45.3±11.0 | 21.8±2.3 |
| 秋季 | 45.7±2.4 | 26.5±4.5 | 27. 8±3.0 |
| 冬季 | 44.5±3.2 | 29.1±4.5 | 26.4±2.6 |
| 采样时期 | 船舶 | 汽油车 | 生物质燃烧 | 燃煤 | 土壤微生物 |
|---|---|---|---|---|---|
| 全年 | 13.9±3.0 | 15.6±2.7 | 20.9±1.5 | 41.6±9.4 | 8.0±2.4 |
| 春季 | 12.7±2.9 | 14.7±2.5 | 20.6±1.7 | 44.9±8.9 | 7.1±2.0 |
| 夏季 | 14.6±3.2 | 16.4±2.5 | 21.6±0.7 | 39.0±9.0 | 8.4±2.6 |
| 秋季 | 15.3±2.3 | 16.9±2 | 21.6±1.0 | 37.2±6.9 | 8.9±1.8 |
| 冬季 | 13.5±3.6 | 15.0±3.3 | 20.5±1.8 | 43.0±11.5 | 8.0±3.2 |
表4 采样期间鹤山NO3−主要来源占比
Table 4 Source apportionments of nitrate aerosols in Heshan during the sampling period %
| 采样时期 | 船舶 | 汽油车 | 生物质燃烧 | 燃煤 | 土壤微生物 |
|---|---|---|---|---|---|
| 全年 | 13.9±3.0 | 15.6±2.7 | 20.9±1.5 | 41.6±9.4 | 8.0±2.4 |
| 春季 | 12.7±2.9 | 14.7±2.5 | 20.6±1.7 | 44.9±8.9 | 7.1±2.0 |
| 夏季 | 14.6±3.2 | 16.4±2.5 | 21.6±0.7 | 39.0±9.0 | 8.4±2.6 |
| 秋季 | 15.3±2.3 | 16.9±2 | 21.6±1.0 | 37.2±6.9 | 8.9±1.8 |
| 冬季 | 13.5±3.6 | 15.0±3.3 | 20.5±1.8 | 43.0±11.5 | 8.0±3.2 |
| 采样时段 | 燃煤 | 燃油 | 非化石源 |
|---|---|---|---|
| 全年 | 35.6 | 27.2 | 37.2 |
| 春季 | 33.7 | 29.0 | 37.3 |
| 夏季 | 29.9 | 37.6 | 32.5 |
| 秋季 | 36.5 | 24.7 | 38.8 |
| 冬季 | 38.1 | 25.9 | 36.0 |
表5 采样期间鹤山SIA的主要污染源占比
Table 5 Relative contribution of various pollution sources to SIA in Heshan during the sampling period %
| 采样时段 | 燃煤 | 燃油 | 非化石源 |
|---|---|---|---|
| 全年 | 35.6 | 27.2 | 37.2 |
| 春季 | 33.7 | 29.0 | 37.3 |
| 夏季 | 29.9 | 37.6 | 32.5 |
| 秋季 | 36.5 | 24.7 | 38.8 |
| 冬季 | 38.1 | 25.9 | 36.0 |
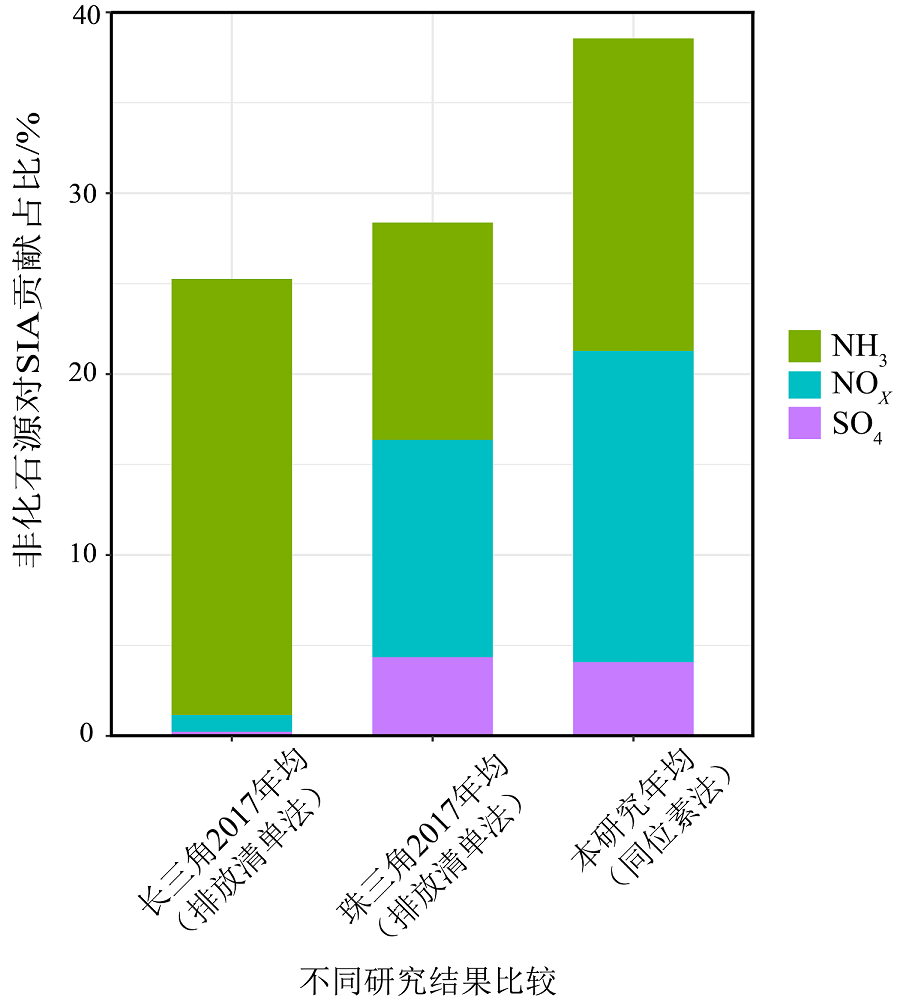
图3 中国典型区域基于同位素方法和排放清单方法的非化石源对SIA贡献对比
Figure 3 Comparison of non-fossil source contributions to SIA based on isotope and emission inventory methods in typical regions of China
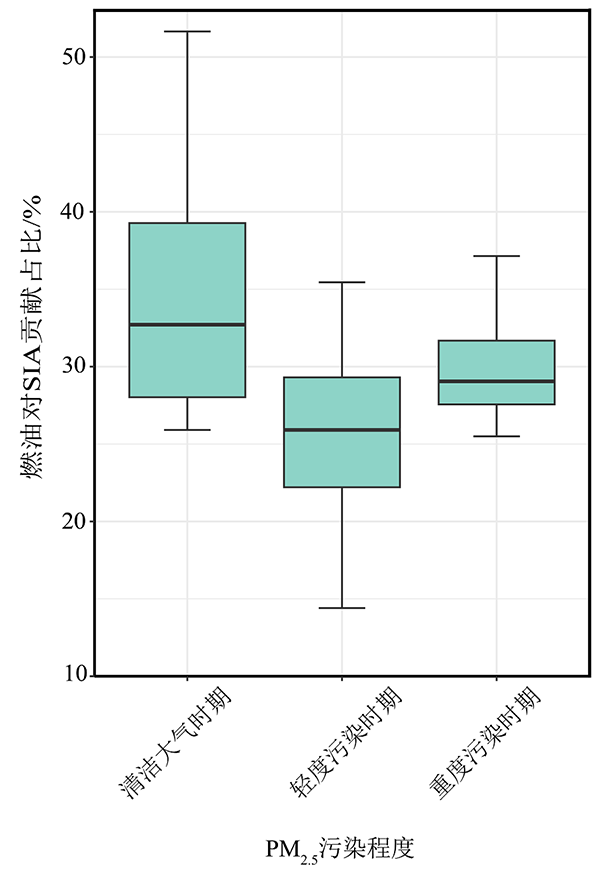
图4 采样期间鹤山不同PM2.5污染程度下燃油对SIA的相对贡献
Figure 4 Boxplot of the relative contribution of oil combustion to SIA under different PM2.5 pollution stages in Heshan during the sampling period
| [1] | AN J Y, HUANG Y W, HUANG C, et al., 2021. Emission inventory of air pollutants and chemical speciation for specific anthropogenic sources based on local measurements in the Yangtze River Delta region, China[J]. Atmospheric Chemistry and Physics, 21(3): 2003-2025. |
| [2] |
AN Z S, HUANG R J, ZHANG R Y, et al., 2019. Severe haze in northern China: A synergy of anthropogenic emissions and atmospheric processes[J]. Proceedings of the National Academy of Sciences of the United States of America, 116: 8657-8666.
DOI PMID |
| [3] |
BEHERA S N, SHARMA M, ANEJA V P, et al., 2013. Ammonia in the atmosphere: A review on emission sources, atmospheric chemistry and deposition on terrestrial bodies[J]. Environmental Science and Pollution Research, 20(11): 8092-8131.
DOI URL |
| [4] |
CHENG C, YU R L, CHEN Y T, et al., 2022. Quantifying the source and formation of nitrate in PM2.5 using dual isotopes combined with Bayesian mixing model: A case study in an inland city of southeast China[J]. Chemosphere, 308(Part 1): 136097.
DOI URL |
| [5] | CHENG Y, YU Q Q, LIU J M, et al., 2021. Formation of secondary inorganic aerosol in a frigid urban atmosphere[J]. Frontiers of Environmental Science & Engineering, 16(2): 18. |
| [6] |
ELLIOTT E M, KENDALL C, WANKEL S D, et al., 2007. Nitrogen isotopes as indicators of NOx source contributions to atmospheric nitrate deposition across the midwestern and northeastern United States[J]. Environmental Science and Technology, 41(22): 7661-7667.
DOI URL |
| [7] |
GUO S, HU M, ZAMORA M L, et al., 2014. Elucidating severe urban haze formation in China[J]. Proceedings of the National Academy of Sciences of the United States of America, 111(49): 17373-17378.
DOI PMID |
| [8] |
GUO Z Y, GUO Q J, CHEN S L, et al., 2019. Study on pollution behavior and sulfate formation during the typical haze event in Nanjing with water soluble inorganic ions and sulfur isotopes[J]. Atmospheric Research, 217: 198-207.
DOI URL |
| [9] |
HUANG R J, ZHANG Y L, BOZZETTI C, et al., 2014. High secondary aerosol contribution to particulate pollution during haze events in China[J]. Nature, 514(7521): 218-222.
DOI |
| [10] |
HUANG Z J, ZHONG Z M, SHA Q G, et al., 2021. An updated model-ready emission inventory for Guangdong Province by incorporating big data and mapping onto multiple chemical mechanisms[J]. Science of the Total Environment, 769: 144535.
DOI URL |
| [11] | LI G H, BEI N F, CAO J J, et al., 2017. A possible pathway for rapid growth of sulfate during haze days in China[J]. Atmospheric Chemistry and Physics, 17(5): 3301-3316. |
| [12] | LI Y E, ZHU B, LEI Y L, et al., 2022. Characteristics, formation, and sources of PM2.5 in 2020 in Suzhou, Yangtze River Delta, China[J]. Environmental Research, 212(Part D): 113545. |
| [13] |
LIN Y C, YU M Y, XIE F, et al., 2022. Anthropogenic emission sources of sulfate aerosols in Hangzhou, east China: Insights from isotope techniques with consideration of fractionation effects between gas-to-particle transformations[J]. Environmental Science and Technology, 56(7): 3905-3914.
DOI URL |
| [14] | MENG F L, ZHANG Y B, KANG J H, et al., 2022. Trends in secondary inorganic aerosol pollution in China and its responses to emission controls of precursors in wintertime[J]. Atmospheric Chemistry and Physics, 22(9): 6291-6308. |
| [15] | PEY J, PEREZ N, CORTES J, et al., 2013. Chemical fingerprint and impact of shipping emissions over a western Mediterranean metropolis: Primary and aged contributions[J]. Science of the Total Environment, 463-464: 497-507. |
| [16] |
SMITH K R, JERRETT M, ANDERSON H R, et al., 2009. Public health benefits of strategies to reduce greenhouse-gas emissions: health implications of short-lived greenhouse pollutants[J]. The Lancet, 374(9707): 2091-2103.
DOI URL |
| [17] | SU C X, KANG R H, ZHU W X, et al., 2020. Delta 15N of nitric oxide produced under aerobic or anaerobic conditions from seven soils and their associated n isotope fractionations[J]. Journal of Geophysical Research-Biogeosciences, 125(9): e2020JG005705. |
| [18] |
SU T, LI J, TIAN C G, et al., 2020. Source and formation of fine particulate nitrate in South China: Constrained by isotopic modeling and online trace gas analysis[J]. Atmospheric Environment, 231: 117563.
DOI URL |
| [19] |
SUN X Z, ZONG Z, WANG K, et al., 2020. The importance of coal combustion and heterogeneous reaction for atmospheric nitrate pollution in a cold metropolis in China: Insights from isotope fractionation and Bayesian mixing model[J]. Atmospheric Environment, 243: 117730.
DOI URL |
| [20] |
WANG X, LI J, SUN R, et al., 2021. Regional characteristics of atmospheric delta34S-SO42- over three parts of Asia monitored by quartz wool-based passive samplers[J]. Science of the Total Environment, 778: 146107.
DOI URL |
| [21] |
WEI L F, YUE S Y, ZHAO W Y, et al., 2018. Stable sulfur isotope ratios and chemical compositions of fine aerosols (PM2.5) in Beijing, China[J]. Science of the Total Environment, 633: 1156-1164.
DOI URL |
| [22] |
YAN F H, CHEN W H, JIA S G, et al., 2020. Stabilization for the secondary species contribution to PM2.5 in the Pearl River Delta (PRD) over the past decade, China: A meta-analysis[J]. Atmospheric Environment, 242(1): 117817.
DOI URL |
| [23] |
YANG H M, WANG J F, CHEN M D, et al., 2020. Chemical characteristics, sources and evolution processes of fine particles in Lin’an, Yangtze River Delta, China[J]. Chemosphere, 254: 126851.
DOI URL |
| [24] |
YU G Y, ZHANG Y, YANG F, et al., 2021. Dynamic Ni/V ratio in the ship-emitted particles driven by multiphase fuel oil regulations in coastal China[J]. Environmental Science & Technology, 55: 15031-15039.
DOI URL |
| [25] |
ZHANG M Y, WANG S J, MA G Q, et al., 2010. Sulfur isotopic composition and source identification of atmospheric environment in central Zhejiang, China[J]. Science China Earth Sciences, 53(11): 1717-1725.
DOI URL |
| [26] |
ZHANG Y, HUANG W, CAI T Q, et al., 2016. Concentrations and chemical compositions of fine particles (PM2.5) during haze and non-haze days in Beijing[J]. Atmospheric Research, 174-175: 62-69.
DOI URL |
| [27] |
ZHAO Z Y, CAO F, FAN M Y, et al., 2020. Coal and biomass burning as major emissions of NOx in Northeast China: Implication from dual isotopes analysis of fine nitrate aerosols[J]. Atmospheric Environment, 242: 117762.
DOI URL |
| [28] |
ZONG Z, SHI X L, SUN Z Y, et al., 2022. Nitrogen isotopic composition of NOx from residential biomass burning and coal combustion in North China[J]. Environmental Pollution, 304: 119238.
DOI URL |
| [29] |
ZONG Z, SUN Z Y, XIAO L L, et al., 2020b. Insight into the variability of the nitrogen isotope composition of vehicular nox in China[J]. Environmental Science & Technology, 54(22): 14246-14253.
DOI URL |
| [30] |
ZONG Z, TAN Y, WANG X, et al., 2020a. Dual-modelling-based source apportionment of NOx in five Chinese megacities: Providing the isotopic footprint from 2013 to 2014[J]. Environment International, 137: 105592.
DOI URL |
| [31] |
ZONG Z, WANG X P, TIAN C G, et al., 2017. First assessment of nox sources at a regional background site in north China using isotopic analysis linked with modeling[J]. Environmental Science & Technology, 51(11): 5923-5931.
DOI URL |
| [32] |
ZOU D L, SUN Q Q, LIU J S, et al., 2022. Seasonal source analysis of nitrogen and carbon aerosols of PM2.5 in typical cities of Zhejiang, China[J]. Chemosphere, 303(Part 3): 135026.
DOI URL |
| [33] |
江明, 张子洋, 李婷婷, 等, 2022. 基于氮同位素的珠三角典型地区大气PM2.5中NH4+来源解析[J]. 生态环境学报, 31(9): 1840-1848.
DOI |
| JIANG M, ZHANG Z Y, LI T T, et al., 2022. Source apportionment of ammonium in atmospheric PM2.5 in the Pearl River Delta based on nitrogen isotope[J]. Ecology and Environmental Sciences, 31(9): 1840-1848. | |
| [34] | 孙泽宇, 2021. 典型源排放NOx的氮同位素组成及其在渤海PM2.5溯源中的应用[D]. 烟台: 中国科学院大学 (中国科学院烟台海岸带研究所):45. |
| SUN Z Y, 2021. Nitrogen isotope characteristics of NOx from typical pollution sources and its application in PM2.5 apportionment in the Bohai Sea[D]. Yantai: University of Chinese Academy of Sciences,Yantai Institute of Coastal Zone Research, Chinese Academy of Sciences: 45. | |
| [35] | 岳玎利, 钟流举, 曾立民, 等, 2015. 珠三角地区冬季大气细颗粒物理化特性与成因[J]. 环境科学与技术, 38(2): 105-109, 138. |
| YUE D L, ZHONG L J, ZENG L M, et al., 2015. Physical and chemical properties and causes of fine particulate matter in winter in the pearl river delta region[J]. Environmental Science & Technology, 38(2): 105-109, 138. | |
| [36] | 张延君, 郑玫, 蔡靖, 等, 2015. PM2.5源解析方法的比较与评述[J]. 科学通报, 60(2): 109-121. |
| ZHANG Y J, ZHENG M, CAI J, et al., 2015. Comparison and review of PM2.5 source apportionment methods[J]. Chinese Science Bulletin, 60(2): 109-121. | |
| [37] | 中华人民共和国生态环境部, 国家质量监督检验检疫总局, 2012. 环境空气质量标准: GB 3095—2012[S]. 北京: 中国环境科学出版社. |
| Ministry of Ecology and Environment of the People's Republic of China, General Administration of Quality Supervision,Inspection and Quarantine of the People's Republic of China, 2012. Environmental Air Quality Standards: GB 3095—2012[S]. Beijing: China Environmental Science Press. |
| [1] | 王薇, 代萌萌. 基于颗粒物时空分布的街道峡谷空间形态研究——以合肥市同安街道为例[J]. 生态环境学报, 2023, 32(9): 1632-1643. |
| [2] | 郑秋萍, 李菲, 赵芮, 蒋冬升, 王宏. 福建省PM2.5-O3双高特征与天气形势影响分析[J]. 生态环境学报, 2023, 32(8): 1440-1448. |
| [3] | 董洁芳, 邓椿, 张仲伍. 渭河流域PM2.5时空演化及人口暴露风险[J]. 生态环境学报, 2023, 32(6): 1078-1088. |
| [4] | 李建辉, 党争, 陈琳. 黄河几字弯都市圈PM2.5时空特征及影响因素分析[J]. 生态环境学报, 2023, 32(4): 697-705. |
| [5] | 张莉, 李铖, 谭皓泽, 韦家怡, 程炯, 彭桂香. 广州典型城市林地对大气颗粒物的削减效应及影响因素[J]. 生态环境学报, 2023, 32(2): 341-350. |
| [6] | 江明, 张子洋, 李婷婷, 林勃机, 张正恩, 廖彤, 袁鸾, 潘苏红, 李军, 张干. 基于氮同位素的珠三角典型地区大气PM2.5中NH4+来源解析[J]. 生态环境学报, 2022, 31(9): 1840-1848. |
| [7] | 樊珂宇, 高原, 赖子尼, 曾艳艺, 刘乾甫, 李海燕, 麦永湛, 杨婉玲, 魏敬欣, 孙金辉, 王超. 珠三角河网鱼类微塑料污染特征研究[J]. 生态环境学报, 2022, 31(8): 1590-1598. |
| [8] | 梁俊芬, 蔡勋, 冯珊珊, 陶亮. 珠三角地区农业农村现代化发展程度评价及制约因子研究[J]. 生态环境学报, 2022, 31(8): 1680-1689. |
| [9] | 魏小锋, 韩红, 闫学军, 王在峰, 李圣增, 田勇, 梁第, 马明亮, 张桂芹. 基于卫星遥感与CMB模型的济南市冬季重污染过程PM2.5溯源分析[J]. 生态环境学报, 2022, 31(6): 1175-1183. |
| [10] | 王薇, 程歆玥. 合肥市不同功能街道峡谷PM2.5和PM10时空分布特征及影响因素分析[J]. 生态环境学报, 2022, 31(3): 524-534. |
| [11] | 文典, 赵沛华, 陈楚国, 李富荣, 杜瑞英, 黄永东, 李蕾, 王富华. 珠三角典型区域蔬菜产地土壤Cd安全阈值研究[J]. 生态环境学报, 2022, 31(3): 603-609. |
| [12] | 赵锐, 詹梨苹, 周亮, 张军科. 地理探测联合地理加权岭回归的PM2.5驱动因素分析[J]. 生态环境学报, 2022, 31(2): 307-317. |
| [13] | 蒋斌, 陈多宏, 张涛, 袁鸾, 周炎, 沈劲, 张春林, 王伯光. 华南水稻秸秆焚烧期碳质气溶胶组分特征及源贡献评估[J]. 生态环境学报, 2022, 31(12): 2358-2366. |
| [14] | 邢冉, 沈国锋, 程和发, 陶澍. 东北地区农村生活能源结构变迁及其对区域污染物排放的影响[J]. 生态环境学报, 2022, 31(12): 2367-2373. |
| [15] | 李圣增, 郝赛梅, 谭路遥, 张怀成, 徐标, 谷树茂, 潘光, 王淑妍, 闫怀忠, 张桂芹. 济南市PM2.5中二次组分的时空变化特征及其影响因素[J]. 生态环境学报, 2022, 31(1): 100-109. |
| 阅读次数 | ||||||
|
全文 |
|
|||||
|
摘要 |
|
|||||