生态环境学报 ›› 2022, Vol. 31 ›› Issue (4): 793-801.DOI: 10.16258/j.cnki.1674-5906.2022.04.018
杨贤房1,4( ), 陈朝2,3, 郑林1,*(), 万智巍4, 陈永林4, 王远东4
收稿日期:2021-12-06
出版日期:2022-04-18
发布日期:2022-06-22
通讯作者:
*郑林(1961年生),教授,主要研究方向为生态空间规划与土地利用。E-mail: 627219805@qq.com作者简介:杨贤房(1983年生),男,讲师,博士研究生,主要研究方向生态修复与土地利用。E-mail: 573492915@qq.com
基金资助:
YANG Xianfang1,4(), CHEN Zhao2,3, ZHENG Lin1,*(), WAN Zhiwei4, CHEN Yonglin4, WANG Yuandong4
Received:2021-12-06
Online:2022-04-18
Published:2022-06-22
摘要:
为了探明离子型稀土矿区不同土地利用类型土壤细菌多样性及群落结构差异,该研究选择了龙南足洞矿区周边水稻田、蔬菜地、果园、玉米地、草地、林地、裸地(对照组)7种土地利用类型,测量土壤理化性质和重金属含量,利用16S rRNA Illumina高通量测序技术和分子生态网络方法,分析不同生境细菌群落组成和物种互作关系。结果表明,草地、林地、裸地有效磷含量低,土壤Cd、Pb、As、Mn、Zn等重金属含量超过背景值,内梅罗综合污染指数排序为草地>林地>果园>水稻田>裸地>蔬菜地>玉米地。Chao1指数排序为玉米地>蔬菜地>水稻田>果园>草地>林地>裸地;相较裸地,耕地、植被类土壤变形菌门(Proteobacteria)丰度大幅下降,而酸酐菌门(Acidobacteria)、硝化螺旋菌门(Nitrospirae)丰度升高;劳尔氏菌属(Ralstonia)丰度显著下降,产黄杆菌属(Rhodanobacter)、慢生根瘤菌属(Bradyrhizobium)和Kaistobacter等细菌丰度显著上升。耕地土壤中硫杆菌属(Thiobacillus)、脱硫球茎菌属(Desulfobulbus)、披毛菌属(Gallionella)相较植被土壤丰度更高,其中草地和蔬菜地Rhodanobacter丰度分别为1.4%、2.0%,水稻田土壤菌属Thiobacillus、Desulfobulbus丰度分别为1.6%、0.9%。共现网络分析结果显示,植被、耕地种植措施增加了细菌网络规模,减少了网络路径长度。铵态氮、全氮、有机质、pH、Cu、Ni与细菌群落结构变化关联性最大。研究显示,相较裸地对照组,植被和耕地恢复措施均能提升矿区土壤促生和反硝化功能优势细菌多样性,耕地土壤中硫循环优势细菌较植被土壤多样性更高。不同土地利用类型土壤功能细菌的识别对稀土矿区生态修复提供了科学指引。
中图分类号:
杨贤房, 陈朝, 郑林, 万智巍, 陈永林, 王远东. 稀土矿区不同土地利用类型土壤细菌群落特征及网络分析[J]. 生态环境学报, 2022, 31(4): 793-801.
YANG Xianfang, CHEN Zhao, ZHENG Lin, WAN Zhiwei, CHEN Yonglin, WANG Yuandong. Characteristics and Network of Soil Bacterial Communities in Different Land Use Types in Rare Earth Mining Areas[J]. Ecology and Environment, 2022, 31(4): 793-801.
| 土壤理化性质 Physicochemical properties of soil | 土地利用类型 Land use types | ||||||
|---|---|---|---|---|---|---|---|
| 裸地 Bare land | 玉米地 Corn field | 果园 Orchard | 蔬菜 Vegetables field | 稻田 Paddy field | 草地 Grassland | 林地 Forest field | |
| pH | 4.35±0.21 | 6.26±0.29 | 4.40±0.35 | 5.18±0.41 | 5.42±0.22 | 4.59±0.14 | 4.57±0.25 |
| w(TN)/(g∙kg-1) | 0.42±0.01 | 3.99±0.68 | 1.03±0.17 | 2.69±0.36 | 1.32±0.62 | 0.84±0.10 | 1.03±0.19 |
| w(OM)/(g∙kg-1) | 1.29±0.12 | 31.34±0.27 | 14.04±1.79 | 33.2±0.84 | 13.26±2.65 | 2.76±0.30 | 6.75±0.75 |
| w(TP)/(g∙kg-1) | 0.002±0 | 0.44±0.04 | 0.21±0.03 | 2.36±0.18 | 0.23±0.05 | 0.004±0 | 0.003±0 |
| w(AP)/(g∙kg-1) | 0.001±0 | 0.01±0.01 | 0.01±0 | 0.32±0.02 | 0.01±0 | 0.001±0 | 0.001±0 |
| w(NH3-N)/(mg∙kg-1) | 6.42±0.56 | 10.81±2.34 | 1.34±1.26 | 31.91±2.31 | 30.53±1.21 | 11.32±7.14 | 5.20±2.01 |
| w(NO2-N)/(mg∙kg-1) | 19.7±0.34 | 1.97±0.26 | 2.51±0.13 | 44.1±7.79 | 2.01±0.17 | 15.5±4.76 | 2.56±1.12 |
| w(As)/(mg∙kg-1) | 15.95±0.02 | 7.92±1.63 | 6.55±1.45 | 9.4±0.69 | 5.98±1.09 | 52.38±2.80 | 15.50±6.67 |
| w(Cd)/(mg∙kg-1) | 0.21±0.02 | 0 | 0 | 0.14±0.02 | 0 | 0.63±0.06 | 0.26±0.01 |
| w(Cu)/(mg∙kg-1) | 4.25±0.12 | 15.86±3.58 | 10.58±2.57 | 14.89±4.52 | 11.91±3.6 | 4.72±0.38 | 6.67±1.04 |
| w(Mn)/(mg∙kg-1) | 152.98±4.60 | 368.93±75.31 | 329.81±175 | 440.61±150 | 266.5±126.4 | 329.48±15.60 | 213.13±39.5 |
| w(Ni)/(mg∙kg-1) | 1.90±0.12 | 14.19±4.65 | 5.97±1.14 | 5.40±2.02 | 10.99±7.27 | 4.82±0.89 | 2.70±1.86 |
| w(Pb)/(mg∙kg-1) | 59.09±1.60 | 64.47±20.30 | 89.46±9.42 | 64.07±9.65 | 72.45±10.01 | 120.01±7.90 | 191.11±84.4 |
| w(Zn)/(mg∙kg-1) | 40.19±5.40 | 71.85±24.50 | 68.56±15.30 | 72.24±18.5 | 85.81±27.2 | 84.04±3.90 | 75.06±8.70 |
| w(Cr)/(mg∙kg-1) | 4.25±0.06 | 48.56±12.3 | 28.94±11.30 | 21.76±8.08 | 36.34±17.86 | 23.68±1.23 | 5.86±4.47 |
| 综合污染指数 (PN) Composite pollution index (PN) | 1.61 | 1.57 | 2.08 | 1.60 | 1.71 | 4.75 | 4.35 |
表1 不同土地利用类型土壤理化性质分析
Table 1 Analysis of soil physico-chemical properties of different land use types
| 土壤理化性质 Physicochemical properties of soil | 土地利用类型 Land use types | ||||||
|---|---|---|---|---|---|---|---|
| 裸地 Bare land | 玉米地 Corn field | 果园 Orchard | 蔬菜 Vegetables field | 稻田 Paddy field | 草地 Grassland | 林地 Forest field | |
| pH | 4.35±0.21 | 6.26±0.29 | 4.40±0.35 | 5.18±0.41 | 5.42±0.22 | 4.59±0.14 | 4.57±0.25 |
| w(TN)/(g∙kg-1) | 0.42±0.01 | 3.99±0.68 | 1.03±0.17 | 2.69±0.36 | 1.32±0.62 | 0.84±0.10 | 1.03±0.19 |
| w(OM)/(g∙kg-1) | 1.29±0.12 | 31.34±0.27 | 14.04±1.79 | 33.2±0.84 | 13.26±2.65 | 2.76±0.30 | 6.75±0.75 |
| w(TP)/(g∙kg-1) | 0.002±0 | 0.44±0.04 | 0.21±0.03 | 2.36±0.18 | 0.23±0.05 | 0.004±0 | 0.003±0 |
| w(AP)/(g∙kg-1) | 0.001±0 | 0.01±0.01 | 0.01±0 | 0.32±0.02 | 0.01±0 | 0.001±0 | 0.001±0 |
| w(NH3-N)/(mg∙kg-1) | 6.42±0.56 | 10.81±2.34 | 1.34±1.26 | 31.91±2.31 | 30.53±1.21 | 11.32±7.14 | 5.20±2.01 |
| w(NO2-N)/(mg∙kg-1) | 19.7±0.34 | 1.97±0.26 | 2.51±0.13 | 44.1±7.79 | 2.01±0.17 | 15.5±4.76 | 2.56±1.12 |
| w(As)/(mg∙kg-1) | 15.95±0.02 | 7.92±1.63 | 6.55±1.45 | 9.4±0.69 | 5.98±1.09 | 52.38±2.80 | 15.50±6.67 |
| w(Cd)/(mg∙kg-1) | 0.21±0.02 | 0 | 0 | 0.14±0.02 | 0 | 0.63±0.06 | 0.26±0.01 |
| w(Cu)/(mg∙kg-1) | 4.25±0.12 | 15.86±3.58 | 10.58±2.57 | 14.89±4.52 | 11.91±3.6 | 4.72±0.38 | 6.67±1.04 |
| w(Mn)/(mg∙kg-1) | 152.98±4.60 | 368.93±75.31 | 329.81±175 | 440.61±150 | 266.5±126.4 | 329.48±15.60 | 213.13±39.5 |
| w(Ni)/(mg∙kg-1) | 1.90±0.12 | 14.19±4.65 | 5.97±1.14 | 5.40±2.02 | 10.99±7.27 | 4.82±0.89 | 2.70±1.86 |
| w(Pb)/(mg∙kg-1) | 59.09±1.60 | 64.47±20.30 | 89.46±9.42 | 64.07±9.65 | 72.45±10.01 | 120.01±7.90 | 191.11±84.4 |
| w(Zn)/(mg∙kg-1) | 40.19±5.40 | 71.85±24.50 | 68.56±15.30 | 72.24±18.5 | 85.81±27.2 | 84.04±3.90 | 75.06±8.70 |
| w(Cr)/(mg∙kg-1) | 4.25±0.06 | 48.56±12.3 | 28.94±11.30 | 21.76±8.08 | 36.34±17.86 | 23.68±1.23 | 5.86±4.47 |
| 综合污染指数 (PN) Composite pollution index (PN) | 1.61 | 1.57 | 2.08 | 1.60 | 1.71 | 4.75 | 4.35 |
| 参数 Indices | α 多样性指数 Alpha diversity index | |||
|---|---|---|---|---|
| Ace指数 Ace index | Chao1指数 Chao1 index | Shannon指数 Shannon index | Simpson指数 Simpson index | |
| 裸地 Bare land | 1074.70 | 1065.93 | 3.09 | 0.61 |
| 玉米地 Corn field | 3227.02 | 3212.19 | 10.79 | 0.99 |
| 果园 Orchard | 1574.79 | 1568.44 | 8.81 | 0.99 |
| 蔬菜地Vegetables field | 2266.58 | 2258.78 | 9.77 | 0.99 |
| 水稻田 Paddy field | 2414.05 | 2405.44 | 10.11 | 0.99 |
| 草地 Grassland | 1483.53 | 1478.72 | 8.42 | 0.99 |
| 林地 Forest field | 1452.32 | 1449.05 | 8.91 | 0.99 |
表2 不同土地利用类型土壤细菌多样性分析
Table 2 Analysis of soil bacterial diversity in different land use types
| 参数 Indices | α 多样性指数 Alpha diversity index | |||
|---|---|---|---|---|
| Ace指数 Ace index | Chao1指数 Chao1 index | Shannon指数 Shannon index | Simpson指数 Simpson index | |
| 裸地 Bare land | 1074.70 | 1065.93 | 3.09 | 0.61 |
| 玉米地 Corn field | 3227.02 | 3212.19 | 10.79 | 0.99 |
| 果园 Orchard | 1574.79 | 1568.44 | 8.81 | 0.99 |
| 蔬菜地Vegetables field | 2266.58 | 2258.78 | 9.77 | 0.99 |
| 水稻田 Paddy field | 2414.05 | 2405.44 | 10.11 | 0.99 |
| 草地 Grassland | 1483.53 | 1478.72 | 8.42 | 0.99 |
| 林地 Forest field | 1452.32 | 1449.05 | 8.91 | 0.99 |
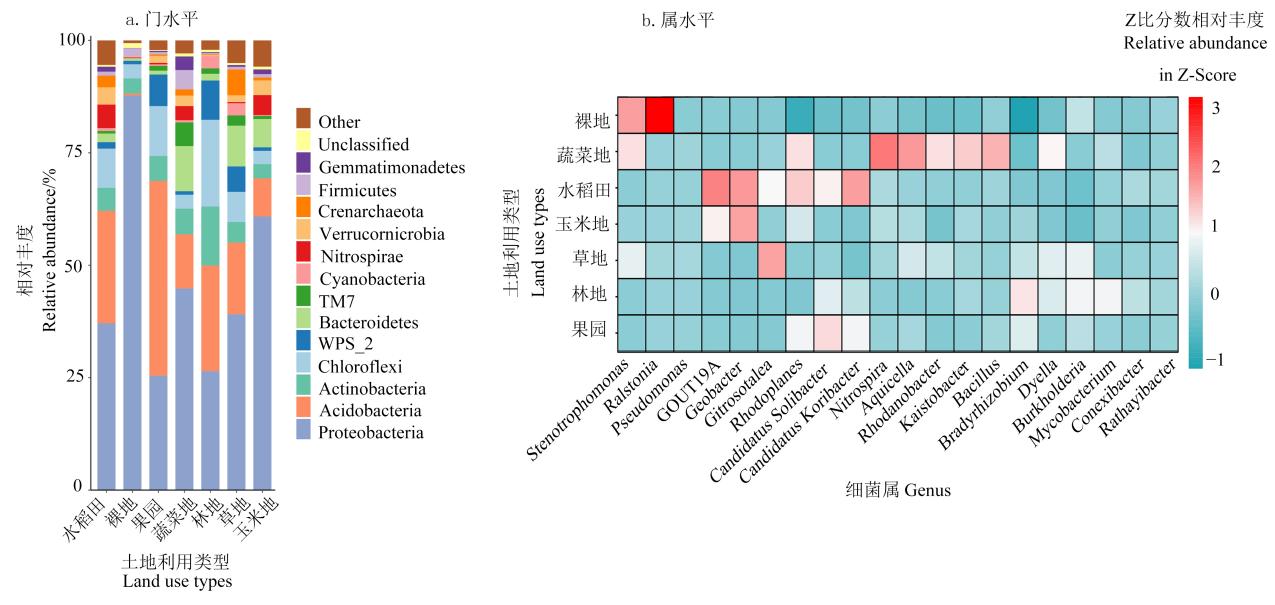
图1 不同土地利用类型土壤细菌群落组成
Figure 1 Abundance of the bacterial community in soil under different land use types
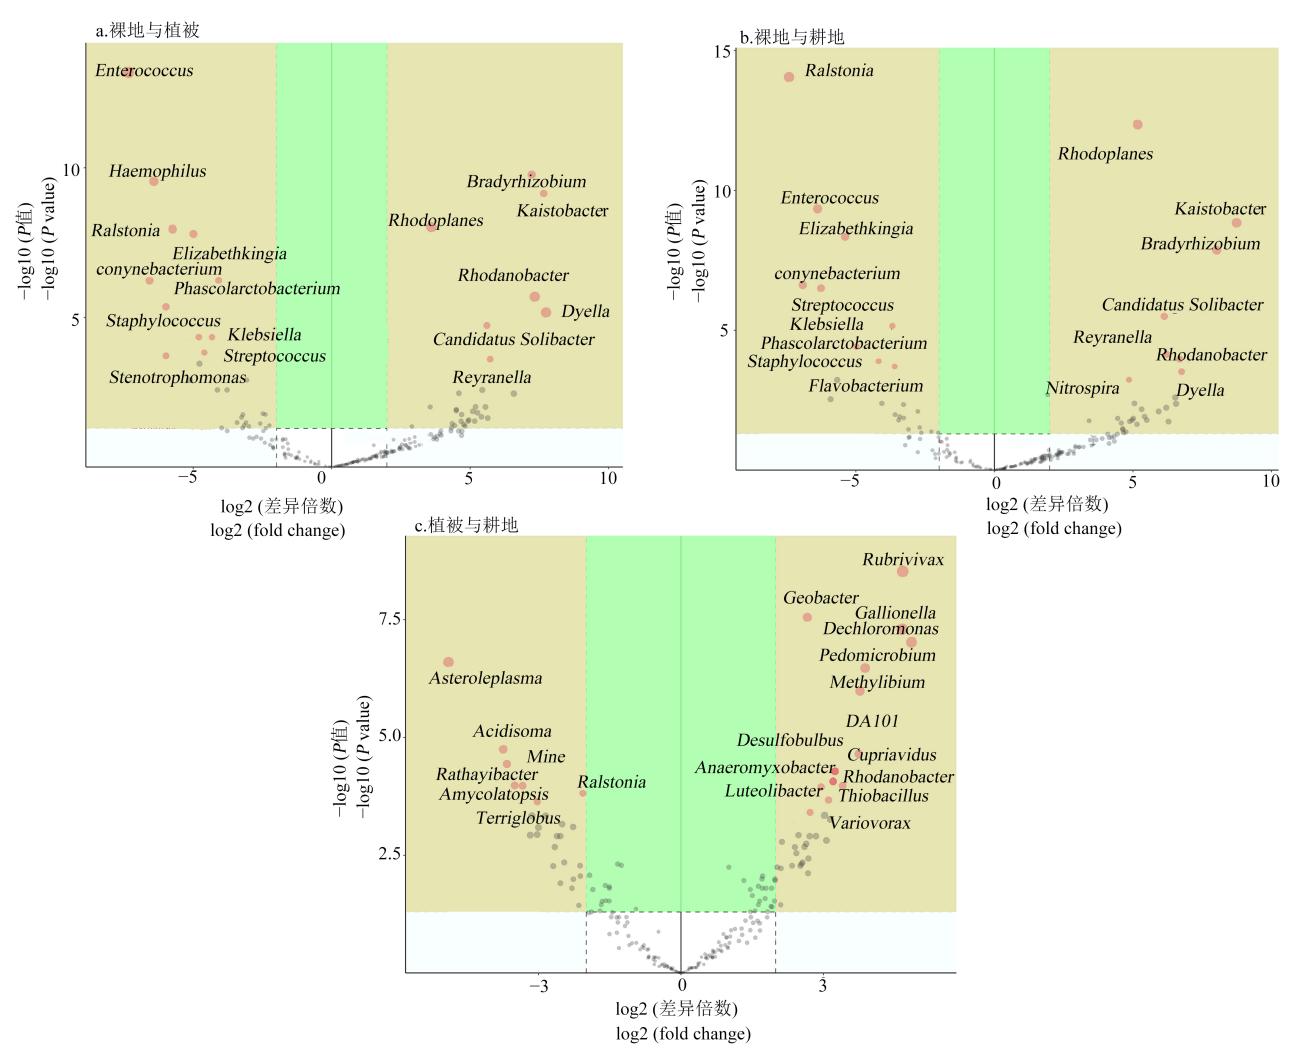
图2 裸地、植被、耕地土壤细菌显著性差异火山图
Figure 2 Bacterial volcanic map of bare land, vegetation and cultivated soil
| 参数 Parameters | 节点数Nodes | 连接数Links | 平均连通度 Average degree | 平均路径长度 Average Path distance | 平均聚类系数 Average clustering coefficient | 负相关比例 Negative correlation ratio | 模块数 Modules | 图密度 Graph density |
|---|---|---|---|---|---|---|---|---|
| 裸地 Bare land | 29 | 104 | 3.54 | 3.58 | 0.44 | 8.80% | 5 | 0.12 |
| 植被 Vegetation | 29 | 106 | 3.66 | 3.37 | 0.46 | 15.1% | 5 | 0.13 |
| 耕地 Arable land | 32 | 219 | 6.84 | 2.35 | 0.58 | 37.5% | 3 | 0.22 |
表3 生态网络特征参数
Table 3 Characteristic parameters of the molecular ecological network
| 参数 Parameters | 节点数Nodes | 连接数Links | 平均连通度 Average degree | 平均路径长度 Average Path distance | 平均聚类系数 Average clustering coefficient | 负相关比例 Negative correlation ratio | 模块数 Modules | 图密度 Graph density |
|---|---|---|---|---|---|---|---|---|
| 裸地 Bare land | 29 | 104 | 3.54 | 3.58 | 0.44 | 8.80% | 5 | 0.12 |
| 植被 Vegetation | 29 | 106 | 3.66 | 3.37 | 0.46 | 15.1% | 5 | 0.13 |
| 耕地 Arable land | 32 | 219 | 6.84 | 2.35 | 0.58 | 37.5% | 3 | 0.22 |
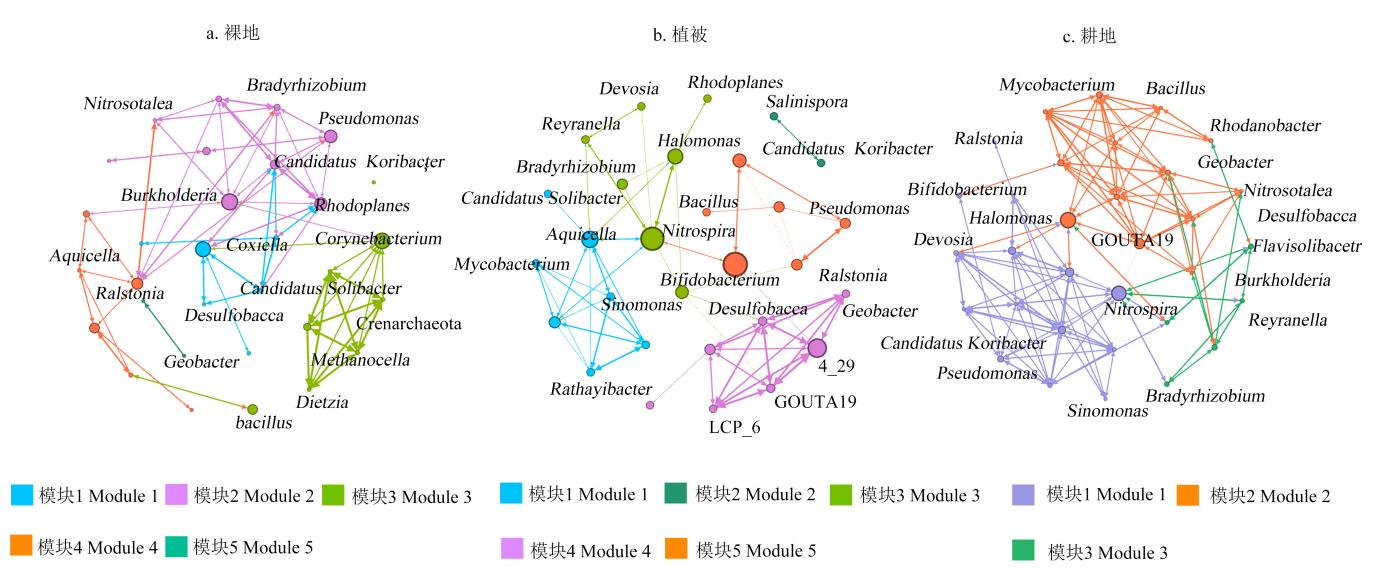
图3 不同土地利用类型细菌群落共现网络
Figure 3 Co-occurrence network of bacterial community under different land use
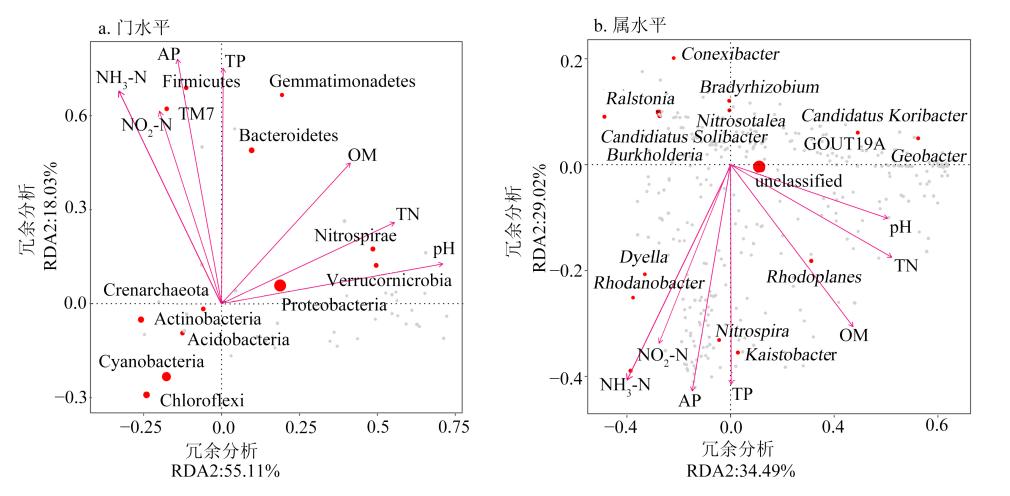
图4 土壤理化参数与物种的非冗余分析(redundancy analysis,RDA)分析
Figure 4 RDA of soil physico-chemical properties and species
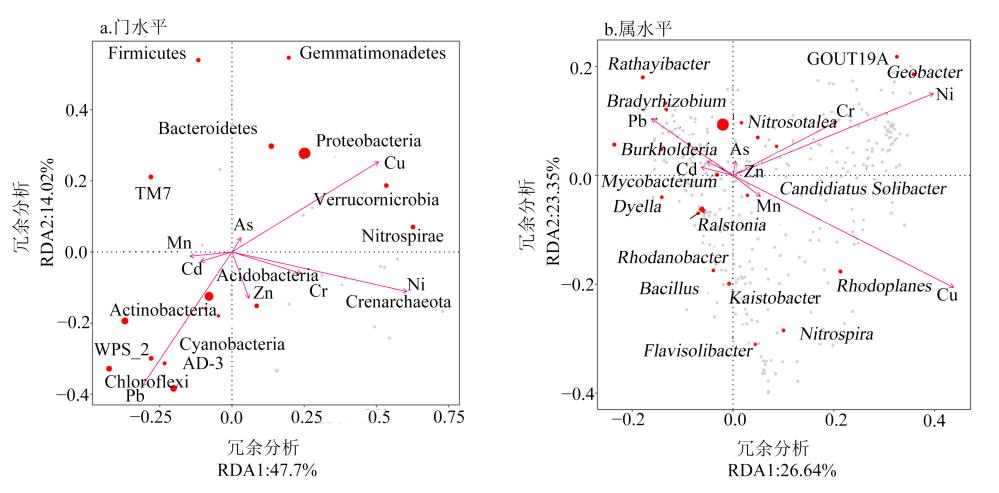
图5 重金属含量与物种的非冗余分析(redundancy analysis,RDA)分析
Figure 5 RDA analysis of heavy metal content and species
| Indices 指数 | OTUs指数 OTUs index | Ace指数 Ace index | Chao1指数 Chao1 index | Shannon指数 Shannon index | Simpson指数 Simpson index |
|---|---|---|---|---|---|
| pH | 0.86** | 0.87** | 0.87** | 0.59** | 0.24 |
| TN | 0.78** | 0.78** | 0.78** | 0.55** | 0.28 |
| TC | 0.71** | 0.72** | 0.72** | 0.57** | 0.28 |
| TP | 0.35 | 0.35 | 0.35 | 0.30 | 0.16 |
| AP | 0.21 | 0.21 | 0.21 | 0.21 | 0.12 |
| NH3-N | 0.32 | 0.33 | 0.38 | 0.21 | 0.19 |
| NO2-N | 0.25 | 0.27 | 0.31 | 0.29 | 0.11 |
| As | -0.26 | -0.26 | -0.26 | -0.13 | 0.04 |
| Cd | -0.30 | -0.30 | -0.30 | -0.15 | 0.01 |
| Cr | 0.37* | 0.37* | 0.37* | 0.31 | 0.23 |
| Cu | 0.63** | 0.63** | 0.63** | 0.46* | 0.19 |
| Mn | 0.23 | 0.23 | 0.23 | 0.25 | 0.25 |
| Ni | 0.58** | 0.58** | 0.58** | 0.43* | 0.24 |
| Pb | -0.30 | -0.31 | -0.31 | 0.05 | 0.23 |
| Zn | 0.08 | 0.08 | 0.08 | 0.33 | 0.43* |
表4 土壤细菌多样性与理化性质、重金属含量相关性分析
Table 4 Correlation Analysis of soil bacterial diversity with physico-chemical properties and heavy metal content
| Indices 指数 | OTUs指数 OTUs index | Ace指数 Ace index | Chao1指数 Chao1 index | Shannon指数 Shannon index | Simpson指数 Simpson index |
|---|---|---|---|---|---|
| pH | 0.86** | 0.87** | 0.87** | 0.59** | 0.24 |
| TN | 0.78** | 0.78** | 0.78** | 0.55** | 0.28 |
| TC | 0.71** | 0.72** | 0.72** | 0.57** | 0.28 |
| TP | 0.35 | 0.35 | 0.35 | 0.30 | 0.16 |
| AP | 0.21 | 0.21 | 0.21 | 0.21 | 0.12 |
| NH3-N | 0.32 | 0.33 | 0.38 | 0.21 | 0.19 |
| NO2-N | 0.25 | 0.27 | 0.31 | 0.29 | 0.11 |
| As | -0.26 | -0.26 | -0.26 | -0.13 | 0.04 |
| Cd | -0.30 | -0.30 | -0.30 | -0.15 | 0.01 |
| Cr | 0.37* | 0.37* | 0.37* | 0.31 | 0.23 |
| Cu | 0.63** | 0.63** | 0.63** | 0.46* | 0.19 |
| Mn | 0.23 | 0.23 | 0.23 | 0.25 | 0.25 |
| Ni | 0.58** | 0.58** | 0.58** | 0.43* | 0.24 |
| Pb | -0.30 | -0.31 | -0.31 | 0.05 | 0.23 |
| Zn | 0.08 | 0.08 | 0.08 | 0.33 | 0.43* |
| [1] |
BANERJEE S, SCHLAEPPI K, VANDER HEIJDEN M G A, 2018 Keystone taxa as drivers of microbiome structure and functioning[J]. Nature Reviews Microbiology, 16(9): 567-576.
DOI URL |
| [2] |
CREAMER R, HANNULA S E, VAN J P, et al., 2016. Ecological network analysis reveals the inter-connection between soil biodiversity and ecosystem function as affected by land use across Europe[J]. Applied Soil Ecology, 97: 112-124.
DOI URL |
| [3] |
FAN K K, DELGADO-BAQUERIZO M, GUO X S, et al., 2020, Microbial resistance promotes plant production in a four-decade nutrient fertilization experiment[J]. Soil Biology & Biochemistry, DOI: 10.1016/j.soilbio.2019.107679.
DOI |
| [4] |
HAO T W, XIANG P Y, MACKEY H R, et al., 2014. A review of biological sulfate conversions in wastewater treatment[J]. Water Research, 65: 1-21.
DOI URL |
| [5] |
ILIOPOULOS D, MALIZOS K N, OIKONOMOU P, et al., 2008. Integrative micro RNA and proteomic approaches identify novel osteoarthritis genes and their collaborative metabolic and inflammatory networks[J]. Plos One, 3(11): e3740.
DOI URL |
| [6] |
JI J, KAKADE A, YU Z S, et al., 2020. Anaerobic membrane bioreactors for treatment of emerging contaminants: A review[J]. Journal of Environmental Management, DOI: 10.1016/j.jenvman.2020.110913.
DOI |
| [7] |
LIU J W, ZHU S Q, LIU X Y, et al., 2020. Spatiotemporal dynamics of the archaeal community in coastal sediments: Assembly process and co-occurrence relationship[J]. ISME Journal, 14(6): 1463-1478.
DOI URL |
| [8] |
MGANGA K Z, RAZAVI B S, KUZYAKOV Y, 2016. Land use affects soil biochemical properties in Mt. Kilimanjaro region[J]. Catena, 141: 22-29.
DOI URL |
| [9] |
RIME T, HARTMANN M, BRUNNER I, et al., 2015. Vertical distribution of the soil microbiota along a successional gradient in a glacier forefield[J]. Molecular Ecology, 24(5): 1091-1108.
DOI URL |
| [10] |
ROMERO-FREIRE A, MINGUEZ L, PELLETIER M, et al., 2018. Assessment of baseline ecotoxicity of sediments from a prospective mining area enriched in light rare earth elements[J]. Science of The Total Environment, 612: 831-839.
DOI URL |
| [11] |
TANG K, BASKARAN V, NeEMATI M, 2009. Bacteria of the sulphur cycle: An overview of microbiology, biokinetics and their role in petroleum and mining industries[J]. Biochemical Engineering Journal, 44(1):73-94.
DOI URL |
| [12] | WANG H X, JIANG L Y, WU X W, et al., 2011. Isolation, identification and degradation characteristics of a sulfide-oxidizing bacterium[J]. Applied and Environmental Biology, 17(5): 706-710. |
| [13] | WANG Z, LUO Y F, ZHENG C L, et al., 2020. Spatial distribution, source identification, and risk assessment of heavy metals in the soils from a mining region: a case study of Bayan Obo in northwestern China[J]. Human and Ecological Risk Assessment 6: 1-20. |
| [14] | 鲍士旦, 2000. 土壤农化分析[M]. 第3版. 北京: 中国农业出版社. |
| BAO S D, 2000. Soil agrochemical analysis[M] 3rd edition. Beijing: China Agricultural Press. | |
| [15] | 陈朝阳, 2011. 南平市植烟土壤pH状况及其与土壤有效养分的关系[J]. 中国农学通报, 27(5): 149-153. |
| CHEN C Y, 2011. The relationships of pH and available nutrient in Nanping Tobacco-growing soil[J]. Chinese Agricultural Science Bulletin, 27(5): 149-153. | |
| [16] | 陈光哲, 姜星宇, 胡洋, 等, 2020. 不同营养程度湖泊中细菌群落组成及其分子生态网络特征[J]. 环境科学研究, 33(2): 375-384. |
| CHEN G Z, JIANG X Y, HU Y, et al., 2020. Characteristics of bacterial communities and their co-occurrence networks in Lake Ecosystem with different trophic states[J]. Research of Environmental Sciences, 33(2): 375-384. | |
| [17] | 陈俊松, 杨渐, 蒋宏忱, 2020. 湖泊硫循环微生物研究进展[J]. 微生物学报, 60(6): 1177-1191. |
| CHEN J S, YANG J, JIANG H C, 2020. Research progress on microbes involved in lacustrine sulfurcycling[J]. Acta Microbiologica Sinica, 60(6): 1177-1191. | |
| [18] | 陈熙, 刘以珍, 李金前, 等, 2016. 稀土尾矿土壤细菌群落结构对植被修复的响应[J]. 生态学报, 36(13): 3943-3950. |
| CHEN X, LIU Y Z, LI J Q, et al., 2016. Response of a rare earth tailing soil bacterial community structure to vegetation restoration[J]. Acta Ecologica Sinica, 36(13): 3943-3950. | |
| [19] | 黄健, 朱旭炎, 陆金, 等, 2019. 狮子山矿区不同土地利用类型对土壤微生物群落多样性的影响[J]. 环境科学, 40(12): 5550-5560. |
| HUANG J, ZHU X Y, LU J, et al., 2019. Effects of Different Land Use Types on Microbial Community Diversity in the Shizishan mining Area[J]. Environmental Science, 40(12): 5550-5560. | |
| [20] | 李冰, 李玉双, 魏建兵, 等, 2020. 不同土地利用方式对土壤细菌分子生态网络的影响[J]. 环境科学, 41(3): 1456-165. |
| LI B, LI Y S, WEI J B, et al., 2020. Effects of different land use typess on the molecular ecological network of soil bacteria[J]. Environmental Science, 41(3): 1456-165. | |
| [21] | 李大乐, 陈建文, 张红, 等, 2021. 铜污染对土壤细菌群落结构及重金属抗性基因的影响[J]. 环境科学学报, 41(3): 1082-1090. |
| LI D L, CHEN J W, ZHANG H, et al., 2021. Effects of copper pollution on soil bacterial community structure and heavy metal resistance genes[J]. Acta Scientiae Circumstantiae, 41(3): 1082-1090. | |
| [22] | 李启艳, 翁炳霖, 李宗勋, 等, 2019. 稀土矿废弃地植被恢复过程中土壤微生物演变[J]. 中国环境科学, 39(10): 4360-4368. |
| LI Q Y, WEN B L, LI Z X, et al., 2019. Soil physicochemical characteristics and microbial evolution during vegetation restoration in ionic rare earth ore heap leaching waste land[J]. China Environmental Science, 39(10): 4360-4368. | |
| [23] | 刘胜洪, 张雅君, 杨妙贤, 等, 2014. 稀土尾矿区土壤重金属污染与优势植物累积特征[J]. 生态环境学报, 23(6): 1042-1045. |
| LIU S H, ZHANG Y J, YANG M X, et al., 2014. Heavy metal contamination of soil and concentration of dominant plants in rare earth mine tailing area[J]. Ecology and Environmental Sciences, 23(6): 1042-1045. | |
| [24] | 任仲宇, 于原晨, 闫振丽, 等, 2016. 稀土矿开采过程中重金属铅活化过程分析[J]. 中国稀土学报, 34(2): 252-256. |
| REN Z Y, YU Y C, YAN Z L, et al., 2016. Simulation study of activation of lead in extraction of ionic rare earth ore[J]. Journal of the Chinese Society of Rare Earth, 34(2): 252-256. | |
| [25] | 师艳丽, 张萌, 姚娜, 等, 2020. 江西定南县离子型稀土尾矿周边水体氮污染状况与分布特征[J]. 环境科学研究, 33(1): 94-103. |
| SHI Y L, ZHANG M, YAO N, et al., 2020. Water Pollution status and nitrogen pollution distribution patterns around ion absorbed rare earth tailings in Dingnan County, Jiangxi Province[J]. Research of Environmental Sciences, 33(1): 94-103. | |
| [26] | 王丙烁, 黄益宗, 王农, 等, 2018. 镍污染土壤修复技术研究进展[J]. 农业环境科学学报, 37(11): 2392-2402. |
| WANG B S, HUANG Y Z, WANG N, et al., 2018. Advances in research on remediation technology of nickel-contaminated soil[J]. Journal of AgroEnvironment Science, 37(11): 2392-2402. | |
| [27] | 王继玥, 刘燕, 刘勇, 等, 2018. 基于高通量测序检测Pb污染对三叶草根际土壤细菌多样性的影响[J]. 环境科学研究, 31(1): 102-110. |
| WANG J Y, LIU Y, LIU Y, et al., 2018. Effect of lead pollution on bacterial diversity in rhizosphere of clover based on high throughput sequencing[J]. Research of Environmental Sciences, 31(1): 102-110. | |
| [28] | 王友生, 侯晓龙, 蔡丽平, 等, 2017. 稀土开采对土壤细菌群落组成与多样性的影响[J]. 中国环境科学, 37(8): 3089-3095. |
| WANG Y S, HOU X L, CAI L P, et al., 2014. Impacts of rare earth mining on soil bacterial community composition and biodiversity[J]. China Environmental Science, 37(8): 3089-3095. | |
| [29] | 杨尚东, 吴俊, 赵久成, 等, 2013. 番茄青枯病罹病植株和健康植株根际土壤理化性状及生物学特性的比较[J]. 中国蔬菜 (22): 64-69. |
| YANG S D, WU J, ZHAO J C, et al., 2013. Physical, chemical and biological characteristics analysis of rhizosphere soils between infected plants of tomato bacterial wilt and non-infected plants[J]. China Vegetables 22: 64-69. | |
| [30] | 于方明, 姚亚威, 谢冬煜, 等, 2020. 泗顶矿区6种土地利用类型土壤微生物群落结构特征[J]. 中国环境科学, 40(5): 2262-2269. |
| YU F M, YAO Y W, XIE D Y, et al., 2020. Study on the soil microbial community structure associated with six land use in Siding mining area[J]. China Environmental Science, 40(5): 2262-2269. | |
| [31] | 张旭博, 徐梦, 史飞, 2020. 藏东南林芝地区典型农业土地利用方式对土壤微生物群落特征的影响[J]. 农业环境科学学报, 39(2): 331-342. |
| ZHANG X B, XU M, SHI F, 2020. Impact of typical agricultural land use on the characteristics of soil microbial communities in the Nyingchi region of southeastern Tibet[J]. Journal of AgroEnvironment Science, 39(2): 331-342. | |
| [32] | 中华人民共和国生态环境部, 2016. 土壤和沉积物 12 种金属元素的测定王水提取-电感耦合等离子体质谱法[M]. 北京: 中国环境科学出版社: 1-19. |
| Ministry of Environmental Protection of the People's Republic of China, 2016. Soil and sediment-Determination of aqua regia extracts of 12 metal elements-Inductively coupled plasma mass spectrometry[M]. Beijing: China Environmental Science Press: 1-19. | |
| [33] | 周彩云, 张嵚, 赵小敏, 等, 2019. 赣南某原地浸析稀土尾矿复垦前后土壤质量变化[J]. 农业资源与环境学报, 36(1): 89-95. |
| ZHOU C Y, ZHANG Q, ZHAO X M, et al., 2019. Soil quality changes of rare earth tailings before and after reclamation in south Jiangxi Province, China[J]. Journal of Agricultural Resources and Environment, 36(1): 89-95. |
| [1] | 杜丹丹, 高瑞忠, 房丽晶, 谢龙梅. 旱区盐湖盆地土壤重金属空间变异及对土壤理化因子的响应[J]. 生态环境学报, 2023, 32(6): 1123-1132. |
| [2] | 王铁铮, 瞿心悦, 刘春香, 李有志. 东江湖水质时空变化规律及其与流域土地利用的关系[J]. 生态环境学报, 2023, 32(4): 722-732. |
| [3] | 冯树娜, 吕家珑, 何海龙. KI淋洗对黄绵土汞污染的去除效果及土壤理化性状的影响[J]. 生态环境学报, 2023, 32(4): 776-783. |
| [4] | 陈敏毅, 朱航海, 佘伟铎, 尹光彩, 黄祖照, 杨巧玲. 珠三角某遗留造船厂场地土壤重金属人体健康风险评估及源解析[J]. 生态环境学报, 2023, 32(4): 794-804. |
| [5] | 秦浩, 李蒙爱, 高劲, 陈凯龙, 张殷波, 张峰. 芦芽山不同海拔灌丛土壤细菌群落组成和多样性研究[J]. 生态环境学报, 2023, 32(3): 459-468. |
| [6] | 肖洁芸, 周伟, 石佩琪. 土壤重金属含量高光谱反演[J]. 生态环境学报, 2023, 32(1): 175-182. |
| [7] | 向兴, 满百膺, 张俊忠, 罗洋, 毛小涛, 张超, 孙丙华, 王希. 黄山土壤细菌群落及氮循环功能群的垂向分布格局[J]. 生态环境学报, 2023, 32(1): 56-69. |
| [8] | 黄宏, 郑欣芸, 李迎东, 赵旭, 俞锦辰, 汪振华. 大陈岛海域不同年龄褐菖鲉对重金属富集作用研究[J]. 生态环境学报, 2022, 31(9): 1885-1891. |
| [9] | 马闯, 王雨阳, 周通, 吴龙华. 污染土壤颗粒态有机质镉锌富集特征及其解吸行为研究[J]. 生态环境学报, 2022, 31(9): 1892-1900. |
| [10] | 王礼霄, 刘晋仙, 柴宝峰. 华北亚高山土壤细菌群落及氮循环对退耕还草的响应[J]. 生态环境学报, 2022, 31(8): 1537-1546. |
| [11] | 陶玲, 黄磊, 周怡蕾, 李中兴, 任珺. 污泥-凹凸棒石共热解生物炭对矿区土壤重金属生物有效性和环境风险的影响[J]. 生态环境学报, 2022, 31(8): 1637-1646. |
| [12] | 李莹, 张洲, 杨高明, 祖艳群, 李博, 陈建军. 湿地植物根系泌氧能力和根表铁膜与根系吸收重金属的关系[J]. 生态环境学报, 2022, 31(8): 1657-1666. |
| [13] | 蔡国俊, 袁桂香, 符辉. 基于文献计量分析的生态网络研究现状和趋势[J]. 生态环境学报, 2022, 31(8): 1690-1699. |
| [14] | 罗松英, 李秋霞, 邱锦坤, 邓素炎, 李一锋, 陈碧珊. 南三岛土壤-红树植物系统中重金属形态特征及迁移转化规律[J]. 生态环境学报, 2022, 31(7): 1409-1416. |
| [15] | 董乐恒, 王旭刚, 陈曼佳, 王子豪, 孙丽蓉, 石兆勇, 吴琪琪. 光照和避光条件下石灰性水稻土Fe氧化还原与Cu活性关系研究[J]. 生态环境学报, 2022, 31(7): 1448-1455. |
| 阅读次数 | ||||||
|
全文 |
|
|||||
|
摘要 |
|
|||||