生态环境学报 ›› 2021, Vol. 30 ›› Issue (5): 1005-1016.DOI: 10.16258/j.cnki.1674-5906.2021.05.013
包宇飞1,2( ), 胡明明1,2,*(), 王殿常3, 吴兴华3, 王雨春1,2,3,*(), 李姗泽1,2, 王启文1,2, 温洁1,2
收稿日期:2020-11-15
出版日期:2021-05-18
发布日期:2021-08-06
通讯作者:
王雨春,正高级工程师,E-mail:wangyc@iwhr.com作者简介:包宇飞(1990年生),男,工程师,博士,主要从事流域生源物质地球化学循环研究。E-mail:baoyf@iwhr.com
基金资助:
BAO Yufei1,2(), HU Mingming1,2,*(), WANG Dianchang3, WU Xinghua3, WANG Yuchun1,2,3,*(), LI Shanze1,2, WANG Qiwen1,2, WEN Jie1,2
Received:2020-11-15
Online:2021-05-18
Published:2021-08-06
摘要:
黄柏河为长江左岸的一级支流,是宜昌市重要的水源地和长江流域最大的磷矿基地之一,评价其沉积物营养盐和重金属污染特征,对于揭示高磷矿背景区域沉积物的污染状况及其控制与管理具有重要意义,也是当前长江大保护形势下的必然需求。分别采集了黄柏河4个梯级水库库首、库中和库尾的表层沉积物,研究分析了沉积物中营养盐和重金属的质量分数及分布特征,采用综合污染指数法和有机污染指数法评价了表层沉积物营养盐污染状况,使用潜在生态风险指数法和地累积指数法评价了沉积物6种重金属的污染状况。结果表明:黄柏河梯级水库表层沉积物总有机碳(TOC)和总氮(TN)平均质量分数分别为26.9 g∙kg-1和1500.4 mg∙kg-1,其中最下游的尚家河水库质量分数最小,TOC和TN污染主要处于轻度到中度污染水平;总磷(TP)质量分数空间差异性较大,介于622.2—9631.5 mg∙kg-1之间,受流域磷矿矿点分布以及水库拦截作用的影响,TP分布从上游至下游呈现递减的趋势,流域整体处于磷重度污染水平。重金属锌(Zn)、铅(Pb)、铜(Cu)、砷(As)、镉(Cd)和汞(Hg)的平均质量分数分别为128.63、39.37、27.95、10.23、0.35、0.26 mg∙kg-1,潜在生态风险指数和地累积指数评价表明黄柏河梯级水库表层沉积物Hg的生态风险较高,其次为Cd,剩余4种重金属的生态风险较低。沉积物碳氮比(TOC/TN)和Pearson相关性分析指出,沉积物有机质来源主要为陆源性输入,重金属Hg和Cd输入可能分别与面源性的TN输入和磷矿开采导致的TP输入具有同源性。
中图分类号:
包宇飞, 胡明明, 王殿常, 吴兴华, 王雨春, 李姗泽, 王启文, 温洁. 黄柏河梯级水库沉积物营养盐与重金属分布特征及污染评价[J]. 生态环境学报, 2021, 30(5): 1005-1016.
BAO Yufei, HU Mingming, WANG Dianchang, WU Xinghua, WANG Yuchun, LI Shanze, WANG Qiwen, WEN Jie. Distribution and Pollution Assessment of Nutrients and Heavy Metals in Sediments of the Cascade Reservoirs in Huangbai River[J]. Ecology and Environment, 2021, 30(5): 1005-1016.
| 水库 Reservoir | 流域面积 Catchment area/km2 | 年均流量 Average annual runoff/ (108 m3) | 总库容 Total storage capacity/ (104 m3) | 磷矿开采址 Phosphate mining site/unit |
|---|---|---|---|---|
| 玄庙观水库 XMG | 380 | 1.76 | 4054 | 45 |
| 天福庙水库 TFM | 554 | 2.69 | 6420 | |
| 西北口水库 XBK | 862 | 3.88 | 21000 | 11 |
| 尚家河水库 SJH | 937 | 4.48 | 1692 | 0 |
表1 黄柏河流域4座水库的主要参数特征
Table 1 Main characteristics of four reservoirs in the Huangbai River Basin
| 水库 Reservoir | 流域面积 Catchment area/km2 | 年均流量 Average annual runoff/ (108 m3) | 总库容 Total storage capacity/ (104 m3) | 磷矿开采址 Phosphate mining site/unit |
|---|---|---|---|---|
| 玄庙观水库 XMG | 380 | 1.76 | 4054 | 45 |
| 天福庙水库 TFM | 554 | 2.69 | 6420 | |
| 西北口水库 XBK | 862 | 3.88 | 21000 | 11 |
| 尚家河水库 SJH | 937 | 4.48 | 1692 | 0 |
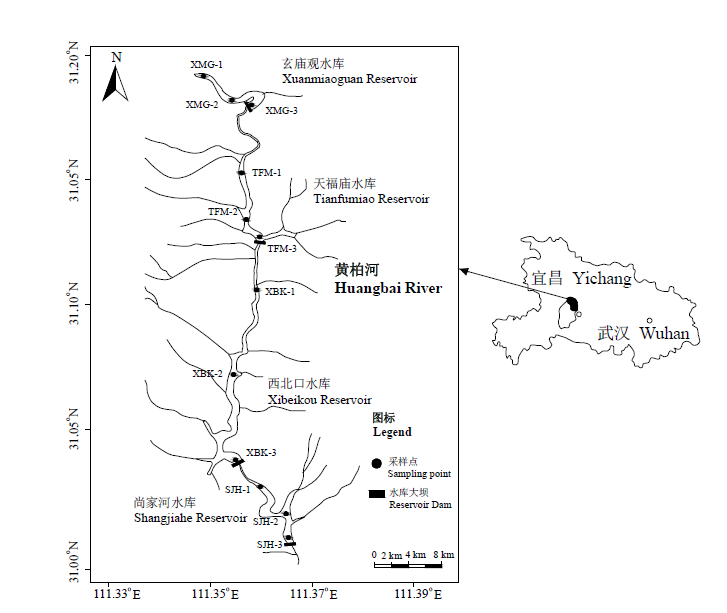
图1 黄柏河梯级水库表层沉积物采样点位图
Fig. 1 Sampling sites for the surface sediment in the cascade reservoirs of Huangbai River
| 水平 Level | STN | STP | F | 等级 Grade |
|---|---|---|---|---|
| 1 | STN<1.0 | STP<0.5 | F<1.0 | 清洁Clean (Ⅰ) |
| 2 | 1.0≤STN≤1.5 | 0.5≤STN≤1.0 | 1.0≤F≤1.5 | 轻度污染 Low pollution (Ⅱ) |
| 3 | 1.5<STN≤2.0 | 1.0<STN≤1.5 | 1.5<F≤2.0 | 中度污染 Moderate pollution (Ⅲ) |
| 4 | STN>2.0 | STP>1.5 | F>2.0 | 重度污染 Heavy pollution (Ⅳ) |
表2 沉积物氮磷污染程度评价标准
Table 2 Assessment standards for the degree of nitrogen and phosphorus pollutions for sediments
| 水平 Level | STN | STP | F | 等级 Grade |
|---|---|---|---|---|
| 1 | STN<1.0 | STP<0.5 | F<1.0 | 清洁Clean (Ⅰ) |
| 2 | 1.0≤STN≤1.5 | 0.5≤STN≤1.0 | 1.0≤F≤1.5 | 轻度污染 Low pollution (Ⅱ) |
| 3 | 1.5<STN≤2.0 | 1.0<STN≤1.5 | 1.5<F≤2.0 | 中度污染 Moderate pollution (Ⅲ) |
| 4 | STN>2.0 | STP>1.5 | F>2.0 | 重度污染 Heavy pollution (Ⅳ) |
| 项目 Items (OI) | <0.05 | 0.05‒0.2 | 0.2‒0.5 | ≥0.5 |
|---|---|---|---|---|
| 等级 Grade | 清洁 Clean (Ⅰ) | 轻度污染 Low pollution (Ⅱ) | 中度污染 Moderate pollution (Ⅲ) | 重度污染 Heavy pollution (Ⅳ) |
表3 沉积物有机污染指数评价标准
Table 3 Assessment standards for the organic pollution index for sediments
| 项目 Items (OI) | <0.05 | 0.05‒0.2 | 0.2‒0.5 | ≥0.5 |
|---|---|---|---|---|
| 等级 Grade | 清洁 Clean (Ⅰ) | 轻度污染 Low pollution (Ⅱ) | 中度污染 Moderate pollution (Ⅲ) | 重度污染 Heavy pollution (Ⅳ) |
| 重金属 Heavy metal | Zn | Cu | Pb | As | Cd | Hg |
|---|---|---|---|---|---|---|
| 湖北省土壤背景值 Background value of soil in Hubei Province/(mg∙kg-1) | 83.6 | 30.7 | 26.7 | 12.3 | 0.172 | 0.08 |
| 毒性系数 Toxicity Coefficient | 1 | 5 | 5 | 10 | 30 | 40 |
表4 重金属评价背景值和毒性系数
Table 4 Reference values and toxicity coefficients of heavy metals
| 重金属 Heavy metal | Zn | Cu | Pb | As | Cd | Hg |
|---|---|---|---|---|---|---|
| 湖北省土壤背景值 Background value of soil in Hubei Province/(mg∙kg-1) | 83.6 | 30.7 | 26.7 | 12.3 | 0.172 | 0.08 |
| 毒性系数 Toxicity Coefficient | 1 | 5 | 5 | 10 | 30 | 40 |
| 潜在生态风险指数 Potential ecological risk coefficients( | 潜在生态风险 指数 Risk indices (RI) | 风险等级 Risk degree |
|---|---|---|
| <150 | 轻微 Slight | |
| 40≤ | 150≤RI<300 | 中等 Medium |
| 80≤ | 300≤RI<600 | 强 Strong |
| 160≤ | 600≤RI<1200 | 很强 Very strong |
| ≥1200 | 极强 Extremely strong |
表5 沉积物重金属潜在生态风险程度划分标准
Table 5 Classification for the potential ecological risk of heavy metals in sediments
| 潜在生态风险指数 Potential ecological risk coefficients( | 潜在生态风险 指数 Risk indices (RI) | 风险等级 Risk degree |
|---|---|---|
| <150 | 轻微 Slight | |
| 40≤ | 150≤RI<300 | 中等 Medium |
| 80≤ | 300≤RI<600 | 强 Strong |
| 160≤ | 600≤RI<1200 | 很强 Very strong |
| ≥1200 | 极强 Extremely strong |
| 项目 Item (Igeo) | ≤0 | 0‒1 | 1‒2 | 2‒3 | 3‒4 | 4‒5 | >5 |
|---|---|---|---|---|---|---|---|
| 程度 Degree | 清洁 Clean | 轻度 Slight | 轻中度 Slight mediate | 中度 Mediate | 重度 Strong | 严重 Very strong | 极严重 Extremely strong |
| 级数 Level | 0 | 1 | 2 | 3 | 4 | 5 | 6 |
表6 Igeo与重金属污染程度划分标准
Table 6 Classification for the heavy metal pollution and Igeo
| 项目 Item (Igeo) | ≤0 | 0‒1 | 1‒2 | 2‒3 | 3‒4 | 4‒5 | >5 |
|---|---|---|---|---|---|---|---|
| 程度 Degree | 清洁 Clean | 轻度 Slight | 轻中度 Slight mediate | 中度 Mediate | 重度 Strong | 严重 Very strong | 极严重 Extremely strong |
| 级数 Level | 0 | 1 | 2 | 3 | 4 | 5 | 6 |
| 采样点 Sampling sites | t/℃ | pH | EC/(μS cm-1) | ρ(DO)/(mg∙L-1) | ρ(TN)/(mg∙L-1) | ρ(TP)/(mg∙L-1) | ρ(Chl)/(μg∙L-1) | |
|---|---|---|---|---|---|---|---|---|
| XMG | XMG-1 | 13.36 | 8.8 | 430.7 | 9.68 | 2.02 | 0.22 | 11.01 |
| XMG-2 | 14.45 | 8.1 | 438.2 | 9.27 | 1.98 | 0.17 | 8.85 | |
| XMG-3 | 13.59 | 8.2 | 427.9 | 9.11 | 1.76 | 0.21 | 9.48 | |
| TFM | TFM-1 | 14.98 | 8.4 | 486.5 | 8.66 | 1.93 | 0.18 | 7.35 |
| TFM-2 | 15.36 | 8.5 | 487.6 | 8.42 | 2.07 | 0.19 | 5.46 | |
| TFM-3 | 14.62 | 8.5 | 486.9 | 7.26 | 1.82 | 0.15 | 4.49 | |
| XBK | XBK-1 | 14.93 | 8.6 | 423.7 | 8.32 | 1.89 | 0.09 | 4.51 |
| XBK-2 | 15.76 | 8.4 | 426.8 | 7.92 | 2.05 | 0.06 | 3.65 | |
| XBK-3 | 15.38 | 8.4 | 429.1 | 7.56 | 2.29 | 0.09 | 2.32 | |
| SJH | SJH-1 | 15.34 | 8.1 | 485.5 | 7.66 | 1.72 | 0.06 | 1.68 |
| SJH-2 | 14.53 | 8.3 | 476.9 | 7.89 | 1.58 | 0.08 | 1.03 | |
| SJH-3 | 14.67 | 8.3 | 479.6 | 7.69 | 1.87 | 0.06 | 1.87 | |
表7 采样点表层水体理化性质
Table 7 Characteristics of surface water of the sampling sites
| 采样点 Sampling sites | t/℃ | pH | EC/(μS cm-1) | ρ(DO)/(mg∙L-1) | ρ(TN)/(mg∙L-1) | ρ(TP)/(mg∙L-1) | ρ(Chl)/(μg∙L-1) | |
|---|---|---|---|---|---|---|---|---|
| XMG | XMG-1 | 13.36 | 8.8 | 430.7 | 9.68 | 2.02 | 0.22 | 11.01 |
| XMG-2 | 14.45 | 8.1 | 438.2 | 9.27 | 1.98 | 0.17 | 8.85 | |
| XMG-3 | 13.59 | 8.2 | 427.9 | 9.11 | 1.76 | 0.21 | 9.48 | |
| TFM | TFM-1 | 14.98 | 8.4 | 486.5 | 8.66 | 1.93 | 0.18 | 7.35 |
| TFM-2 | 15.36 | 8.5 | 487.6 | 8.42 | 2.07 | 0.19 | 5.46 | |
| TFM-3 | 14.62 | 8.5 | 486.9 | 7.26 | 1.82 | 0.15 | 4.49 | |
| XBK | XBK-1 | 14.93 | 8.6 | 423.7 | 8.32 | 1.89 | 0.09 | 4.51 |
| XBK-2 | 15.76 | 8.4 | 426.8 | 7.92 | 2.05 | 0.06 | 3.65 | |
| XBK-3 | 15.38 | 8.4 | 429.1 | 7.56 | 2.29 | 0.09 | 2.32 | |
| SJH | SJH-1 | 15.34 | 8.1 | 485.5 | 7.66 | 1.72 | 0.06 | 1.68 |
| SJH-2 | 14.53 | 8.3 | 476.9 | 7.89 | 1.58 | 0.08 | 1.03 | |
| SJH-3 | 14.67 | 8.3 | 479.6 | 7.69 | 1.87 | 0.06 | 1.87 | |
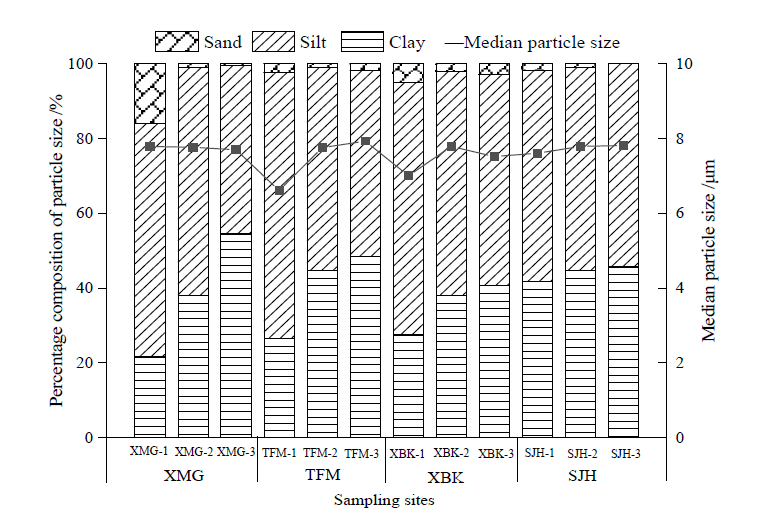
图2 黄柏河梯级水库表层沉积物粒度分布砂粒:Sand。粉砂:Silt。粘土:Clay粒径组成百分比/%:Percentage composition of particle size/%中值粒径/μm:Median particle size/μm
Fig. 2 Granularity distribution in surface sediment of the cascade reservoirs in Huangbai River
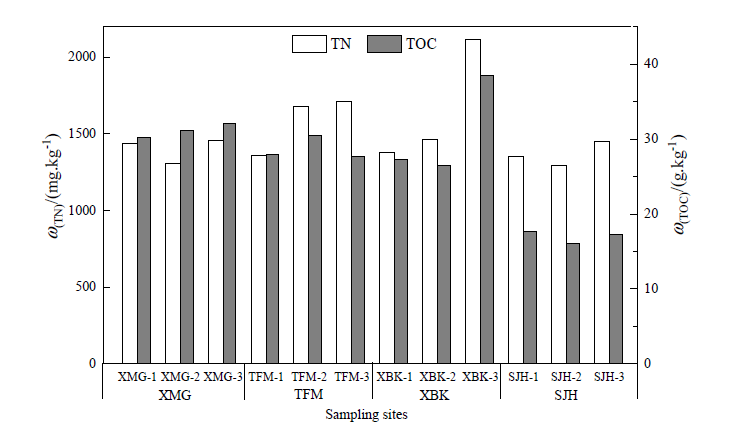
图3 黄柏河流域梯级水库有机碳和氮质量分数及其分布特征
Fig. 3 The contents and distribution of organic matter and nitrogen in the cascade reservoirs in the Huangbai River
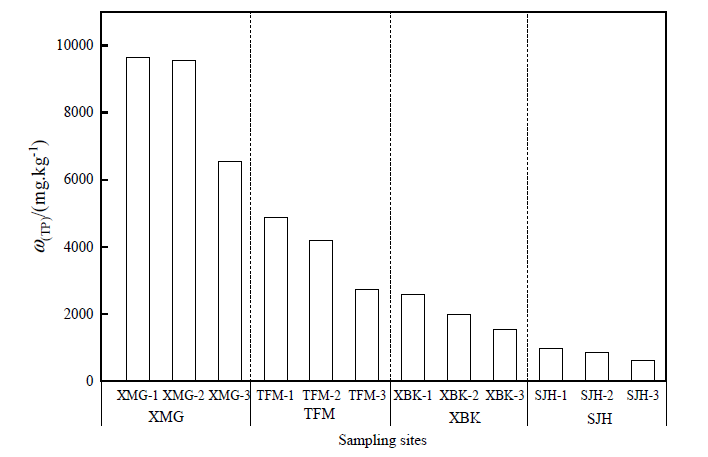
图4 黄柏河流域梯级水库总磷质量分数及其分布特征
Fig. 4 The contents and distribution of TP in the cascade reservoirs in the Huangbai River
| 采样点 Sampling sites | Cd | Hg | As | Cu | Pb | Zn | |
|---|---|---|---|---|---|---|---|
| XMG | XMG-1 | 0.74 | 0.22 | 11.3 | 25.2 | 46.8 | 191.0 |
| XMG-2 | 0.37 | 0.25 | 11.7 | 25.7 | 47.6 | 175.0 | |
| XMG-3 | 0.39 | 0.24 | 10.6 | 23.6 | 49.7 | 173.6 | |
| TFM | TFM-1 | 0.40 | 0.28 | 10.0 | 23.8 | 32.7 | 94.6 |
| TFM-2 | 0.39 | 0.27 | 12.5 | 26.9 | 40.8 | 125.8 | |
| TFM-3 | 0.28 | 0.29 | 11.6 | 31.8 | 36.9 | 116.0 | |
| XBK | XBK-1 | 0.49 | 0.26 | 10.1 | 30.0 | 43.6 | 105.9 |
| XBK-2 | 0.31 | 0.26 | 8.6 | 28.6 | 40.7 | 109.7 | |
| XBK-3 | 0.32 | 0.28 | 7.9 | 28.4 | 40.1 | 101.0 | |
| SJH | SJH-1 | 0.17 | 0.25 | 10.1 | 28.7 | 31.8 | 112.1 |
| SJH-2 | 0.17 | 0.23 | 9.1 | 26.3 | 30.5 | 120.6 | |
| SJH-3 | 0.18 | 0.28 | 9.2 | 30.4 | 31.2 | 118.3 | |
| 背景值 Background values | ‒ | 0.172 | 0.08 | 12.3 | 30.7 | 26.7 | 83.6 |
表8 黄柏河梯级水库表层沉积物重金属污染情况
Table 8 The pollution of heavy metals in the surface sediments of the Huangbai River mg∙kg-1
| 采样点 Sampling sites | Cd | Hg | As | Cu | Pb | Zn | |
|---|---|---|---|---|---|---|---|
| XMG | XMG-1 | 0.74 | 0.22 | 11.3 | 25.2 | 46.8 | 191.0 |
| XMG-2 | 0.37 | 0.25 | 11.7 | 25.7 | 47.6 | 175.0 | |
| XMG-3 | 0.39 | 0.24 | 10.6 | 23.6 | 49.7 | 173.6 | |
| TFM | TFM-1 | 0.40 | 0.28 | 10.0 | 23.8 | 32.7 | 94.6 |
| TFM-2 | 0.39 | 0.27 | 12.5 | 26.9 | 40.8 | 125.8 | |
| TFM-3 | 0.28 | 0.29 | 11.6 | 31.8 | 36.9 | 116.0 | |
| XBK | XBK-1 | 0.49 | 0.26 | 10.1 | 30.0 | 43.6 | 105.9 |
| XBK-2 | 0.31 | 0.26 | 8.6 | 28.6 | 40.7 | 109.7 | |
| XBK-3 | 0.32 | 0.28 | 7.9 | 28.4 | 40.1 | 101.0 | |
| SJH | SJH-1 | 0.17 | 0.25 | 10.1 | 28.7 | 31.8 | 112.1 |
| SJH-2 | 0.17 | 0.23 | 9.1 | 26.3 | 30.5 | 120.6 | |
| SJH-3 | 0.18 | 0.28 | 9.2 | 30.4 | 31.2 | 118.3 | |
| 背景值 Background values | ‒ | 0.172 | 0.08 | 12.3 | 30.7 | 26.7 | 83.6 |
| 采样点 Sampling sites | STN | Level | STP | Level | FF | Level | OI | Level | |
|---|---|---|---|---|---|---|---|---|---|
| XMG | XMG-1 | 1.44 | Ⅱ | 22.93 | Ⅳ | 18.33 | Ⅳ | 0.36 | Ⅲ |
| XMG-2 | 1.30 | Ⅱ | 22.73 | Ⅳ | 18.18 | Ⅳ | 0.39 | Ⅲ | |
| XMG-3 | 1.45 | Ⅱ | 15.61 | Ⅳ | 12.58 | Ⅳ | 0.44 | Ⅲ | |
| TFM | TFM-1 | 1.36 | Ⅱ | 11.60 | Ⅳ | 9.39 | Ⅳ | 0.36 | Ⅲ |
| TFM-2 | 1.68 | Ⅲ | 9.96 | Ⅳ | 8.15 | Ⅳ | 0.48 | Ⅲ | |
| TFM-3 | 1.71 | Ⅲ | 6.51 | Ⅳ | 5.44 | Ⅳ | 0.45 | Ⅲ | |
| XBK | XBK-1 | 1.38 | Ⅱ | 6.12 | Ⅳ | 5.08 | Ⅳ | 0.36 | Ⅲ |
| XBK-2 | 1.46 | Ⅱ | 4.74 | Ⅳ | 4.00 | Ⅳ | 0.37 | Ⅲ | |
| XBK-3 | 2.11 | Ⅳ | 3.67 | Ⅳ | 3.31 | Ⅳ | 0.77 | Ⅳ | |
| SJH | SJH-1 | 1.36 | Ⅱ | 2.35 | Ⅳ | 2.11 | Ⅳ | 0.23 | Ⅲ |
| SJH-2 | 1.30 | Ⅱ | 2.02 | Ⅳ | 1.85 | Ⅲ | 0.20 | Ⅲ | |
| SJH-3 | 1.45 | Ⅱ | 1.48 | Ⅲ | 1.47 | Ⅲ | 0.24 | Ⅲ | |
表9 黄柏河水库表层沉积物营养盐污染评价指数
Table 9 Evaluation index of nutrient pollution in surface sediment of the reservoir in Huangbai River
| 采样点 Sampling sites | STN | Level | STP | Level | FF | Level | OI | Level | |
|---|---|---|---|---|---|---|---|---|---|
| XMG | XMG-1 | 1.44 | Ⅱ | 22.93 | Ⅳ | 18.33 | Ⅳ | 0.36 | Ⅲ |
| XMG-2 | 1.30 | Ⅱ | 22.73 | Ⅳ | 18.18 | Ⅳ | 0.39 | Ⅲ | |
| XMG-3 | 1.45 | Ⅱ | 15.61 | Ⅳ | 12.58 | Ⅳ | 0.44 | Ⅲ | |
| TFM | TFM-1 | 1.36 | Ⅱ | 11.60 | Ⅳ | 9.39 | Ⅳ | 0.36 | Ⅲ |
| TFM-2 | 1.68 | Ⅲ | 9.96 | Ⅳ | 8.15 | Ⅳ | 0.48 | Ⅲ | |
| TFM-3 | 1.71 | Ⅲ | 6.51 | Ⅳ | 5.44 | Ⅳ | 0.45 | Ⅲ | |
| XBK | XBK-1 | 1.38 | Ⅱ | 6.12 | Ⅳ | 5.08 | Ⅳ | 0.36 | Ⅲ |
| XBK-2 | 1.46 | Ⅱ | 4.74 | Ⅳ | 4.00 | Ⅳ | 0.37 | Ⅲ | |
| XBK-3 | 2.11 | Ⅳ | 3.67 | Ⅳ | 3.31 | Ⅳ | 0.77 | Ⅳ | |
| SJH | SJH-1 | 1.36 | Ⅱ | 2.35 | Ⅳ | 2.11 | Ⅳ | 0.23 | Ⅲ |
| SJH-2 | 1.30 | Ⅱ | 2.02 | Ⅳ | 1.85 | Ⅲ | 0.20 | Ⅲ | |
| SJH-3 | 1.45 | Ⅱ | 1.48 | Ⅲ | 1.47 | Ⅲ | 0.24 | Ⅲ | |
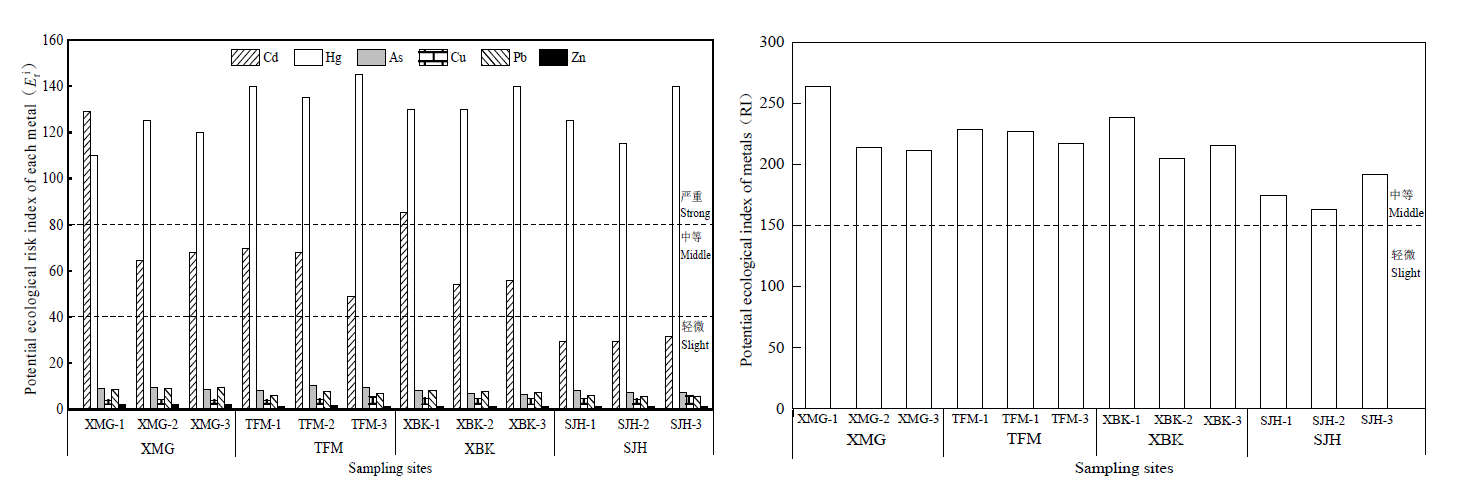
图5 黄柏河流域水库表层沉积物重金属潜在生态风险系数
Fig. 5 Potential ecological risk coefficient of heavy metals in the surface sediments of reservoirs

图6 黄柏河流域水库表层沉积物重金属地积累指数
Fig. 6 The accumulation index of heavy metals in surface sediments of reservoirs in Huangbai River
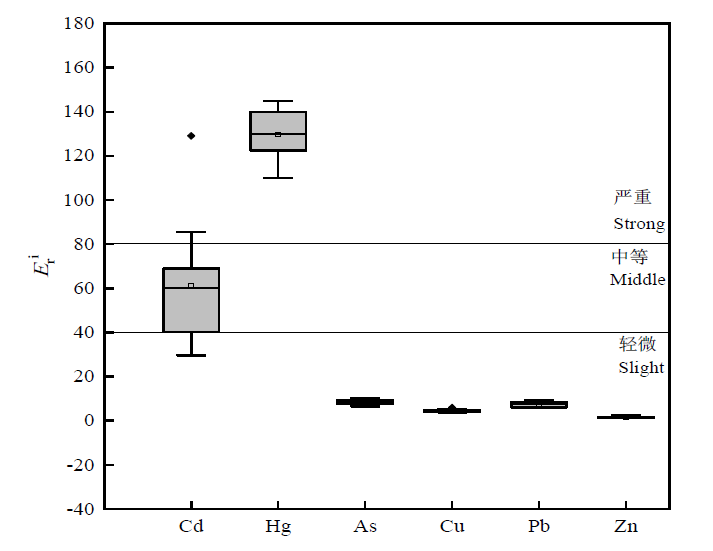
图7 重金属潜在生态风险指数箱图
Fig. 7 The box plot of potential ecological risk coefficient
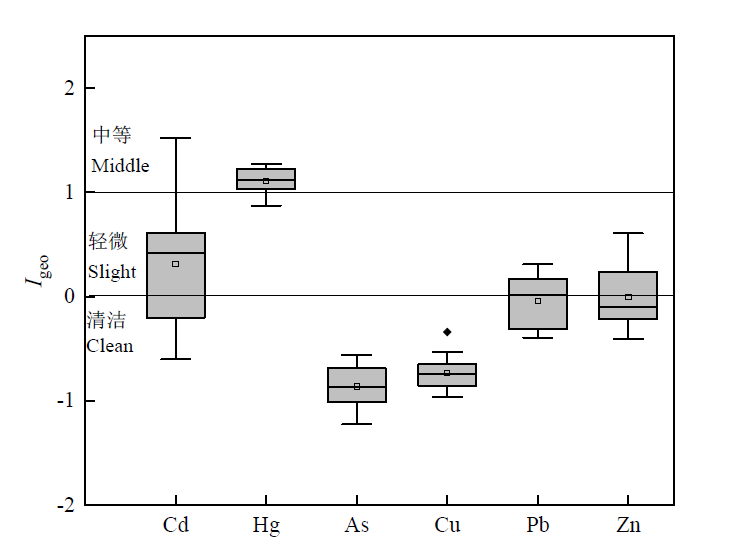
图8 重金属地累积指数箱图
Fig. 8 The box plot of geo-accumulation index
| 水库 Reservoir | ω(TOC)/ (g∙kg-1) | ω(TN)/ (mg∙kg-1) | ω(TP)/ (mg∙kg-1) | 水库 Reservoir | ω(TOC)/ (g∙kg-1) | ω(TN)/ (mg∙kg-1) | ω(TP)/ (mg∙kg-1) |
|---|---|---|---|---|---|---|---|
| 三峡水库香溪河* Xiangxi Tributary of the Three Gorges Reservoir* | 8.70 | 1106 | 951 | 金盆水库 Jinpen Reservoir | 40.72 | 1132 | 1131 |
| 漫湾水库 Manwan reservoir | 3.85 | 650 | 700 | 鹤地水库 Hedi Reservoir | 74.07 | 2358 | 670 |
| 丹江口水库 Danjiankou Reservoir | 14.99 | 1340 | 570 | 玄庙观水库 XMG Reservoir | 31.1 | 1399.3 | 8578.0 |
| 山美水库 Shanmei Reservoir | 19.14 | 1180 | 642 | 天福庙水库 TFM Reservoir | 28.7 | 1582.9 | 3928.4 |
| 大溪水库* Daxi Reservoir* | 6.96 | 1657 | 324 | 西北口水库 XBK Reservoir | 30.7 | 1651.3 | 2034.8 |
| 潘大水库 Panda Reservoir | 72.51 | 1648.7 | 2790.9 | 尚家河水库 SJH Reservoir | 17.0 | 1368.0 | 818.6 |
表10 不同水库沉积物平均营养盐质量分数对比
Table 10 Comparison of the mean nutrient contents in sediments from different reservoirs
| 水库 Reservoir | ω(TOC)/ (g∙kg-1) | ω(TN)/ (mg∙kg-1) | ω(TP)/ (mg∙kg-1) | 水库 Reservoir | ω(TOC)/ (g∙kg-1) | ω(TN)/ (mg∙kg-1) | ω(TP)/ (mg∙kg-1) |
|---|---|---|---|---|---|---|---|
| 三峡水库香溪河* Xiangxi Tributary of the Three Gorges Reservoir* | 8.70 | 1106 | 951 | 金盆水库 Jinpen Reservoir | 40.72 | 1132 | 1131 |
| 漫湾水库 Manwan reservoir | 3.85 | 650 | 700 | 鹤地水库 Hedi Reservoir | 74.07 | 2358 | 670 |
| 丹江口水库 Danjiankou Reservoir | 14.99 | 1340 | 570 | 玄庙观水库 XMG Reservoir | 31.1 | 1399.3 | 8578.0 |
| 山美水库 Shanmei Reservoir | 19.14 | 1180 | 642 | 天福庙水库 TFM Reservoir | 28.7 | 1582.9 | 3928.4 |
| 大溪水库* Daxi Reservoir* | 6.96 | 1657 | 324 | 西北口水库 XBK Reservoir | 30.7 | 1651.3 | 2034.8 |
| 潘大水库 Panda Reservoir | 72.51 | 1648.7 | 2790.9 | 尚家河水库 SJH Reservoir | 17.0 | 1368.0 | 818.6 |
| 影响因素 Factors | t | pH | EC | DO | ρ(TN) | ρ(TP) | ω(TOC) | ω(TN) | ω(TP) |
|---|---|---|---|---|---|---|---|---|---|
| Chl | -0.490 | 0.358 | -0.133 | 0.832** | 0.301 | 0.921** | 0.531 | -0.175 | 0.951** |
表11 叶绿素与环境因子相关分析
Table 11 Correlation between chlorophyll and Environmental factors
| 影响因素 Factors | t | pH | EC | DO | ρ(TN) | ρ(TP) | ω(TOC) | ω(TN) | ω(TP) |
|---|---|---|---|---|---|---|---|---|---|
| Chl | -0.490 | 0.358 | -0.133 | 0.832** | 0.301 | 0.921** | 0.531 | -0.175 | 0.951** |
| 水库 Reservoir | Cd | Hg | As | Cu | Pb | Zn |
|---|---|---|---|---|---|---|
| 三峡水库汝溪河 Ruxi Tributary of the Three Gorges Reservoir | 0.39 | 0.07 | ‒ | 32.69 | 29.12 | 122.11 |
| 小浪底水库 Xiaolangdi Reservoir | 0.23 | 0.10 | 18.96 | 31.99 | 40.19 | ‒ |
| 丹江口水库 Danjiangkou Reservoir | 0.37 | ‒ | ‒ | 13.91 | 12.92 | 195.74 |
| 普定水库 Puding Reservoir | 3.9 | 0.23 | 48.7 | 150.3 | 284.9 | 546.9 |
| 大洋水库 Dayang Reservoir | 0.41 | 0.36 | 3.46 | 19.5 | 86.19 | 126.7 |
| 于桥水库 Yuqiao Reservoir | 0.12 | 0.14 | 6.07 | 34.23 | 7.24 | 91.20 |
| 漫湾水库 Manwan Reservoir | 1.77 | ‒ | 45.06 | 45.45 | 59.65 | 169.91 |
| 陆浑水库 Luhun Reservoir | 1.49 | ‒ | ‒ | 48.18 | 166.31 | 157.38 |
| 黄柏河水库 The reservoirs of Huangbai River | 0.35 | 0.26 | 10.23 | 27.95 | 39.37 | 128.63 |
表12 不同水体沉积物平均重金属质量分数对比
Table 12 Comparison of heavy metal contents in sediments from different lakes and reservoirs mg∙kg-1
| 水库 Reservoir | Cd | Hg | As | Cu | Pb | Zn |
|---|---|---|---|---|---|---|
| 三峡水库汝溪河 Ruxi Tributary of the Three Gorges Reservoir | 0.39 | 0.07 | ‒ | 32.69 | 29.12 | 122.11 |
| 小浪底水库 Xiaolangdi Reservoir | 0.23 | 0.10 | 18.96 | 31.99 | 40.19 | ‒ |
| 丹江口水库 Danjiangkou Reservoir | 0.37 | ‒ | ‒ | 13.91 | 12.92 | 195.74 |
| 普定水库 Puding Reservoir | 3.9 | 0.23 | 48.7 | 150.3 | 284.9 | 546.9 |
| 大洋水库 Dayang Reservoir | 0.41 | 0.36 | 3.46 | 19.5 | 86.19 | 126.7 |
| 于桥水库 Yuqiao Reservoir | 0.12 | 0.14 | 6.07 | 34.23 | 7.24 | 91.20 |
| 漫湾水库 Manwan Reservoir | 1.77 | ‒ | 45.06 | 45.45 | 59.65 | 169.91 |
| 陆浑水库 Luhun Reservoir | 1.49 | ‒ | ‒ | 48.18 | 166.31 | 157.38 |
| 黄柏河水库 The reservoirs of Huangbai River | 0.35 | 0.26 | 10.23 | 27.95 | 39.37 | 128.63 |
| 重金属 Heavy Metal | Cd | Hg | As | Cu | Pb | Zn | TOC | TN | TP |
|---|---|---|---|---|---|---|---|---|---|
| Cd | 1 | ||||||||
| Hg | -0.382 | 1 | |||||||
| As | 0.442 | -0.116 | 1 | ||||||
| Cu | -0.472 | 0.528 | -0.241 | 1 | |||||
| Pb | 0.746** | -0.359 | 0.384 | -0.435 | 1 | ||||
| Zn | 0.611* | -0.680 | 0.518 | -0.415 | 0.707* | 1 | |||
| TOC | 0.480 | 0.112 | 0.174 | -0.430 | 0.631* | 0.198 | 1 | ||
| TN | -0.237 | 0.632* | -0.250 | 0.246 | -0.010 | -0.399 | 0.519 | 1 | |
| TP | 0.826** | -0.444 | 0.613* | -0.615 | 0.748* | 0.839** | 0.435 | -0.356 | 1 |
表13 表层沉积物重金属与营养盐相关性分析
Table 13 Correlation between nutrients and heavy metals in surface sediment
| 重金属 Heavy Metal | Cd | Hg | As | Cu | Pb | Zn | TOC | TN | TP |
|---|---|---|---|---|---|---|---|---|---|
| Cd | 1 | ||||||||
| Hg | -0.382 | 1 | |||||||
| As | 0.442 | -0.116 | 1 | ||||||
| Cu | -0.472 | 0.528 | -0.241 | 1 | |||||
| Pb | 0.746** | -0.359 | 0.384 | -0.435 | 1 | ||||
| Zn | 0.611* | -0.680 | 0.518 | -0.415 | 0.707* | 1 | |||
| TOC | 0.480 | 0.112 | 0.174 | -0.430 | 0.631* | 0.198 | 1 | ||
| TN | -0.237 | 0.632* | -0.250 | 0.246 | -0.010 | -0.399 | 0.519 | 1 | |
| TP | 0.826** | -0.444 | 0.613* | -0.615 | 0.748* | 0.839** | 0.435 | -0.356 | 1 |
| [1] |
ANDREWS J E, GREENAWAY A M, DENNIS P F, 1998. Combined carbon isotope and C/N ratios as indicators of source and fate of organic matter in a poorly flushed, tropical estuary: Hunts Bay, Kingston Harbour, Jamaica[J]. Estuarine Coastal and Shelf Science, 46(5): 743-756.
DOI URL |
| [2] |
BAO Y F, WANG Y C, HU M M, et al., 2018. Phosphorus fractions and its summer flux from sediments of deep reservoirs located at a phosphate-rock watershed, Central China[J]. Water Science and Technology-Water Supply, 18(2): 688-697.
DOI URL |
| [3] |
DAN S F, LIU S M, YANG B, et al., 2019. Geochemical discrimination of bulk organic matter in surface sediments of the Cross River estuary system and adjacent shelf, South East Nigeria (West Africa)[J]. Science of the Total Environment, 678: 351-368.
DOI URL |
| [4] |
HAKANSON L, 1980. An ecological risk index for aquatic pollution control: a sedimentological approach[J]. Water Research, 14(8): 975-1001.
DOI URL |
| [5] |
HUANG L, FANG H W, REIBLE D, 2015. Mathematical model for interactions and transport of phosphorus and sediment in the Three Gorges Reservoir[J]. Water Research, 85: 393-403.
DOI URL |
| [6] |
KUMMU M, LU X X, WANG J J, et al., 2010. Basin-wide sediment trapping efficiency of emerging reservoirs along the Mekong[J]. Geomorphology, 119(3-4): 181-197.
DOI URL |
| [7] | MAAVARA T, CHEN Q W, METER K V, et al., 2020. River dam impacts on biogeochemical cycling[J]. Nature Reviews Earth & Environment, 1(2): 103-116. |
| [8] |
MAAVARA T, PARSONS C T, RIDENOUR C, et al., 2015. Global phosphorus retention by river damming[J]. Proceedings of the National Academy of Sciences, 112(51): 15603-15608.
DOI URL |
| [9] |
MEYERS P A, LALLIER-VERGES E, 1999. Lancustrine sedimentary organic matter records of Late Quaternary paleoclimates[J]. Journal of Paleolimnology, 21(3): 345-372.
DOI URL |
| [10] | MUDROCH A, AZCYE D J M, 1995. Manual of Aquatic Sediment Sampling[M]. Boca Raton: Lewis Publications. |
| [11] | MUNIZ P, VENTURININ N, GOMEZ-ERACHER M, 2004. Spatial distribution of chromium and lead in the benthic environment of coastal areas of the Rio de la Plata estuary (Montevideo, Uruguai)[J]. Brazilian Journal of Biology, 64(1): 103-116. |
| [12] |
PEREZ E, SULBARAN M, BALL M M, et al., 2007. Isolation and characterization of mineral phosphate-solubilizing bacteria naturally colonizing a limonitic crust in the south-eastern venezuelan region[J]. Soil Biology & Biochemistry, 39(11): 2905-2914.
DOI URL |
| [13] | WANG K, LIN Z B, ZHANG R D, 2016. Impact of phosphate mining and separation of mined materials on the hydrology and water environment of the Huangbai River basin, China[J]. Science of the Total Environment, 543(Part A): 347-356. |
| [14] |
WU W H, QU S Y, NEL W, et al., 2020. The impact of natural weathering and mining on heavy metal accumulation in the karst areas of the Pearl River Basin, China[J]. Science of the Total Environment, 734: 139480.
DOI URL |
| [15] | 包宇飞, 王雨春, 洪钧, 等, 2018. 玄庙观水库表层沉积物磷形态及正磷酸盐释放风险特征研究[J]. 长江流域资源与环境, 27(4): 840-848. |
| BAO Y F, WANG Y C, HONG J, et al., 2018. Phosphorus fraction and orthophosphate diffusion flux from surface sediments of Xuanmiaoguan Reservoir[J]. Resources and Environment in the Yangtze Basin, 27(4): 840-848. | |
| [16] | 陈姗, 许凡, 谢三桃, 等, 2019. 合肥市十八联圩湿地表层沉积物营养盐与重金属分布及污染评价[J]. 环境科学, 40(11): 4932-4943. |
| CHEN S, XU F, XIE S T, et al., 2019. Distribution and pollution assessment of nutrients and heavy metals in surface sediments from shibalianwei wetland in Hefei, Anhui Province, China[J]. Environmental Science, 40(11): 4932-4943. | |
| [17] | 陈思杨, 宋琍琍, 刘希真, 等, 2020. 浙江典型海湾潮间带沉积物污染及生态风险评价[J]. 中国环境科学, 40(4): 1771-1781. |
| CHEN S Y, SONG L L, LIU X Z, et al., 2020. Evaluation on sediment pollution and potential ecological risks in the intertidal zone of typical bays in Zhejiang Province[J]. China Environmental Science, 40(4): 1771-1781. | |
| [18] | 方志青, 王永敏, 王训, 等, 2020. 三峡库区支流汝溪河沉积物重金属空间分布及生态风险[J]. 环境科学, 41(3): 1338-1345. |
| FANG Z Q, WANG Y M, WANG X, et al., 2020. Spatial distribution and risk assessment of heavy metals in sediments of Ruxi Tributary of the Three Gorges Reservoir[J]. Environmental Science, 41(3): 1338-1345. | |
| [19] | 甘华阳, 张顺之, 梁开, 等, 2012. 北部湾北部滨海湿地水体和表层沉积物中营养元素分布与污染评价[J]. 湿地科学, 10(3): 285-298. |
| GANG H Y, ZHANG S Z, LIANG K, et al., 2012. Nutrients Distribution and contamination assessment in seawater and surface sediment of the coastal wetlands, Northern Beibu Gulf[J]. Wetland Science, 10(3): 285-298. | |
| [20] | 黄慧琴, 侯进菊, 翁辰, 等, 2016. 崇明岛典型河道水体中叶绿素a动态特征及其与环境因子的相关分析[J]. 生态环境学报, 25(8): 1369-1375. |
| HUANG H Q, HOU J J, WENG C, et al., 2016. Dynamics of chlorophyll-a and its potential relationship with environmental factors in typical river of Chongming island[J]. Ecology and Environmental Sciences, 25(8): 1369-1375. | |
| [21] | 贾茜茜, 姜宇强, 袁刚, 等, 2016. 浙江大洋水库沉积物重金属、营养盐生态风险评价[J]. 大连海洋大学学报, 31(4): 410-415. |
| JIA X X, JIANG Y Q, YUAN G, et al., 2016. Ecological risk assessment of heavy metals and nutrients in surface sediment of dayang Reservoir, Zhejiang Province[J]. Journal of Dalian Ocean University, 31(4): 410-415. | |
| [22] | 江文渊, 曾珍香, 2019. 于桥水库表层沉积物重金属分布特征及其与底栖动物的关系[J]. 水生态学杂志, 40(5): 32-39. |
| JIANG W Y, ZENG Z X, 2019. Distribution of heavy metals in surface sediment of Yuqiao Reservoir and its relationship with macroinvertebrate community[J]. Journal of Hydroecology, 40(5): 32-39. | |
| [23] | 李冰, 王亚, 郑钊, 等, 2018. 丹江口水库调水前后表层沉积物营养盐和重金属时空变化[J]. 环境科学, 39(8): 3591-3600. |
| LI B, WANG Y, ZHEN Z, et al., 2018. Temporal and spatial changes in sediment nutrients and heavy metals of the Danjiangkou Reservoir before and after water division of the mid-route project[J]. Environmental Science, 39(8): 3591-3600. | |
| [24] | 李大华, 唐跃刚, 陈坤, 等, 2006. 中国西南地区煤中12种有害微量元素的分布[J]. 中国矿业大学学报, 35(1): 15-20. |
| LI A H, TANG Y G, CHEN K, et al., 2006. Distribution and twelve toxic trace elements in coals from Southwest China[J]. Journal of China University of Mining & Technology, 35(1): 15-20. | |
| [25] | 李晋鹏, 成登苗, 赵爱东, 等, 2019. 澜沧江梯级水坝库区沉积物重金属和营养盐污染特征及评价[J]. 环境科学学报, 39(8): 2791-2799. |
| LI J P, CHENG D M, ZHAO A D, et al., 2019. The characteristics and assessment of heavy metal and nutrient pollution in sediments of cascading hydropower dams in Langcang River[J]. Acta Scientiae Circumstantiae, 39(8): 2791-2799. | |
| [26] | 刘丽娜, 马春子, 张靖天, 等, 2018. 东北典型湖泊沉积物氮磷和重金属分布特征及其污染评价研究[J]. 农业环境科学学报, 37(3): 520-529. |
| LIU L N, MA C Z, ZHANG J T, et al., 2018. Distribution characteristics of pollution from nitrogen, phosphorus, and heavy metals in sediments of Shankou Lake in Northeast China[J]. Journal of Argo-Environment Science, 37(3): 520-529. | |
| [27] | 刘佳, 雷丹, 李琼, 等, 2018. 黄柏河流域梯级水库沉积物磷形态特征及磷释放通量分析[J]. 环境科学, 39(4): 1608-1615. |
| LIU J, LEI D, LI Q et al.,2018. Characteristics of phosphorus fractions and phosphate diffusion fluxes of sediments in cascade reservoirs of the Huangbai River[J]. Environmental Science, 39(4): 1608-1615. | |
| [28] | 唐黎, 李秋华, 陈椽, 等, 2017. 贵州普定水库沉积物重金属分布及污染特征[J]. 中国环境科学, 37(12): 4710-4721. |
| TANG L, LI J H, CHEN C, et al., 2017. Distribution and pollution characteristics of heavy metals in sediments of Puding Reservoir, Guizhou Province[J]. China Environmental Science, 37(12): 4710-4721. | |
| [29] | 王海军, 张长锁, 赵旭林, 等, 2020. 磷矿山开采对黄柏河东支的影响研究[J]. 矿冶, 29(2): 105-109. |
| WANG H J, ZHANG C S, ZHAO X L, et al., 2020. Influence of phosphate mine mining on east branch of Huangbai river[J]. Mining & Metallurgy, 29(2): 105-109. | |
| [30] | 王辉, 焦振恒, 刘春跃, 等, 2019. 辽河辽宁段干流表层沉积物中磷的含量及赋存形态研究[J]. 生态环境学报, 28(2): 2409-2415. |
| WANG H, JIAO Z H, LIU C Y, et al., 2019. The distribution and speciation of phosphorus in the surface sediments of Liaohe River mainstream in Liaoning province[J]. Ecology and Environmental Sciences, 28(2): 2409-2415. | |
| [31] | 王蒙蒙, 宋刚福, 翟付杰, 等, 2020. 陆浑水库沉积物重金属空间分布特征及风险评价[J]. 环境科学学报, 40(4): 1331-1339. |
| WANG M M, SONG G F, ZHAI F J, et al., 2020. Spatial distribution characteristics and risk assessment of heavy metals in sediments of Luhun Reservoir[J]. Acta Scientiae Circumstantiae, 40(4): 1331-1339. | |
| [32] | 王亚平, 黄廷林, 周子振, 等, 2017. 金盆水库表层沉积物中营养盐分布特征与污染评价[J]. 环境化学, 36(3): 659-665. |
| WANG Y P, HUANG Y L, ZHOU Z Z, et al., 2017. Distribution and pollution evaluation of nutrients in surface sediments of Jinpen Reservoir[J]. Environmental Chemistry, 36(3): 659-665. | |
| [33] | 夏锦霞, 李方林, 杨东, 2009. 长江宜昌段水系沉积物镉高值带成因[J]. 吉林大学学报(地球科学版), 39(2): 305-311. |
| XIA J X, LI F L, YANG D, 2009. Preliminary study on the sources of high cadmium value belt of stream sediments in Yichang section of the Yangtze River[J]. Journal of Jilin University (Earth Science Edition), 39(2): 305-311. | |
| [34] | 杨洋, 刘其根, 胡忠军, 等, 2014. 太湖流域沉积物碳氮磷分布及污染评价[J]. 环境科学学报, 34(12): 3057-3064. |
| YANG Y, LIU Q G, HU Z J, et al., 2014. Spatial distribution of sediment carbon, nitrogen and phosphorus and pollution evaluation sediment in Taihu Lake Basin[J]. Acta Scientiae Circumstantiae, 34(12): 3057-3064. | |
| [35] | 张华俊, 陈修康, 韩博平, 等, 2012. 鹤地水库沉积物营养盐及重金属分布和污染特征分析[J]. 环境科学, 33(4): 1167-1175. |
| ZHANG H J, CHEN X K, HAN B P, et al., 2012. Distribution and pollution characteristics of nutrients and heavy metals in sediments of Hedi Reservoir[J]. Environmental Science, 33(4): 1167-1175. | |
| [36] | 张起源, 秦颖君, 刘香华, 等, 2020. 广东红树林沉积物有毒金属分布及生态风险评价[J]. 生态环境学报, 29(1): 183-191. |
| ZHANG Q Y, QIN Y J, LIU X H, et al., 2020. Distribution characteristics and ecological risk assessment of toxic metals in mangrove sediments in Guangdong[J]. Ecology and Environmental Sciences, 29(1): 183-191. | |
| [37] | 郑飞燕, 谭路, 陈星, 等, 2018. 三峡水库香溪河库湾氮磷分布状况及沉积物污染评价[J]. 生态毒理学报, 13(4): 49-59. |
| ZHENG F Y, TAN L, CHEN X, et al., 2018. Spatial distribution of nitrogen and phosphorus, and pollution evaluation for sediment in Xiangxi Bay, Three Gorges Reservoir[J]. Asian Journal of Ecotoxicology, 13(4): 49-59. | |
| [38] | 郑睿, 谌书, 王彬, 等, 2020. 三峡库区香溪河沉积物重金属含量分布及风险评价[J]. 生态环境学报, 29(1): 192-198. |
| ZHEN R, CHEN S, WANG B, et al., 2020. Distribution and risk assessment of heavy metal content in the sediments of Xiangxi River in the Three Gorges Reservoir[J]. Ecology and Environmental Sciences, 29(1): 192-198. | |
| [39] | 中国环境监测总站,1990. 中国土壤元素背景值[M]. 北京: 中国环境科学出版社. |
| China National Environmental Monitoring Station,1990. Background value of soil elements in China[M]. Beijing: China Environmental Science Press. | |
| [40] | 朱翔, 张敏, 渠晓东, 等, 2018. 潘大水库表层沉积物营养盐污染状况及赋存状态[J]. 应用生态学报, 29(11): 3847-3856. |
| ZHU X, ZHANG M, QU X D, et al., 2018. Contamination status and speciation for the sediment nutrients in Panjiakou-Daheting Reservoir[J]. Chinese Journal of Applied Ecology, 29(11): 3847-3856. |
| [1] | 杜丹丹, 高瑞忠, 房丽晶, 谢龙梅. 旱区盐湖盆地土壤重金属空间变异及对土壤理化因子的响应[J]. 生态环境学报, 2023, 32(6): 1123-1132. |
| [2] | 冯树娜, 吕家珑, 何海龙. KI淋洗对黄绵土汞污染的去除效果及土壤理化性状的影响[J]. 生态环境学报, 2023, 32(4): 776-783. |
| [3] | 陈敏毅, 朱航海, 佘伟铎, 尹光彩, 黄祖照, 杨巧玲. 珠三角某遗留造船厂场地土壤重金属人体健康风险评估及源解析[J]. 生态环境学报, 2023, 32(4): 794-804. |
| [4] | 钱海铭, 张运林, 李娜, 王玮佳, 孙晓, 张毅博, 施坤, 冯胜, 高阳辉. 典型降雨过程中河流饮用水源地水质高频监测研究[J]. 生态环境学报, 2023, 32(3): 579-589. |
| [5] | 肖洁芸, 周伟, 石佩琪. 土壤重金属含量高光谱反演[J]. 生态环境学报, 2023, 32(1): 175-182. |
| [6] | 黄宏, 郑欣芸, 李迎东, 赵旭, 俞锦辰, 汪振华. 大陈岛海域不同年龄褐菖鲉对重金属富集作用研究[J]. 生态环境学报, 2022, 31(9): 1885-1891. |
| [7] | 马闯, 王雨阳, 周通, 吴龙华. 污染土壤颗粒态有机质镉锌富集特征及其解吸行为研究[J]. 生态环境学报, 2022, 31(9): 1892-1900. |
| [8] | 陶玲, 黄磊, 周怡蕾, 李中兴, 任珺. 污泥-凹凸棒石共热解生物炭对矿区土壤重金属生物有效性和环境风险的影响[J]. 生态环境学报, 2022, 31(8): 1637-1646. |
| [9] | 李莹, 张洲, 杨高明, 祖艳群, 李博, 陈建军. 湿地植物根系泌氧能力和根表铁膜与根系吸收重金属的关系[J]. 生态环境学报, 2022, 31(8): 1657-1666. |
| [10] | 罗松英, 李秋霞, 邱锦坤, 邓素炎, 李一锋, 陈碧珊. 南三岛土壤-红树植物系统中重金属形态特征及迁移转化规律[J]. 生态环境学报, 2022, 31(7): 1409-1416. |
| [11] | 董乐恒, 王旭刚, 陈曼佳, 王子豪, 孙丽蓉, 石兆勇, 吴琪琪. 光照和避光条件下石灰性水稻土Fe氧化还原与Cu活性关系研究[J]. 生态环境学报, 2022, 31(7): 1448-1455. |
| [12] | 彭红丽, 谭海霞, 王颖, 魏建梅, 冯阳. 不同种植模式下土壤重金属形态分布差异与生态风险评价[J]. 生态环境学报, 2022, 31(6): 1235-1243. |
| [13] | 黄敏, 赵晓峰, 梁荣祥, 王鹏忠, 戴安然, 何晓曼. 3种螯合剂对Cd、Cu复合污染土壤淋洗修复的对比研究[J]. 生态环境学报, 2022, 31(6): 1244-1252. |
| [14] | 朱立安, 张会化, 程炯, 李婷, 林梓, 李俊杰. 珠江三角洲林业用地土壤重金属潜在生态风险格局分析[J]. 生态环境学报, 2022, 31(6): 1253-1262. |
| [15] | 施建飞, 靳正忠, 周智彬, 王鑫. 额尔齐斯河流域典型尾矿库区周边土壤重金属污染评价[J]. 生态环境学报, 2022, 31(5): 1015-1023. |
| 阅读次数 | ||||||
|
全文 |
|
|||||
|
摘要 |
|
|||||