
Ecology and Environmental Sciences ›› 2026, Vol. 35 ›› Issue (10): 1649-1660.DOI: 10.16258/j.cnki.1674-5906.2026.10.014
• Research Article [Environmental Science] • Previous Articles
Li Ji( ), Yang Ronghui*()
Received:2026-03-30
Revised:2026-08-21
Accepted:2026-09-04
Online:2026-10-18
Published:2026-10-21
李季(), 杨蓉慧*()
通讯作者:
E-mail: 作者简介:李季(1983年生),男,副教授,博士,主要研究方向为企业环境创新与技术管理,土地利用与规划管理等。E-mail: 512625974@qq.com
基金资助:CLC Number:
Li Ji, Yang Ronghui. Digital Economy Driven Ecological Transition in Northeast China’s Counties: Urban-Rural Transmission Mechanism and Spatial Effects[J]. Ecology and Environmental Sciences, 2026, 35(10): 1649-1660.
李季, 杨蓉慧. 数字经济驱动东北县域生态转型与城乡融合的协同演化与空间效应[J]. 生态环境学报, 2026, 35(10): 1649-1660.
Add to citation manager EndNote|Ris|BibTeX
URL: https://www.jeesci.com/EN/10.16258/j.cnki.1674-5906.2026.10.014
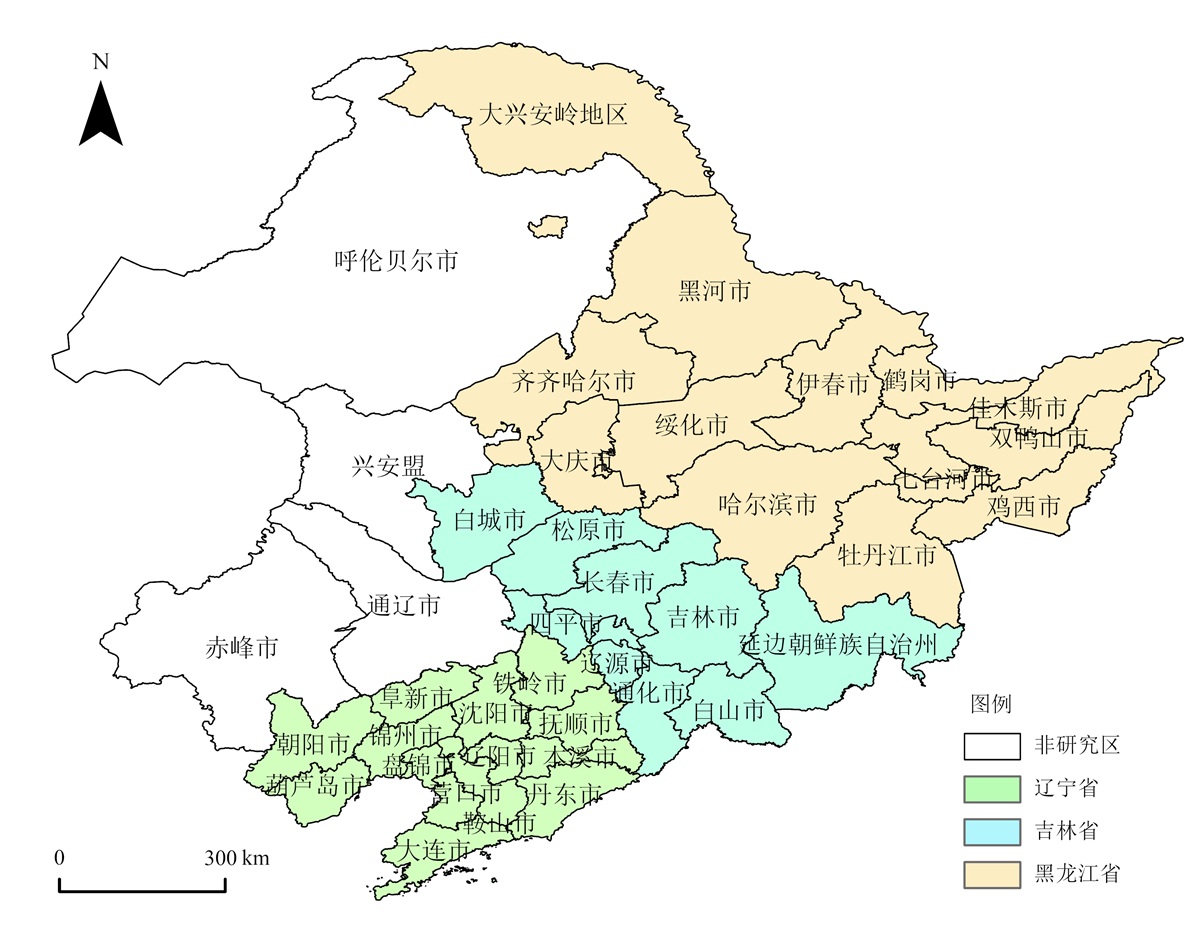
Figure 1 Overview of the study area
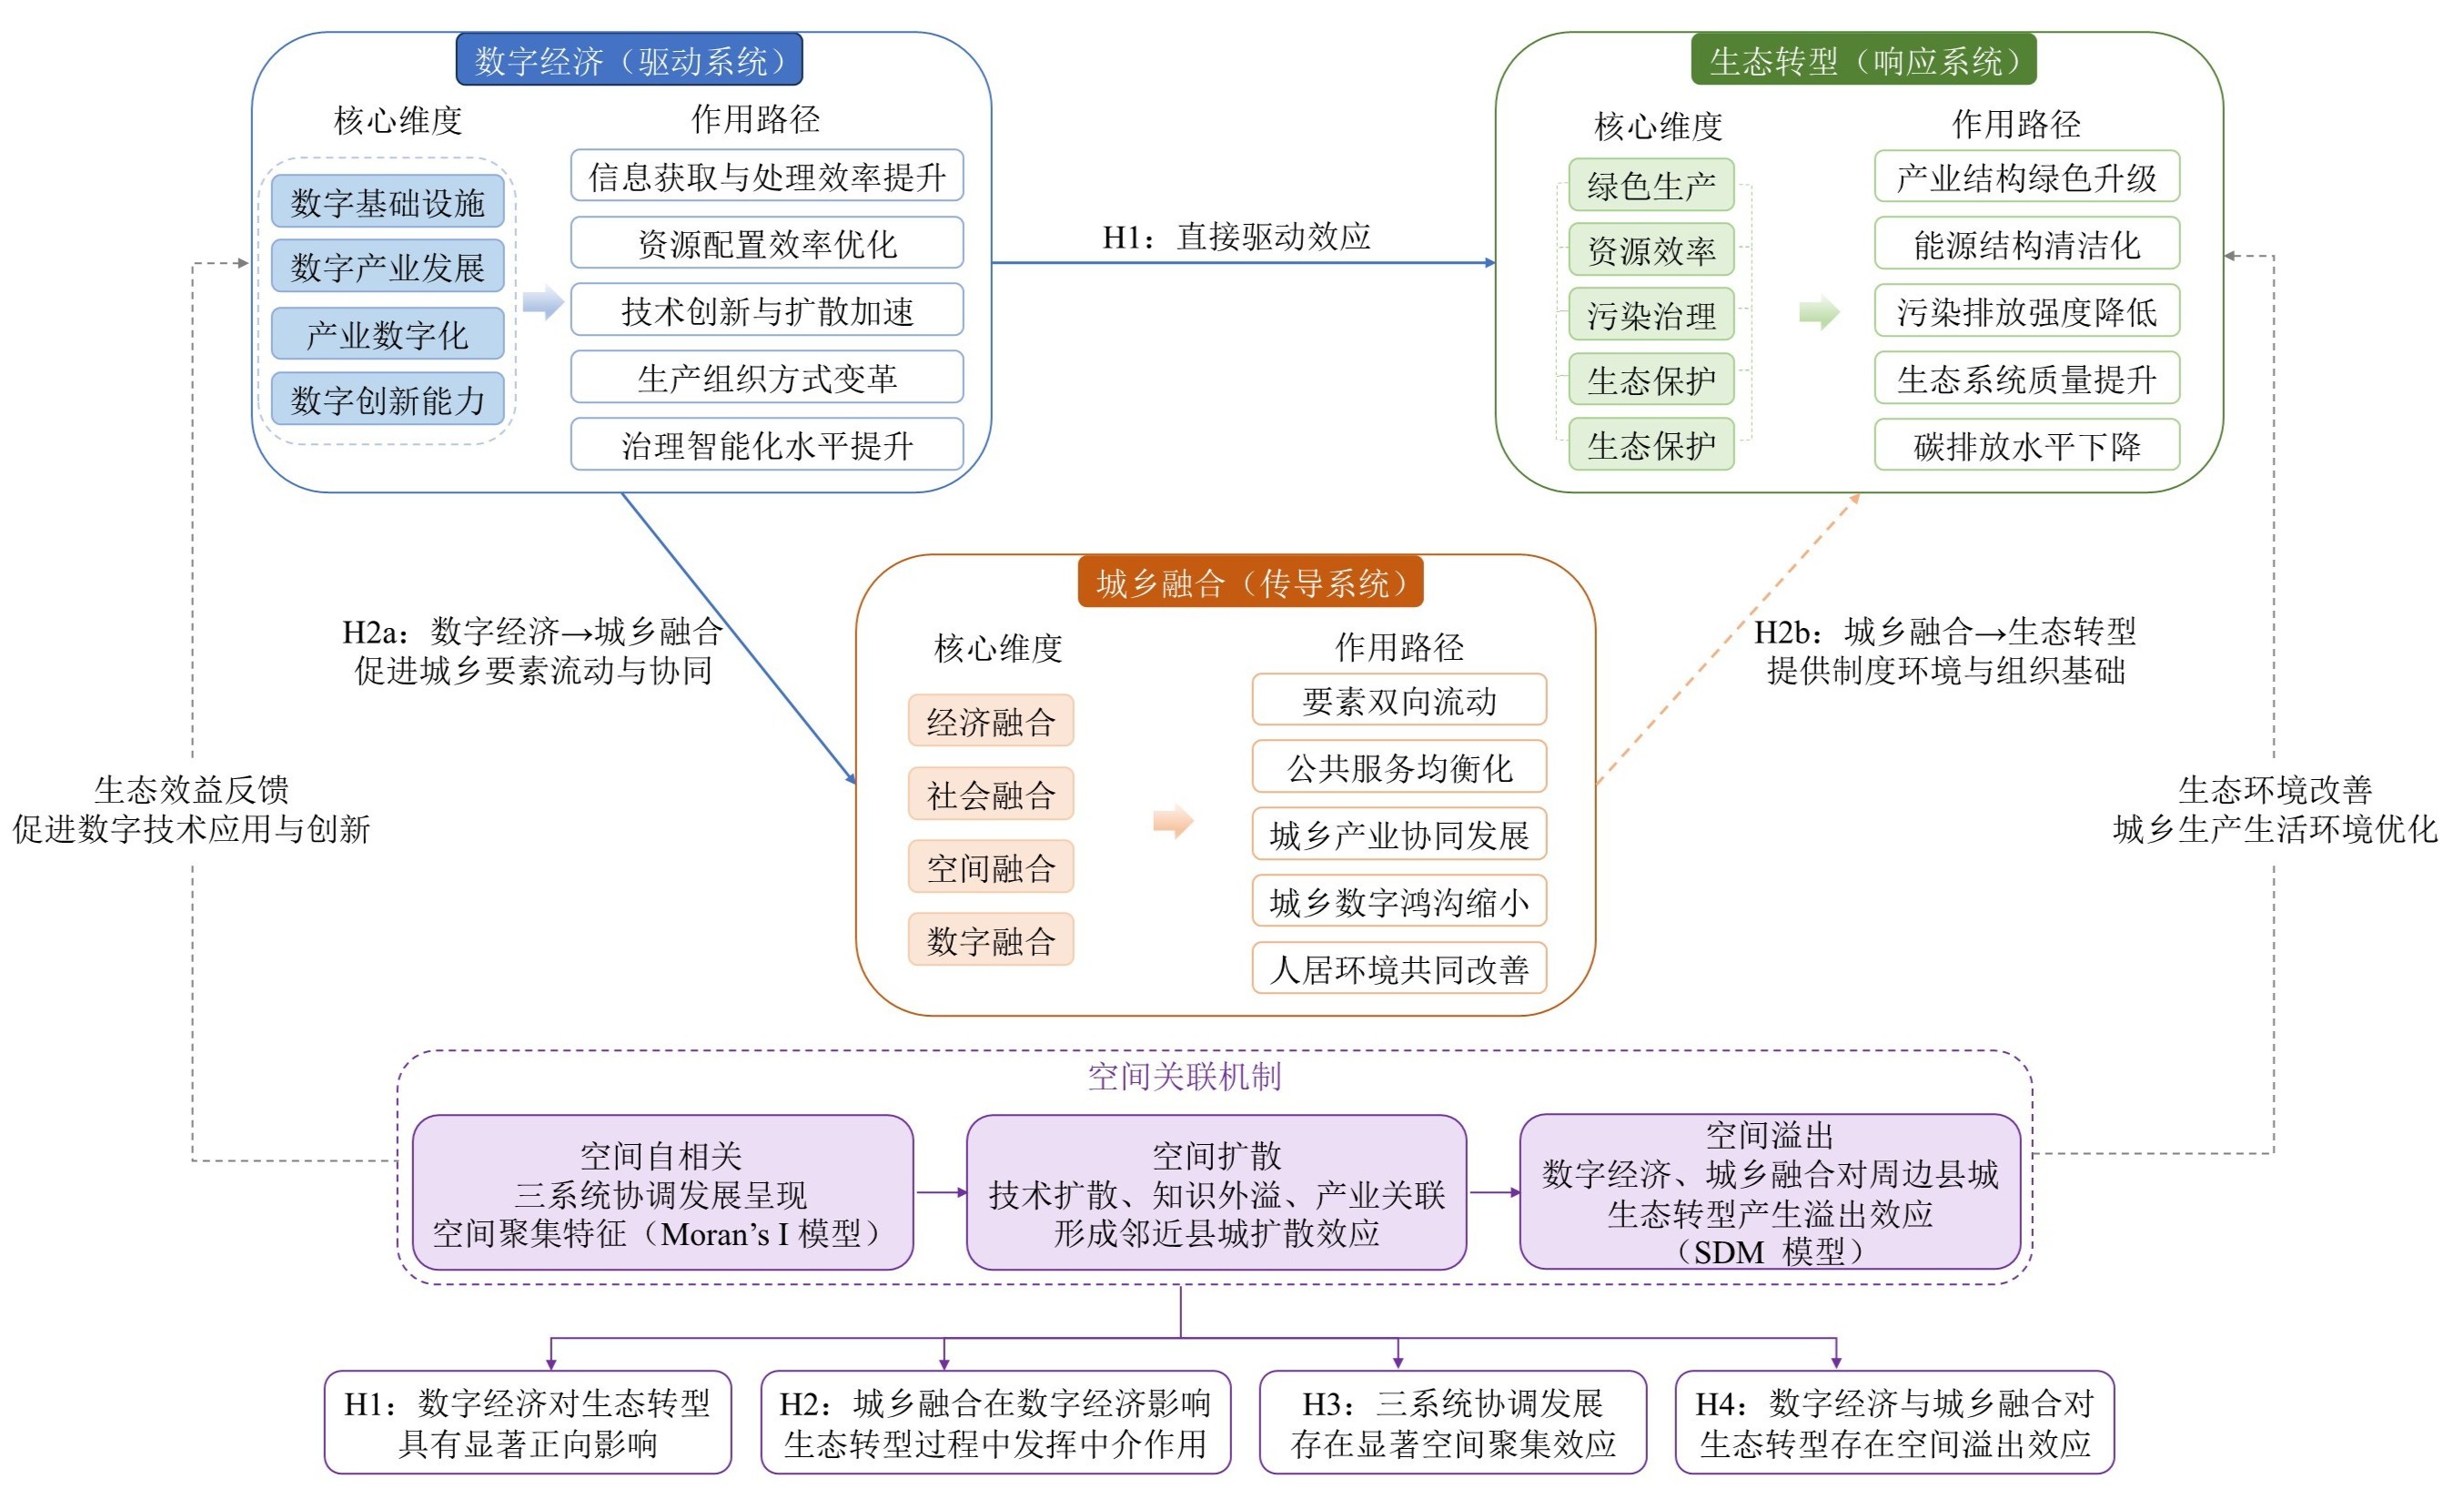
Figure 2 Framework for synergistic analysis of three systems
| 维度层 | 指标层 | 属性 | 数据来源 |
|---|---|---|---|
| 数字基础设施 | 互联网用户密度 (每百人互联网用户数) | + | 《中国县域统计年鉴》 |
| 移动电话普及率 (每百人移动电话用户数) | + | 《中国县域统计年鉴》 | |
| 固定宽带接入水平 (每百户固定宽带接入户数) | + | 《中国县域统计年鉴》 | |
| 人均通信业务量 (人均邮电业务总量) | + | 各省统计年鉴 | |
| 数字产业发展 | 信息服务业就业比重 | + | 县级统计公报 |
| 软件与信息产业规模 | + | 工信部门统计资料 | |
| 电子商务活跃度 (人均网络零售额) | + | 电子商务公共服务平台 | |
| 数字经济产业占比 | + | 县级统计公报 | |
| 数字创新能力 | R&D投入强度 (R&D经费支出占GDP比重) | + | 《中国科技统计年鉴》 |
| 万人专利授权量 | + | 国家知识产权局数据库 | |
| 数字技术创新指数 | + | 国家知识产权局数据库 | |
| 科技人才密度 (每万人科技活动人员数) | + | 《中国科技统计年鉴》 | |
| 数字应用水平 | 数字普惠金融指数 | + | 北京大学数字普惠 金融指数 |
| 线上消费活跃度 (人均线上消费额) | + | 第三方支付平台数据 | |
| 数字公共服务水平 (政务服务线上办理率) | + | 政府公开资料 | |
| 智慧治理能力指数 (环境监测数字化覆盖率) | + | 各省生态环境厅公报 |
Table 1 Indicator system for digital economic development
| 维度层 | 指标层 | 属性 | 数据来源 |
|---|---|---|---|
| 数字基础设施 | 互联网用户密度 (每百人互联网用户数) | + | 《中国县域统计年鉴》 |
| 移动电话普及率 (每百人移动电话用户数) | + | 《中国县域统计年鉴》 | |
| 固定宽带接入水平 (每百户固定宽带接入户数) | + | 《中国县域统计年鉴》 | |
| 人均通信业务量 (人均邮电业务总量) | + | 各省统计年鉴 | |
| 数字产业发展 | 信息服务业就业比重 | + | 县级统计公报 |
| 软件与信息产业规模 | + | 工信部门统计资料 | |
| 电子商务活跃度 (人均网络零售额) | + | 电子商务公共服务平台 | |
| 数字经济产业占比 | + | 县级统计公报 | |
| 数字创新能力 | R&D投入强度 (R&D经费支出占GDP比重) | + | 《中国科技统计年鉴》 |
| 万人专利授权量 | + | 国家知识产权局数据库 | |
| 数字技术创新指数 | + | 国家知识产权局数据库 | |
| 科技人才密度 (每万人科技活动人员数) | + | 《中国科技统计年鉴》 | |
| 数字应用水平 | 数字普惠金融指数 | + | 北京大学数字普惠 金融指数 |
| 线上消费活跃度 (人均线上消费额) | + | 第三方支付平台数据 | |
| 数字公共服务水平 (政务服务线上办理率) | + | 政府公开资料 | |
| 智慧治理能力指数 (环境监测数字化覆盖率) | + | 各省生态环境厅公报 |
| 维度层 | 指标层 | 属性 | 数据来源 |
|---|---|---|---|
| 绿色 生产 | 单位GDP能耗 (吨标准煤/万元) | - | 《中国能源统计年鉴》 |
| 绿色产业比重 | + | 县级统计公报 | |
| 绿色专利授权量 | + | 国家知识产权局数据库 | |
| 清洁生产水平 | + | 各省生态环境厅公报 | |
| 资源 效率 | 能源利用效率 (单位能耗GDP产出) | + | 《中国能源统计年鉴》 |
| 土地利用效率 (单位建设用地GDP产出) | + | 《中国城乡建设统计年鉴》 | |
| 水资源利用效率 (单位GDP用水量) | + | 《中国水资源统计年鉴》 | |
| 资源产出效率 | + | 《中国环境统计年鉴》 | |
| 环境 治理 | 污染治理投资强度 | + | 《中国环境统计年鉴》 |
| 污水处理率 | + | 《中国环境统计年鉴》 | |
| 工业固废综合利用率 | + | 《中国环境统计年鉴》 | |
| 污染物减排能力 | + | 《中国环境统计年鉴》 | |
| 生态 质量 | 森林覆盖率 | + | 《中国林业统计年鉴》 |
| 建成区绿化覆盖率 | + | 《中国城乡建设统计年鉴》 | |
| 空气环境质量(优良天数比例) | + | 中国环境监测总站 | |
| 生态环境恢复水平 | + | MODIS遥感数据 |
Table 2 Ecological transition indicator system
| 维度层 | 指标层 | 属性 | 数据来源 |
|---|---|---|---|
| 绿色 生产 | 单位GDP能耗 (吨标准煤/万元) | - | 《中国能源统计年鉴》 |
| 绿色产业比重 | + | 县级统计公报 | |
| 绿色专利授权量 | + | 国家知识产权局数据库 | |
| 清洁生产水平 | + | 各省生态环境厅公报 | |
| 资源 效率 | 能源利用效率 (单位能耗GDP产出) | + | 《中国能源统计年鉴》 |
| 土地利用效率 (单位建设用地GDP产出) | + | 《中国城乡建设统计年鉴》 | |
| 水资源利用效率 (单位GDP用水量) | + | 《中国水资源统计年鉴》 | |
| 资源产出效率 | + | 《中国环境统计年鉴》 | |
| 环境 治理 | 污染治理投资强度 | + | 《中国环境统计年鉴》 |
| 污水处理率 | + | 《中国环境统计年鉴》 | |
| 工业固废综合利用率 | + | 《中国环境统计年鉴》 | |
| 污染物减排能力 | + | 《中国环境统计年鉴》 | |
| 生态 质量 | 森林覆盖率 | + | 《中国林业统计年鉴》 |
| 建成区绿化覆盖率 | + | 《中国城乡建设统计年鉴》 | |
| 空气环境质量(优良天数比例) | + | 中国环境监测总站 | |
| 生态环境恢复水平 | + | MODIS遥感数据 |
| 维度层 | 指标层 | 属性 | 数据来源 |
|---|---|---|---|
| 经济 融合 | 城乡收入比(农村/城镇) | + | 《中国县域统计年鉴》 |
| 非农就业比重 | + | 《中国县域统计年鉴》 | |
| 城乡产业协调度 | + | 《中国县域统计年鉴》 | |
| 农村居民消费水平 | + | 《中国县域统计年鉴》 | |
| 社会 融合 | 教育资源均衡水平 (城乡生均教育经费比) | + | 各省教育厅统计资料 |
| 医疗资源可及性 (城乡每千人床位数比) | + | 各省卫生健康委 统计资料 | |
| 社会保障覆盖率 | + | 各省民政厅统计资料 | |
| 公共服务均等化水平 | + | 县级统计公报 | |
| 空间 融合 | 道路密度 (公路里程/县域面积) | + | 《中国城乡建设 统计年鉴》 |
| 交通可达性 (到最近地级市的时间距离) | − | 高德地图API | |
| 城乡建设协调度 | + | 《中国城乡建设 统计年鉴》 | |
| 基础设施覆盖率 (农村自来水普及率) | + | 《中国城乡建设 统计年鉴》 | |
| 数字 融合 | 数字基础设施下沉水平 (农村/城镇互联网普及率) | + | 中国互联网络 信息中心 |
| 数字金融普及率 (农村/城镇数字普惠金融指数) | + | 北京大学数字 普惠金融指数 | |
| 数字公共服务共享度 | + | 政府公开资料 | |
| 城乡数字应用协调度 | + | 第三方支付平台数据 |
Table 3 Urban-rural integration indicator system
| 维度层 | 指标层 | 属性 | 数据来源 |
|---|---|---|---|
| 经济 融合 | 城乡收入比(农村/城镇) | + | 《中国县域统计年鉴》 |
| 非农就业比重 | + | 《中国县域统计年鉴》 | |
| 城乡产业协调度 | + | 《中国县域统计年鉴》 | |
| 农村居民消费水平 | + | 《中国县域统计年鉴》 | |
| 社会 融合 | 教育资源均衡水平 (城乡生均教育经费比) | + | 各省教育厅统计资料 |
| 医疗资源可及性 (城乡每千人床位数比) | + | 各省卫生健康委 统计资料 | |
| 社会保障覆盖率 | + | 各省民政厅统计资料 | |
| 公共服务均等化水平 | + | 县级统计公报 | |
| 空间 融合 | 道路密度 (公路里程/县域面积) | + | 《中国城乡建设 统计年鉴》 |
| 交通可达性 (到最近地级市的时间距离) | − | 高德地图API | |
| 城乡建设协调度 | + | 《中国城乡建设 统计年鉴》 | |
| 基础设施覆盖率 (农村自来水普及率) | + | 《中国城乡建设 统计年鉴》 | |
| 数字 融合 | 数字基础设施下沉水平 (农村/城镇互联网普及率) | + | 中国互联网络 信息中心 |
| 数字金融普及率 (农村/城镇数字普惠金融指数) | + | 北京大学数字 普惠金融指数 | |
| 数字公共服务共享度 | + | 政府公开资料 | |
| 城乡数字应用协调度 | + | 第三方支付平台数据 |
| 指标 | 年份 | 累计增幅/ % | |||
|---|---|---|---|---|---|
| 2010 | 2015 | 2020 | 2024 | ||
| 数字经济(DE)均值 | 0.213 | 0.336 | 0.482 | 0.601 | 182 |
| 生态转型(ET)均值 | 0.284 | 0.347 | 0.461 | 0.558 | 96.5 |
| 城乡融合(UR)均值 | 0.247 | 0.319 | 0.446 | 0.547 | 122 |
| 数字经济CV | 0.408 | 0.342 | 0.284 | 0.256 | −37.3 |
| 生态转型CV | 0.324 | 0.300 | 0.273 | 0.249 | −23.2 |
| 城乡融合CV | 0.328 | 0.307 | 0.267 | 0.241 | −26.5 |
| 高水平县域占比/% | 6.5 | 9.1 | 15.4 | 21.5 | +15.0 |
| 低水平县域占比/% | 39.6 | 31.7 | 21.3 | 12.8 | −26.8 |
Table 4 Development levels and structural characteristics of the three systems in counties across the Three Northeastern Provinces
| 指标 | 年份 | 累计增幅/ % | |||
|---|---|---|---|---|---|
| 2010 | 2015 | 2020 | 2024 | ||
| 数字经济(DE)均值 | 0.213 | 0.336 | 0.482 | 0.601 | 182 |
| 生态转型(ET)均值 | 0.284 | 0.347 | 0.461 | 0.558 | 96.5 |
| 城乡融合(UR)均值 | 0.247 | 0.319 | 0.446 | 0.547 | 122 |
| 数字经济CV | 0.408 | 0.342 | 0.284 | 0.256 | −37.3 |
| 生态转型CV | 0.324 | 0.300 | 0.273 | 0.249 | −23.2 |
| 城乡融合CV | 0.328 | 0.307 | 0.267 | 0.241 | −26.5 |
| 高水平县域占比/% | 6.5 | 9.1 | 15.4 | 21.5 | +15.0 |
| 低水平县域占比/% | 39.6 | 31.7 | 21.3 | 12.8 | −26.8 |
| 系统 | 一级维度 | 贡献率/% |
|---|---|---|
| 数字经济 | 数字基础设施 | 32.8 |
| 产业数字化 | 29.4 | |
| 数字产业发展 | 21.7 | |
| 创新支撑 | 16.1 | |
| 生态转型 | 环境治理 | 31.5 |
| 绿色生产 | 27.3 | |
| 生态质量 | 22.4 | |
| 资源效率 | 18.8 | |
| 城乡融合 | 经济融合 | 30.6 |
| 空间融合 | 26.8 | |
| 社会融合 | 23.5 | |
| 数字融合 | 19.1 |
Table 5 Contribution rates of the three systems
| 系统 | 一级维度 | 贡献率/% |
|---|---|---|
| 数字经济 | 数字基础设施 | 32.8 |
| 产业数字化 | 29.4 | |
| 数字产业发展 | 21.7 | |
| 创新支撑 | 16.1 | |
| 生态转型 | 环境治理 | 31.5 |
| 绿色生产 | 27.3 | |
| 生态质量 | 22.4 | |
| 资源效率 | 18.8 | |
| 城乡融合 | 经济融合 | 30.6 |
| 空间融合 | 26.8 | |
| 社会融合 | 23.5 | |
| 数字融合 | 19.1 |
| 指标 | 年份 | 变化幅度/ % | |||
|---|---|---|---|---|---|
| 2010 | 2015 | 2020 | 2024 | ||
| 耦合度C | 0.482 | 0.571 | 0.683 | 0.782 | 62.2 |
| 综合协调指数T | 0.248 | 0.334 | 0.463 | 0.569 | 129 |
| 协调度D | 0.346 | 0.437 | 0.562 | 0.667 | 92.8 |
| 总体基尼G | 0.318 | 0.294 | 0.261 | 0.236 | −25.8 |
| 区域内差异贡献率/% | 43.1 | 41.5 | 41.0 | 39.4 | −3.67 |
| 区域间差异贡献率/% | 39.6 | 40.1 | 38.7 | 37.7 | −1.91 |
| 超变密度贡献率/% | 17.3 | 18.4 | 20.3 | 22.9 | +5.58 |
Table 6 Results of the evolution of coupling coordination among the three systems
| 指标 | 年份 | 变化幅度/ % | |||
|---|---|---|---|---|---|
| 2010 | 2015 | 2020 | 2024 | ||
| 耦合度C | 0.482 | 0.571 | 0.683 | 0.782 | 62.2 |
| 综合协调指数T | 0.248 | 0.334 | 0.463 | 0.569 | 129 |
| 协调度D | 0.346 | 0.437 | 0.562 | 0.667 | 92.8 |
| 总体基尼G | 0.318 | 0.294 | 0.261 | 0.236 | −25.8 |
| 区域内差异贡献率/% | 43.1 | 41.5 | 41.0 | 39.4 | −3.67 |
| 区域间差异贡献率/% | 39.6 | 40.1 | 38.7 | 37.7 | −1.91 |
| 超变密度贡献率/% | 17.3 | 18.4 | 20.3 | 22.9 | +5.58 |
| 指标 | 年份 | |||
|---|---|---|---|---|
| 2010 | 2015 | 2020 | 2024 | |
| Moran’s I | 0.184*** | 0.227*** | 0.291*** | 0.336*** |
| Z值 | 3.96 | 4.73 | 5.85 | 6.53 |
| HH集聚占比/% | 18.6 | 23.9 | 31.4 | 38.7 |
| LL集聚占比/% | 29.7 | 27.5 | 24.2 | 20.1 |
Table 7 Results of spatial correlation
| 指标 | 年份 | |||
|---|---|---|---|---|
| 2010 | 2015 | 2020 | 2024 | |
| Moran’s I | 0.184*** | 0.227*** | 0.291*** | 0.336*** |
| Z值 | 3.96 | 4.73 | 5.85 | 6.53 |
| HH集聚占比/% | 18.6 | 23.9 | 31.4 | 38.7 |
| LL集聚占比/% | 29.7 | 27.5 | 24.2 | 20.1 |
| 变量 | 模型(1) | 模型(2) | 模型(3) |
|---|---|---|---|
| 数字经济(DE) | 0.284*** (0.052) | 0.263*** (0.048) | 0.241*** (0.046) |
| 城乡融合(UR) | - | 0.196*** (0.042) | 0.171*** (0.039) |
| 经济发展水平 | 0.112** | 0.097** | 0.085* |
| 产业结构升级 | 0.134*** | 0.126*** | 0.118*** |
| 财政支出强度 | 0.083* | 0.071* | 0.066* |
| 对外开放水平 | 0.058 | 0.061 | 0.047 |
| 人口密度 | 0.075* | 0.063 | 0.052 |
| 空间滞后项ρ | 0.318*** | 0.341*** | 0.354*** |
| R2 | 0.621 | 0.647 | 0.671 |
Table 8 Results of Spatial Durbin Model Regression
| 变量 | 模型(1) | 模型(2) | 模型(3) |
|---|---|---|---|
| 数字经济(DE) | 0.284*** (0.052) | 0.263*** (0.048) | 0.241*** (0.046) |
| 城乡融合(UR) | - | 0.196*** (0.042) | 0.171*** (0.039) |
| 经济发展水平 | 0.112** | 0.097** | 0.085* |
| 产业结构升级 | 0.134*** | 0.126*** | 0.118*** |
| 财政支出强度 | 0.083* | 0.071* | 0.066* |
| 对外开放水平 | 0.058 | 0.061 | 0.047 |
| 人口密度 | 0.075* | 0.063 | 0.052 |
| 空间滞后项ρ | 0.318*** | 0.341*** | 0.354*** |
| R2 | 0.621 | 0.647 | 0.671 |
| 变量 | 直接效应 | 间接效应 | 总效应 |
|---|---|---|---|
| 数字经济(DE) | 0.218*** (0.041) | 0.146*** (0.052) | 0.364*** (0.063) |
| 城乡融合(UR) | 0.154*** (0.037) | 0.092** (0.045) | 0.246*** (0.054) |
| 经济发展水平 | 0.081* (0.043) | 0.064* (0.039) | 0.145** (0.051) |
| 产业结构升级 | 0.127*** (0.036) | 0.081** (0.041) | 0.208*** (0.049) |
| 财政支出强度 | 0.066* (0.039) | 0.029 (0.033) | 0.095* (0.046) |
| 人口密度 | 0.052 (0.041) | 0.018 (0.027) | 0.070 (0.045) |
Table 9 Spatial effect decomposition results
| 变量 | 直接效应 | 间接效应 | 总效应 |
|---|---|---|---|
| 数字经济(DE) | 0.218*** (0.041) | 0.146*** (0.052) | 0.364*** (0.063) |
| 城乡融合(UR) | 0.154*** (0.037) | 0.092** (0.045) | 0.246*** (0.054) |
| 经济发展水平 | 0.081* (0.043) | 0.064* (0.039) | 0.145** (0.051) |
| 产业结构升级 | 0.127*** (0.036) | 0.081** (0.041) | 0.208*** (0.049) |
| 财政支出强度 | 0.066* (0.039) | 0.029 (0.033) | 0.095* (0.046) |
| 人口密度 | 0.052 (0.041) | 0.018 (0.027) | 0.070 (0.045) |
| 变量 | 模型(1)ET | 模型(2)UR | 模型(3)ET |
|---|---|---|---|
| 数字经济(DE) | 0.287*** (0.051) | 0.341*** (0.046) | 0.204*** (0.044) |
| 城乡融合(UR) | - | - | 0.243*** (0.039) |
| 经济发展水平 | 0.106** | 0.118** | 0.091** |
| 产业结构升级 | 0.132*** | 0.147*** | 0.119*** |
| 财政支出强度 | 0.074* | 0.083* | 0.066* |
| 人口密度 | 0.062 | 0.078* | 0.057 |
| 时间固定效应 | YES | YES | YES |
| 地区固定效应 | YES | YES | YES |
| R2 | 0.624 | 0.651 | 0.689 |
| F统计量 | 72.3*** | 79.6*** | 91.4*** |
Table10 Mechanism test results
| 变量 | 模型(1)ET | 模型(2)UR | 模型(3)ET |
|---|---|---|---|
| 数字经济(DE) | 0.287*** (0.051) | 0.341*** (0.046) | 0.204*** (0.044) |
| 城乡融合(UR) | - | - | 0.243*** (0.039) |
| 经济发展水平 | 0.106** | 0.118** | 0.091** |
| 产业结构升级 | 0.132*** | 0.147*** | 0.119*** |
| 财政支出强度 | 0.074* | 0.083* | 0.066* |
| 人口密度 | 0.062 | 0.078* | 0.057 |
| 时间固定效应 | YES | YES | YES |
| 地区固定效应 | YES | YES | YES |
| R2 | 0.624 | 0.651 | 0.689 |
| F统计量 | 72.3*** | 79.6*** | 91.4*** |
| 检验类别 | 分组/方法 | 数字经济(DE) | 城乡融合(UR) | 空间滞后项ρ | R2 |
|---|---|---|---|---|---|
| 资源属性异质性 | 资源型县域 | 0.186*** (0.061) | 0.142** (0.057) | 0.284*** (0.063) | 0.608 |
| 非资源型县域 | 0.294*** (0.052) | 0.251*** (0.049) | 0.361*** (0.058) | 0.684 | |
| 空间区位异质性 | 核心城市圈 | 0.315*** (0.048) | 0.228*** (0.043) | 0.394*** (0.051) | 0.713 |
| 外围县域 | 0.174** (0.073) | 0.131* (0.069) | 0.247*** (0.071) | 0.591 | |
| 数字基础异质性 | 高数字化地区 | 0.347*** (0.044) | 0.271*** (0.041) | 0.382*** (0.049) | 0.732 |
| 低数字化地区 | 0.139* (0.078) | 0.118* (0.065) | 0.216** (0.073) | 0.578 | |
| 稳健性检验 | 基准模型(Queen矩阵) | 0.241*** | 0.171*** | 0.354*** | 0.671 |
| 替换地理距离矩阵 | 0.227*** | 0.163*** | 0.336*** | 0.658 | |
| 替换经济距离矩阵 | 0.213*** | 0.158*** | 0.318*** | 0.644 | |
| 替换数字经济测度方式 | 0.258*** | 0.179*** | 0.361*** | 0.682 | |
| 滞后一期核心解释变量 | 0.201** | 0.164*** | 0.309*** | 0.639 | |
| 1%双侧缩尾处理 | 0.236*** | 0.168*** | 0.347*** | 0.663 | |
| 剔除省会城市样本 | 0.218*** | 0.149** | 0.321*** | 0.651 |
Table 11 Heterogeneity and robustness tests
| 检验类别 | 分组/方法 | 数字经济(DE) | 城乡融合(UR) | 空间滞后项ρ | R2 |
|---|---|---|---|---|---|
| 资源属性异质性 | 资源型县域 | 0.186*** (0.061) | 0.142** (0.057) | 0.284*** (0.063) | 0.608 |
| 非资源型县域 | 0.294*** (0.052) | 0.251*** (0.049) | 0.361*** (0.058) | 0.684 | |
| 空间区位异质性 | 核心城市圈 | 0.315*** (0.048) | 0.228*** (0.043) | 0.394*** (0.051) | 0.713 |
| 外围县域 | 0.174** (0.073) | 0.131* (0.069) | 0.247*** (0.071) | 0.591 | |
| 数字基础异质性 | 高数字化地区 | 0.347*** (0.044) | 0.271*** (0.041) | 0.382*** (0.049) | 0.732 |
| 低数字化地区 | 0.139* (0.078) | 0.118* (0.065) | 0.216** (0.073) | 0.578 | |
| 稳健性检验 | 基准模型(Queen矩阵) | 0.241*** | 0.171*** | 0.354*** | 0.671 |
| 替换地理距离矩阵 | 0.227*** | 0.163*** | 0.336*** | 0.658 | |
| 替换经济距离矩阵 | 0.213*** | 0.158*** | 0.318*** | 0.644 | |
| 替换数字经济测度方式 | 0.258*** | 0.179*** | 0.361*** | 0.682 | |
| 滞后一期核心解释变量 | 0.201** | 0.164*** | 0.309*** | 0.639 | |
| 1%双侧缩尾处理 | 0.236*** | 0.168*** | 0.347*** | 0.663 | |
| 剔除省会城市样本 | 0.218*** | 0.149** | 0.321*** | 0.651 |
| [1] |
Jiao L Q, 2026. The New urbanization of urban agglomerations in the Yellow River Basin is coupled and coordinated with the performance of ecological and environmental welfare[J]. Academic Journal of Management and Social Sciences, 14(3): 120-123.
DOI URL |
| [2] |
Li C, Zhao Q, Wang L P, 2024. The impact mechanism and effect evaluation of digital economy development on regional carbon emission reduction: evidence from provincial panel data in China[J]. International Journal of Environmental Research, 18(6): 99.
DOI |
| [3] |
Pang Q S, Sun Y N, 2026. Coupling and coordinated development of urbanization and ecological environment in China and its spatiotemporal characteristics[J]. Sustainability, 18(9): 4559.
DOI URL |
| [4] |
Wang W J, Li Y M, 2026. Does urban-rural integration promote sustainable development of a low-carbon economy? empirical analysis of panel data from the provincial level in China[J]. Sustainability, 18(9): 4475.
DOI URL |
| [5] |
Yang D, Yang Z, Wu H Z, 2025. Effects and mechanisms of digital economy development on corporate carbon emission intensity: Empirical evidence from cross-country data[J]. Digital Economy and Sustainable Development, 3(1): 1-15.
DOI |
| [6] |
Zhang Y F, Zhang P J, Lu Z W, et al., 2026. Measuring spatial heterogeneity and obstacle factors of urban-rural integration development in Zhejiang Province, China[J]. Land, 15(5): 732.
DOI URL |
| [7] | 蔡小华, 陈丰, 2025. 数字新基建、绿色技术创新与经济高质量发展[J]. 统计与决策, 41(24): 117-122. |
| Cai X H, Chen F, 2025. Digital new infrastructure, green technological innovation, and high-quality economic development[J]. Statistics and Decision Making, 41(24): 117-122. | |
| [8] | 蔡佳怡, 赵新宇, 2025. 数字经济、要素市场化配置与城乡融合发展[J]. 经济问题 (12): 52-60. |
| Cai J Y, Zhao X Y, 2025. Digital economy, market-based allocation of factors, and integrated urban-rural development[J]. Economic Issues (12): 52-60. | |
| [9] | 杜运伟, 李思雨, 2025. 数据要素赋能城市绿色创新的机制与效应研究——来自国家级大数据综合试验区的证据[J]. 审计与经济研究, 40(5): 106-117. |
| Du Y W, Li S Y, 2025. A study on the mechanisms and effects of data factors in empowering urban green innovation: Evidence from national-level big data comprehensive pilot zones[J]. Audit and Economic Research, 40(5): 106-117. | |
| [10] |
邓淇中, 王振玉, 2025. 长江经济带市域绿色低碳转型水平变化特征及其影响因素[J]. 经济地理, 45(11): 223-233.
DOI |
| Deng Q Z, Wang Z Y, 2025. Characteristics of changes in the level of green and low-carbon transition in municipal areas of the Yangtze River economic belt and their influencing factors[J]. Economic Geography, 45(11): 223-233. | |
| [11] |
范德成, 肖文雪, 2025. 数字经济何以成为区域创新发展新动能——基于要素融合的实证分析[J]. 科技进步与对策, 42(5): 69-81.
DOI |
| Fan D C, Xiao W X, 2025. Why the digital economy has become a new engine for regional innovative development: An empirical analysis based on factor integration[J]. Science and Technology Progress and Policy, 42(5): 69-81. | |
| [12] | 方师乐, 叶俊焘, 黄祖辉, 等, 2025. 城乡融合发展与县域经济转型——来自城乡融合发展试验区的经验证据[J]. 管理世界, 41(12): 123-154. |
| Fang S L, Ye J T, Huang Z H, et al., 2025. Integrated urban-rural development and county-level economic transformation: Empirical evidence from urban-rural integration pilot zones[J]. Management World, 41(12): 123-154. | |
| [13] |
顾伟男, 高鑫, 2025. 中国绿色低碳技术创新的时空格局与多维机制空间效应研究[J]. 地理科学进展, 44(2): 256-270.
DOI |
| Gu W N, Gao X, 2025. A study on the spatiotemporal patterns and spatial effects of multi-dimensional mechanisms in China’s green and low-carbon technological innovation[J]. Advances in Geography, 44(2): 256-270. | |
| [14] | 郭丰, 杨晨, 任毅, 2025. 数字经济创新发展试验区如何影响城市碳排放——基于数字技术创新与产业结构升级视角[J]. 江汉论坛 (4): 46-57. |
| Guo F, Yang C, Ren Y, 2025. How digital economy innovation and development pilot zones affect urban carbon emissions: A perspective based on digital technology innovation and industrial structure upgrading[J]. Jianghan Forum (4): 46-57. | |
| [15] | 韩先锋, 魏欣, 2025. “绿色-共享” 数据政策何以能协同促进城市生态转型?[J]. 产业经济研究 (3): 86-99. |
| Han X F, Wei X, 2025. “How can ‘green-shared’ data policies synergistically promote urban green transition?”[J]. Industrial Economics Research (3): 86-99. | |
| [16] | 姜长云, 2025. 我国产业融合态势、问题与 “十五五” 发展思路[J]. 经济纵横 (6): 1-12. |
| Jiang C Y, 2025. Trends, issues, and development strategies for industrial integration in China during the 15th five-year plan period[J]. Economic Horizons (6): 1-12. | |
| [17] | 寇佳丽, 徐晓光, 2025. 数字经济的节能减排效应研究——基于能耗双控与减污降碳视角[J]. 产业经济研究 (2): 15-28. |
| Kou J L, Xu X G, 2025. A study on the energy-saving and emission-reduction effects of the digital economy: From the perspective of dual control of energy consumption and pollution reduction and carbon emission reduction[J]. Industrial Economics Research (2): 15-28. | |
| [18] | 刘鑫鹏, 卢新海, 2025. 因地制宜发展新质生产力: 我国老工业基地和资源型城市绿色创新绩效的增长潜力与提升路径[J]. 统计研究, 42(8): 45-58. |
| Liu X P, Lu X H, 2025. Developing new-quality productive forces in accordance with local conditions: Growth potential and improvement pathways for green innovation performance in China’s old industrial bases and resource-based cities[J]. Journal of Statistical Research, 42(8): 45-58. | |
| [19] |
梁怡彤, 王承云, 吴佳颖, 等, 2026. 长三角地区数字经济与绿色创新耦合协调演进及政策建议[J]. 自然资源学报, 41(3): 928-942.
DOI |
|
Liang Y T, Wang C Y, Wu J Y, et al., 2026. Coupled and coordinated evolution of the digital economy and green innovation in the Yangtze River delta region and policy recommendations[J]. Journal of Natural Resources, 41(3): 928-942.
DOI URL |
|
| [20] | 刘秉镰, 袁博, 刘玉海, 2025. 数字基础设施如何畅通区域间资本要素流动——基于企业注册大数据的证据[J]. 数量经济技术经济研究, 42(1): 72-92. |
| Liu B L, Yuan B, Liu Y H, 2025. How digital infrastructure facilitates the flow of capital and factors of production across regions: Evidence from big data on enterprise registration[J]. Journal of Quantitative Economics and Technical Economics, 42(1): 72-92. | |
| [21] | 李成龙, 周宏, 张良, 2025. 数字经济对城乡融合发展的影响及路径研究[J]. 重庆大学学报 (社会科学版), 31(1): 17-34. |
| Li C L, Zhou H, Zhang L, 2025. A study on the impact and pathways of the digital economy on integrated urban-rural development[J]. Journal of Chongqing University (Social Science Edition), 31(1): 17-34. | |
| [22] | 李季, 杨蓉慧, 2026. 基于多源遥感数据的黄土高原土地利用碳排放时空演变与驱动机制[J]. 应用生态学报, 37(4):1175-1186. |
| Li J, Yang R H, 2026. Assessing spatiotemporal variations and driving mechanisms of land use carbon emissions in the Loess Plateau based on multi-source remote sensing data[J]. Chinese Journal of Applied Ecology, 37(4): 1175-1186. | |
| [23] | 李慧, 佟孟华, 张国建, 等, 2025. 产业转型升级示范区的生态转型效应——基于 “数产融合” 视角[J]. 财经研究, 51(1): 4-18. |
| Li H, Tong M H, Zhang G J, et al., 2025. Green transformation effects of industrial transformation and upgrading demonstration zones: A perspective based on “digital-industrial integration”[J]. Journal of Financial and Economic Research, 51(1): 4-18. | |
| [24] |
戚琳, 田成诗, 2026. 长三角智慧城市群创新-生态-经济系统协同演化及障碍因素分析[J]. 生态环境学报, 35(4): 630-641.
DOI |
| Qi L, Tian C S, 2026. Co-evolution and obstacle factors of innovation- ecology-economy system in Yangtze River delta smart urban agglomeration[J]. Ecology and Environmental Sciences, 35(4): 630-641. | |
| [25] | 乔英俊, 张延锋, 李垣, 等, 2024. 老工业基地城市如何构建开放式创新生态破解产业负锁定困境: 以湖北十堰为例[J]. 中国软科学 (3): 109-118. |
| Qiao Y J, Zhang Y F, Li Y, et al., 2024. How cities in old industrial bases can build open innovation ecosystems to break the industrial negative lock-in dilemma: A case study of Shiyan, Hubei[J]. China Soft Science (3): 109-118. | |
| [26] | 沈坤荣, 王灿, 2025. “十五五” 时期推动经济实现质的有效提升和量的合理增长[J]. 经济理论与经济管理, 45(11): 13-26. |
| Shen K R, Wang C, 2025. Promoting qualitative improvement and reasonable quantitative growth of the economy during the 15th five- year plan period[J]. Economic Theory and Economic Management, 45(11): 13-26. | |
| [27] | 唐任伍, 史晓雯, 2025. 数字技术创新的共同富裕效应——基于277个城市的经验证据[J]. 探索 (2): 98-114. |
| Tang R W, Shi X W, 2025. The common prosperity effects of digital technology innovation: Empirical evidence from 277 cities[J]. Exploration (2): 98-114. | |
| [28] | 王群伟, 杜倩, 李振冉, 等, 2025. 数字经济和绿色化转型的碳排放双控效果: 基于制造业新质生产力的机制解析[J]. 中国管理科学, 33(11): 321-335. |
| Wang Q W, Du Q, Li Z R, et al., 2025. The dual-control effects of carbon emissions in digital and green transitions: A mechanism analysis based on new-quality productivity in manufacturing[J]. Chinese Journal of Management Science, 33(11): 321-335. | |
| [29] | 王娟娟, 张可云, 2025. 数字经济时代商贸流通促进城乡融合发展的新思路——基于区域协调发展视角[J]. 社会科学辑刊 (6): 120-131. |
| Wang J J, Zhang K Y, 2025. New approaches to promoting urban-rural integrated development through commerce and distribution in the digital economy era: A perspective on regional coordinated development[J]. Social Sciences Quarterly (6): 120-131. | |
| [30] | 汪德根, 杨易宁, 2025. 城乡融合视角下居业协同体破解传统村落空心化路径[J]. 旅游学刊, 40(2): 3-5. |
| Wang D G, Yang Y N, 2025. Pathways for residential-industrial synergy to address the hollowing-out of traditional villages from an urban-rural integration perspective[J]. Journal of Tourism Studies, 40(2): 3-5. | |
| [31] |
王悦, 于福东, 张月, 等, 2026. 基于PLUS-InVEST模型的东北黑土区景观格局与碳储量变化多情景模拟[J]. 生态环境学报, 35(2): 178-189.
DOI |
| Wang Y, Yu F D, Zhang Y, et al., 2026. Multi-scenario simulation of landscape pattern and carbon storage changes in northeast black soil region based on the PLUS-InVEST model[J]. Ecology and Environmental Sciences, 35(2): 178-189. | |
| [32] | 辛大楞, 季存睿, 辛立国, 2025. 智能制造对企业ESG表现的影响——基于 “智能制造试点示范项目” 的准自然实验[J]. 中国人口・资源与环境, 35(10): 103-113. |
| Xin D L, Ji C R, Xin L G, 2025. The impact of smart manufacturing on corporate ESG performance: A quasi-natural experiment based on the “smart manufacturing pilot demonstration projects”[J]. China Population, Resources and Environment, 35(10): 103-113. | |
| [33] |
杨婕, 戈大专, 孙攀, 等, 2025. 基于 “人口-土地-资本” 要素流动的城乡融合发展机制——以江西省为例[J]. 资源科学, 47(1): 110-124.
DOI |
| Yang J, Ge D Z, Sun P, et al., 2025. Mechanisms of urban-rural integrated development based on the flow of “population-land-capital” factors: A case study of Jiangxi province[J]. Journal of Resource Science, 47(1): 110-124. | |
| [34] | 袁华锡, 黄小洪, 袁歌骋, 等, 2025. 数字经济发展影响重污染企业绿色创新的渠道和经济效应研究[J]. 科研管理, 46(12): 179-189. |
| Yuan H X, Huang X H, Yuan G C, et al., 2025. A study on the channels and economic effects of digital economic development on green innovation in heavy-polluting enterprises[J]. Science and Technology Management, 46(12): 179-189. | |
| [35] |
杨欣蕾, 方斌, 樊彤彤, 等, 2026. 经济发达地区 “三生” 功能城乡梯度分异与空间溢出效应——以南京市为例[J]. 地理研究, 45(1): 145-164.
DOI |
| Yang X L, Fang B, Fan T T, et al., 2026. Urban-rural gradient differentiation of “three-life” functions and spatial spillover effects in economically developed regions: the case of Nanjing[J]. Geographical Research, 45(1): 145-164. | |
| [36] | 赵杨, 张慧, 2025. 中国东北地区多维分化的困境、成因与协同振兴对策研究[J]. 理论探讨, (4): 170-179. |
| Zhao Y, Zhang H, 2025. A study on the dilemmas, causes, and collaborative revitalization strategies of multidimensional differentiation in northeast China[J]. Theoretical Exploration, (4): 170-179. | |
| [37] | 张淑惠, 孙燕芳, 2023. 新基建对区域 “创新-生态-经济” 耦合协调发展的影响——基于空间溢出效应和传导机制的检验[J]. 中国人口・资源与环境, 33(10): 187-198. |
| Zhang S H, Sun Y F, 2023. The impact of new infrastructure on the coupled and coordinated development of regional “innovation- ecology-economy”: An examination based on spatial spillover effects and transmission mechanisms[J]. China Population, Resources and Environment, 33(10): 187-198. |
| [1] | Yao Xubing, Zhang Ling, Che Sifang, Deng Xiaoxia. Study on the Impact of Digital Rural Development on Agricultural Ecological Efficiency [J]. Ecology and Environmental Sciences, 2026, 35(7): 1045-1058. |
| [2] | QI Lin, TIAN Chengshi. Co-evolution and Obstacle Factors of Innovation-ecology-economy System in Yangtze River Delta Smart Urban Agglomeration [J]. Ecology and Environmental Sciences, 2026, 35(4): 630-641. |
| [3] | ZHOU Zhiluo, YANG Qiu, LIU Xiaohuang, LIU Run, LIU Jiufen, MA Min, ZHU Ping, LI Chaozhu. Spatio-temporal Distribution Changes and Coupling Coordination Analysis of the “Production-Living-Ecological Space” at the Township Scale on Hainan Island [J]. Ecology and Environmental Sciences, 2026, 35(4): 654-664. |
| [4] | SUN Yuhuan, YANG Yichen, ZHANG Tingyu. Spatial Patterns and Evolutionary Characteristics of Ecological and Economic Efficiency in China: An Ecological Priority Perspective [J]. Ecology and Environmental Sciences, 2026, 35(1): 1-14. |
| [5] | ZHAO Zhongbao, LI Jing, LIU Xiaodan, BAI Xiang, LIU Haoye, XU Xiaona, GENG Shigang, LU Shaobao. Studies on the Valuation of Forest Ecological Products and the Spatial Distribution Driving Factors in Hebei Province [J]. Ecology and Environmental Sciences, 2025, 34(2): 321-332. |
| [6] | CHENG Chuanpeng, XU Mingjie, LIU Huifeng. Effects of Thinning on Carbon Dynamics and Economic Value of Carbon Fixation in Subtropical Pinus massoniana Plantation [J]. Ecology and Environmental Sciences, 2022, 31(8): 1499-1509. |
| [7] | JIANG Chaoqiang, LI Chen, ZHU Qifa, XU Haiqing, LIU Yanhong, SHEN Jia, YAN Yifeng, YU Fei, ZU Chaolong. Evaluation of Carbon Sink and Economic Benefit in Different Planting Patterns in Southern Anhui [J]. Ecology and Environmental Sciences, 2022, 31(7): 1285-1292. |
| [8] | LIU Tao, HE Landi, ZHAO Haiying, ZHANG Wenli, CAO Xuemei. Discussion on the Generalization Path of Regional Ecological Product Value Realization [J]. Ecology and Environmental Sciences, 2022, 31(5): 1059-1070. |
| Viewed | ||||||
|
Full text |
|
|||||
|
Abstract |
|
|||||
Website Copyright © 2021 Editorial Office of Ecology and Environmental Sciences
Add: 808# Tianyuan Road, Tianhe District, Guangzhou. 510650.
Institute of Eco-environmental and Soil Sciences, Guangdong Academy of Sciences
Tel/Fax: 020-87024961; E-mail: editor@jeesci.com
Support by Beijing Magtech Co. Ltd., E-mail: support@magtech.com.cn
