Ecology and Environmental Sciences ›› 2026, Vol. 35 ›› Issue (4): 630-641.DOI: 10.16258/j.cnki.1674-5906.2026.04.013
• Research Article [Environmental Science] • Previous Articles Next Articles
QI Lin1,2( ), TIAN Chengshi1,*()
Received:2025-05-23
Revised:2025-12-06
Accepted:2025-12-12
Online:2026-04-18
Published:2026-04-14
戚琳1,2(), 田成诗1,*()
通讯作者:
*E-mail: 作者简介:戚琳(1996年生),女,博士研究生,研究方向为资源与环境统计。E-mail: sherryqilin@163.com
基金资助:CLC Number:
QI Lin, TIAN Chengshi. Co-evolution and Obstacle Factors of Innovation-ecology-economy System in Yangtze River Delta Smart Urban Agglomeration[J]. Ecology and Environmental Sciences, 2026, 35(4): 630-641.
戚琳, 田成诗. 长三角智慧城市群创新-生态-经济系统协同演化及障碍因素分析[J]. 生态环境学报, 2026, 35(4): 630-641.
Add to citation manager EndNote|Ris|BibTeX
URL: https://www.jeesci.com/EN/10.16258/j.cnki.1674-5906.2026.04.013
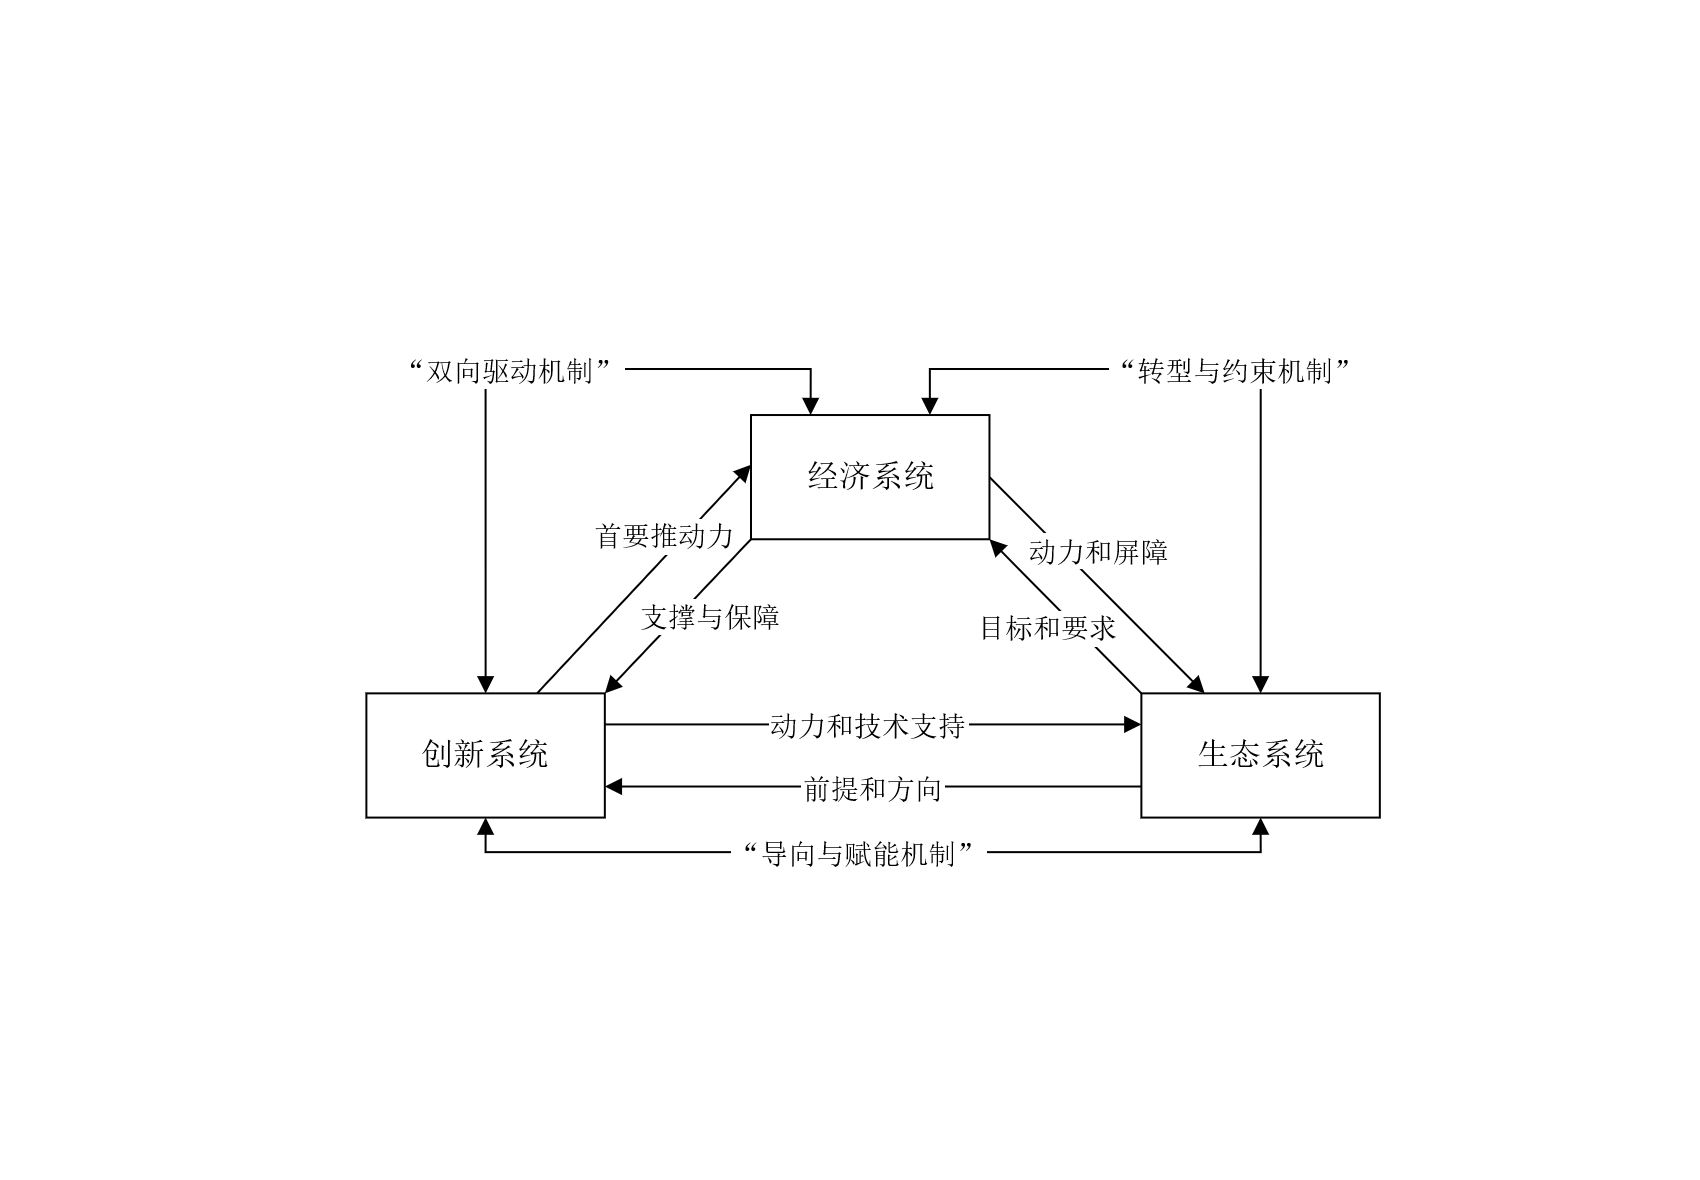
Figure 1 Coupling mechanism of innovation-ecology-economic system
| 子系统 | 准则层 | 指标层 | 指标衡量方式 | |
|---|---|---|---|---|
| 创新(a) | a1创新环境 | a11互联网普及程度 | 国际互联网用户数 | + |
| a12公共图书馆藏书量 | 公共图书馆藏书量 | + | ||
| a13高等院校数量 | 高等院校数量 | + | ||
| a14高学历人才培养 | 每万人在校大学生数 | + | ||
| a2创新投入 | a21科技经费投入 | 科技经费支出 | + | |
| a22科技人员投入 | 科技从业人员数 | + | ||
| a3创新产出 | a31专利研发成果 | 国内发明专利授权数 | + | |
| 生态(b) | b1生态状态 | b11绿化覆盖率 | 建成区绿化覆盖率 | + |
| b12水资源总量 | 水资源总量 | + | ||
| b13人均绿地面积 | 人均绿地面积 | + | ||
| b14空气质量达标比例 | 空气质量≥二级的天数比例 | + | ||
| b2生态压力 | b21废水污染 | 工业废水排放量 | − | |
| b22二氧化硫污染 | 工业二氧化硫排放量 | − | ||
| b23烟尘污染 | 工业烟(粉)排放量 | − | ||
| b3生态响应 | b31垃圾处理 | 生活垃圾无害化处理率 | + | |
| b32污水处理 | 污水厂集中处理率 | + | ||
| b33废物综合利用 | 工业废物综合利用率 | + | ||
| b34环保投资 | 环境保护投资占比 | + | ||
| 经济(c) | c1经济成果 | c11人均地区生产总值 | 人均地区生产总值 | + |
| c12地区生产总值增长率 | 地区生产总值增长率 | + | ||
| c2经济质量 | c21资本效率 | GDP/全社会固定资产投资额 | + | |
| c22劳动效率 | GDP/全部从业人员数量 | − | ||
| c23价格稳定 | 居民消费价格指数 | − | ||
| c3产业结构 | c31产业结构合理化 | 产业结构合理化指数 | − | |
| c32产业结构高级化 | 产业结构高级化指数 | + | ||
| c4开放程度 | c41外资依存度 | 实际利用外资总额/GDP | + | |
| c42贸易依存度 | 进出口总额/GDP | + |
Table 1 Evaluation index system of innovation-ecology-economy system
| 子系统 | 准则层 | 指标层 | 指标衡量方式 | |
|---|---|---|---|---|
| 创新(a) | a1创新环境 | a11互联网普及程度 | 国际互联网用户数 | + |
| a12公共图书馆藏书量 | 公共图书馆藏书量 | + | ||
| a13高等院校数量 | 高等院校数量 | + | ||
| a14高学历人才培养 | 每万人在校大学生数 | + | ||
| a2创新投入 | a21科技经费投入 | 科技经费支出 | + | |
| a22科技人员投入 | 科技从业人员数 | + | ||
| a3创新产出 | a31专利研发成果 | 国内发明专利授权数 | + | |
| 生态(b) | b1生态状态 | b11绿化覆盖率 | 建成区绿化覆盖率 | + |
| b12水资源总量 | 水资源总量 | + | ||
| b13人均绿地面积 | 人均绿地面积 | + | ||
| b14空气质量达标比例 | 空气质量≥二级的天数比例 | + | ||
| b2生态压力 | b21废水污染 | 工业废水排放量 | − | |
| b22二氧化硫污染 | 工业二氧化硫排放量 | − | ||
| b23烟尘污染 | 工业烟(粉)排放量 | − | ||
| b3生态响应 | b31垃圾处理 | 生活垃圾无害化处理率 | + | |
| b32污水处理 | 污水厂集中处理率 | + | ||
| b33废物综合利用 | 工业废物综合利用率 | + | ||
| b34环保投资 | 环境保护投资占比 | + | ||
| 经济(c) | c1经济成果 | c11人均地区生产总值 | 人均地区生产总值 | + |
| c12地区生产总值增长率 | 地区生产总值增长率 | + | ||
| c2经济质量 | c21资本效率 | GDP/全社会固定资产投资额 | + | |
| c22劳动效率 | GDP/全部从业人员数量 | − | ||
| c23价格稳定 | 居民消费价格指数 | − | ||
| c3产业结构 | c31产业结构合理化 | 产业结构合理化指数 | − | |
| c32产业结构高级化 | 产业结构高级化指数 | + | ||
| c4开放程度 | c41外资依存度 | 实际利用外资总额/GDP | + | |
| c42贸易依存度 | 进出口总额/GDP | + |
| 耦合度C | 耦合协调度D | ||
|---|---|---|---|
| 区间 | 耦合阶段 | 区间 | 协调阶段 |
| 0≤C<0.3 | 低水平耦合阶段 | 0≤D<0.1 | 极度失调 |
| 0.1≤D<0.2 | 严重失调 | ||
| 0.3≤C<0.5 | 拮抗阶段 | 0.2≤D<0.3 | 中度失调 |
| 0.3≤D<0.4 | 轻度失调 | ||
| 0.5≤C<0.6 | 初步磨合阶段 | 0.4≤D<0.5 | 濒临失调 |
| 0.5≤D<0.6 | 勉强协调 | ||
| 0.6≤C<0.8 | 深度磨合阶段 | 0.6≤D<0.7 | 初级协调 |
| 0.7≤D<0.8 | 中级协调 | ||
| 0.8≤C≤1 | 高水平耦合阶段 | 0.8≤D<0.9 | 良好协调 |
| 0.9≤D≤1 | 优质协调 | ||
Table 2 Classification and judgment criteria of coupling degree and coupling coordination degree
| 耦合度C | 耦合协调度D | ||
|---|---|---|---|
| 区间 | 耦合阶段 | 区间 | 协调阶段 |
| 0≤C<0.3 | 低水平耦合阶段 | 0≤D<0.1 | 极度失调 |
| 0.1≤D<0.2 | 严重失调 | ||
| 0.3≤C<0.5 | 拮抗阶段 | 0.2≤D<0.3 | 中度失调 |
| 0.3≤D<0.4 | 轻度失调 | ||
| 0.5≤C<0.6 | 初步磨合阶段 | 0.4≤D<0.5 | 濒临失调 |
| 0.5≤D<0.6 | 勉强协调 | ||
| 0.6≤C<0.8 | 深度磨合阶段 | 0.6≤D<0.7 | 初级协调 |
| 0.7≤D<0.8 | 中级协调 | ||
| 0.8≤C≤1 | 高水平耦合阶段 | 0.8≤D<0.9 | 良好协调 |
| 0.9≤D≤1 | 优质协调 | ||
| 城市 | 2013年 | 2017年 | 2021年 | 城市 | 2013年 | 2017年 | 2021年 |
|---|---|---|---|---|---|---|---|
| 上海 | 0.563 | 0.752 | 0.920 | 台州 | 0.032 | 0.051 | 0.084 |
| 南京 | 0.268 | 0.341 | 0.455 | 丽水 | 0.019 | 0.023 | 0.026 |
| 无锡 | 0.085 | 0.121 | 0.154 | 衢州 | 0.012 | 0.022 | 0.029 |
| 徐州 | 0.042 | 0.061 | 0.094 | 宁波 | 0.107 | 0.149 | 0.203 |
| 常州 | 0.059 | 0.084 | 0.108 | 宣城 | 0.004 | 0.011 | 0.020 |
| 苏州 | 0.130 | 0.246 | 0.353 | 宿州 | 0.009 | 0.019 | 0.026 |
| 南通 | 0.041 | 0.076 | 0.103 | 滁州 | 0.015 | 0.028 | 0.040 |
| 连云港 | 0.021 | 0.032 | 0.047 | 池州 | 0.015 | 0.016 | 0.021 |
| 淮安 | 0.026 | 0.038 | 0.053 | 阜阳 | 0.010 | 0.021 | 0.038 |
| 盐城 | 0.029 | 0.043 | 0.074 | 六安 | 0.013 | 0.019 | 0.029 |
| 扬州 | 0.036 | 0.050 | 0.076 | 合肥 | 0.171 | 0.224 | 0.307 |
| 镇江 | 0.045 | 0.067 | 0.086 | 蚌埠 | 0.026 | 0.036 | 0.038 |
| 泰州 | 0.021 | 0.033 | 0.061 | 淮南 | 0.027 | 0.036 | 0.032 |
| 宿迁 | 0.008 | 0.016 | 0.032 | 铜陵 | 0.029 | 0.041 | 0.030 |
| 杭州 | 0.260 | 0.317 | 0.407 | 马鞍山 | 0.028 | 0.040 | 0.051 |
| 嘉兴 | 0.047 | 0.069 | 0.094 | 淮北 | 0.015 | 0.021 | 0.024 |
| 湖州 | 0.024 | 0.038 | 0.051 | 芜湖 | 0.058 | 0.074 | 0.096 |
| 舟山 | 0.023 | 0.041 | 0.037 | 安庆 | 0.018 | 0.025 | 0.037 |
| 金华 | 0.045 | 0.049 | 0.086 | 黄山 | 0.011 | 0.016 | 0.020 |
| 绍兴 | 0.040 | 0.063 | 0.110 | 亳州 | 0.004 | 0.010 | 0.020 |
| 温州 | 0.048 | 0.081 | 0.132 |
Table 3 Development index of innovation system in YRD urban agglomeration
| 城市 | 2013年 | 2017年 | 2021年 | 城市 | 2013年 | 2017年 | 2021年 |
|---|---|---|---|---|---|---|---|
| 上海 | 0.563 | 0.752 | 0.920 | 台州 | 0.032 | 0.051 | 0.084 |
| 南京 | 0.268 | 0.341 | 0.455 | 丽水 | 0.019 | 0.023 | 0.026 |
| 无锡 | 0.085 | 0.121 | 0.154 | 衢州 | 0.012 | 0.022 | 0.029 |
| 徐州 | 0.042 | 0.061 | 0.094 | 宁波 | 0.107 | 0.149 | 0.203 |
| 常州 | 0.059 | 0.084 | 0.108 | 宣城 | 0.004 | 0.011 | 0.020 |
| 苏州 | 0.130 | 0.246 | 0.353 | 宿州 | 0.009 | 0.019 | 0.026 |
| 南通 | 0.041 | 0.076 | 0.103 | 滁州 | 0.015 | 0.028 | 0.040 |
| 连云港 | 0.021 | 0.032 | 0.047 | 池州 | 0.015 | 0.016 | 0.021 |
| 淮安 | 0.026 | 0.038 | 0.053 | 阜阳 | 0.010 | 0.021 | 0.038 |
| 盐城 | 0.029 | 0.043 | 0.074 | 六安 | 0.013 | 0.019 | 0.029 |
| 扬州 | 0.036 | 0.050 | 0.076 | 合肥 | 0.171 | 0.224 | 0.307 |
| 镇江 | 0.045 | 0.067 | 0.086 | 蚌埠 | 0.026 | 0.036 | 0.038 |
| 泰州 | 0.021 | 0.033 | 0.061 | 淮南 | 0.027 | 0.036 | 0.032 |
| 宿迁 | 0.008 | 0.016 | 0.032 | 铜陵 | 0.029 | 0.041 | 0.030 |
| 杭州 | 0.260 | 0.317 | 0.407 | 马鞍山 | 0.028 | 0.040 | 0.051 |
| 嘉兴 | 0.047 | 0.069 | 0.094 | 淮北 | 0.015 | 0.021 | 0.024 |
| 湖州 | 0.024 | 0.038 | 0.051 | 芜湖 | 0.058 | 0.074 | 0.096 |
| 舟山 | 0.023 | 0.041 | 0.037 | 安庆 | 0.018 | 0.025 | 0.037 |
| 金华 | 0.045 | 0.049 | 0.086 | 黄山 | 0.011 | 0.016 | 0.020 |
| 绍兴 | 0.040 | 0.063 | 0.110 | 亳州 | 0.004 | 0.010 | 0.020 |
| 温州 | 0.048 | 0.081 | 0.132 |
| 城市 | 2013年 | 2017年 | 2021年 | 城市 | 2013年 | 2017年 | 2021年 |
|---|---|---|---|---|---|---|---|
| 上海 | 0.473 | 0.486 | 0.546 | 台州 | 0.325 | 0.382 | 0.511 |
| 南京 | 0.192 | 0.242 | 0.221 | 丽水 | 0.375 | 0.662 | 0.620 |
| 无锡 | 0.303 | 0.287 | 0.281 | 衢州 | 0.338 | 0.489 | 0.517 |
| 徐州 | 0.232 | 0.245 | 0.249 | 宁波 | 0.240 | 0.393 | 0.428 |
| 常州 | 0.277 | 0.253 | 0.260 | 宣城 | 0.328 | 0.410 | 0.404 |
| 苏州 | 0.199 | 0.314 | 0.258 | 宿州 | 0.167 | 0.211 | 0.233 |
| 南通 | 0.262 | 0.291 | 0.234 | 滁州 | 0.242 | 0.279 | 0.252 |
| 连云港 | 0.171 | 0.243 | 0.255 | 池州 | 0.272 | 0.439 | 0.424 |
| 淮安 | 0.245 | 0.314 | 0.205 | 阜阳 | 0.169 | 0.214 | 0.250 |
| 盐城 | 0.274 | 0.341 | 0.234 | 六安 | 0.292 | 0.410 | 0.303 |
| 扬州 | 0.265 | 0.289 | 0.264 | 合肥 | 0.230 | 0.268 | 0.324 |
| 镇江 | 0.261 | 0.302 | 0.238 | 蚌埠 | 0.328 | 0.217 | 0.222 |
| 泰州 | 0.223 | 0.240 | 0.219 | 淮南 | 0.151 | 0.198 | 0.247 |
| 宿迁 | 0.223 | 0.234 | 0.224 | 铜陵 | 0.209 | 0.337 | 0.240 |
| 杭州 | 0.395 | 0.627 | 0.530 | 马鞍山 | 0.215 | 0.227 | 0.299 |
| 嘉兴 | 0.217 | 0.283 | 0.287 | 淮北 | 0.164 | 0.190 | 0.202 |
| 湖州 | 0.326 | 0.360 | 0.371 | 芜湖 | 0.299 | 0.259 | 0.346 |
| 舟山 | 0.158 | 0.177 | 0.205 | 安庆 | 0.302 | 0.399 | 0.333 |
| 金华 | 0.328 | 0.445 | 0.450 | 黄山 | 0.392 | 0.566 | 0.489 |
| 绍兴 | 0.275 | 0.360 | 0.359 | 亳州 | 0.199 | 0.215 | 0.290 |
| 温州 | 0.313 | 0.447 | 0.441 |
Table 4 Development index of ecology system in YRD urban agglomeration
| 城市 | 2013年 | 2017年 | 2021年 | 城市 | 2013年 | 2017年 | 2021年 |
|---|---|---|---|---|---|---|---|
| 上海 | 0.473 | 0.486 | 0.546 | 台州 | 0.325 | 0.382 | 0.511 |
| 南京 | 0.192 | 0.242 | 0.221 | 丽水 | 0.375 | 0.662 | 0.620 |
| 无锡 | 0.303 | 0.287 | 0.281 | 衢州 | 0.338 | 0.489 | 0.517 |
| 徐州 | 0.232 | 0.245 | 0.249 | 宁波 | 0.240 | 0.393 | 0.428 |
| 常州 | 0.277 | 0.253 | 0.260 | 宣城 | 0.328 | 0.410 | 0.404 |
| 苏州 | 0.199 | 0.314 | 0.258 | 宿州 | 0.167 | 0.211 | 0.233 |
| 南通 | 0.262 | 0.291 | 0.234 | 滁州 | 0.242 | 0.279 | 0.252 |
| 连云港 | 0.171 | 0.243 | 0.255 | 池州 | 0.272 | 0.439 | 0.424 |
| 淮安 | 0.245 | 0.314 | 0.205 | 阜阳 | 0.169 | 0.214 | 0.250 |
| 盐城 | 0.274 | 0.341 | 0.234 | 六安 | 0.292 | 0.410 | 0.303 |
| 扬州 | 0.265 | 0.289 | 0.264 | 合肥 | 0.230 | 0.268 | 0.324 |
| 镇江 | 0.261 | 0.302 | 0.238 | 蚌埠 | 0.328 | 0.217 | 0.222 |
| 泰州 | 0.223 | 0.240 | 0.219 | 淮南 | 0.151 | 0.198 | 0.247 |
| 宿迁 | 0.223 | 0.234 | 0.224 | 铜陵 | 0.209 | 0.337 | 0.240 |
| 杭州 | 0.395 | 0.627 | 0.530 | 马鞍山 | 0.215 | 0.227 | 0.299 |
| 嘉兴 | 0.217 | 0.283 | 0.287 | 淮北 | 0.164 | 0.190 | 0.202 |
| 湖州 | 0.326 | 0.360 | 0.371 | 芜湖 | 0.299 | 0.259 | 0.346 |
| 舟山 | 0.158 | 0.177 | 0.205 | 安庆 | 0.302 | 0.399 | 0.333 |
| 金华 | 0.328 | 0.445 | 0.450 | 黄山 | 0.392 | 0.566 | 0.489 |
| 绍兴 | 0.275 | 0.360 | 0.359 | 亳州 | 0.199 | 0.215 | 0.290 |
| 温州 | 0.313 | 0.447 | 0.441 |
| 城市 | 2013年 | 2017年 | 2021年 | 城市 | 2013年 | 2017年 | 2021年 |
|---|---|---|---|---|---|---|---|
| 上海 | 0.608 | 0.707 | 0.823 | 台州 | 0.114 | 0.123 | 0.146 |
| 南京 | 0.215 | 0.238 | 0.306 | 丽水 | 0.051 | 0.076 | 0.090 |
| 无锡 | 0.210 | 0.222 | 0.267 | 衢州 | 0.153 | 0.307 | 0.096 |
| 徐州 | 0.097 | 0.124 | 0.150 | 宁波 | 0.245 | 0.266 | 0.299 |
| 常州 | 0.187 | 0.174 | 0.208 | 宣城 | 0.069 | 0.102 | 0.113 |
| 苏州 | 0.298 | 0.323 | 0.374 | 宿州 | 0.061 | 0.085 | 0.095 |
| 南通 | 0.138 | 0.161 | 0.186 | 滁州 | 0.070 | 0.101 | 0.111 |
| 连云港 | 0.104 | 0.110 | 0.109 | 池州 | 0.063 | 0.083 | 0.084 |
| 淮安 | 0.123 | 0.116 | 0.116 | 阜阳 | 0.049 | 0.063 | 0.082 |
| 盐城 | 0.111 | 0.118 | 0.128 | 六安 | 0.045 | 0.060 | 0.082 |
| 扬州 | 0.140 | 0.126 | 0.152 | 合肥 | 0.124 | 0.158 | 0.216 |
| 镇江 | 0.141 | 0.143 | 0.138 | 蚌埠 | 0.075 | 0.117 | 0.105 |
| 泰州 | 0.109 | 0.115 | 0.139 | 淮南 | 0.051 | 0.053 | 0.072 |
| 宿迁 | 0.058 | 0.075 | 0.091 | 铜陵 | 0.100 | 0.077 | 0.115 |
| 杭州 | 0.231 | 0.276 | 0.336 | 马鞍山 | 0.105 | 0.147 | 0.164 |
| 嘉兴 | 0.130 | 0.155 | 0.218 | 淮北 | 0.054 | 0.079 | 0.069 |
| 湖州 | 0.226 | 0.187 | 0.164 | 芜湖 | 0.086 | 0.135 | 0.154 |
| 舟山 | 0.085 | 0.099 | 0.211 | 安庆 | 0.040 | 0.061 | 0.073 |
| 金华 | 0.126 | 0.128 | 0.184 | 黄山 | 0.073 | 0.071 | 0.086 |
| 绍兴 | 0.121 | 0.133 | 0.173 | 亳州 | 0.064 | 0.085 | 0.097 |
| 温州 | 0.124 | 0.137 | 0.156 |
Table 5 Development index of economy system in YRD urban agglomeration
| 城市 | 2013年 | 2017年 | 2021年 | 城市 | 2013年 | 2017年 | 2021年 |
|---|---|---|---|---|---|---|---|
| 上海 | 0.608 | 0.707 | 0.823 | 台州 | 0.114 | 0.123 | 0.146 |
| 南京 | 0.215 | 0.238 | 0.306 | 丽水 | 0.051 | 0.076 | 0.090 |
| 无锡 | 0.210 | 0.222 | 0.267 | 衢州 | 0.153 | 0.307 | 0.096 |
| 徐州 | 0.097 | 0.124 | 0.150 | 宁波 | 0.245 | 0.266 | 0.299 |
| 常州 | 0.187 | 0.174 | 0.208 | 宣城 | 0.069 | 0.102 | 0.113 |
| 苏州 | 0.298 | 0.323 | 0.374 | 宿州 | 0.061 | 0.085 | 0.095 |
| 南通 | 0.138 | 0.161 | 0.186 | 滁州 | 0.070 | 0.101 | 0.111 |
| 连云港 | 0.104 | 0.110 | 0.109 | 池州 | 0.063 | 0.083 | 0.084 |
| 淮安 | 0.123 | 0.116 | 0.116 | 阜阳 | 0.049 | 0.063 | 0.082 |
| 盐城 | 0.111 | 0.118 | 0.128 | 六安 | 0.045 | 0.060 | 0.082 |
| 扬州 | 0.140 | 0.126 | 0.152 | 合肥 | 0.124 | 0.158 | 0.216 |
| 镇江 | 0.141 | 0.143 | 0.138 | 蚌埠 | 0.075 | 0.117 | 0.105 |
| 泰州 | 0.109 | 0.115 | 0.139 | 淮南 | 0.051 | 0.053 | 0.072 |
| 宿迁 | 0.058 | 0.075 | 0.091 | 铜陵 | 0.100 | 0.077 | 0.115 |
| 杭州 | 0.231 | 0.276 | 0.336 | 马鞍山 | 0.105 | 0.147 | 0.164 |
| 嘉兴 | 0.130 | 0.155 | 0.218 | 淮北 | 0.054 | 0.079 | 0.069 |
| 湖州 | 0.226 | 0.187 | 0.164 | 芜湖 | 0.086 | 0.135 | 0.154 |
| 舟山 | 0.085 | 0.099 | 0.211 | 安庆 | 0.040 | 0.061 | 0.073 |
| 金华 | 0.126 | 0.128 | 0.184 | 黄山 | 0.073 | 0.071 | 0.086 |
| 绍兴 | 0.121 | 0.133 | 0.173 | 亳州 | 0.064 | 0.085 | 0.097 |
| 温州 | 0.124 | 0.137 | 0.156 |
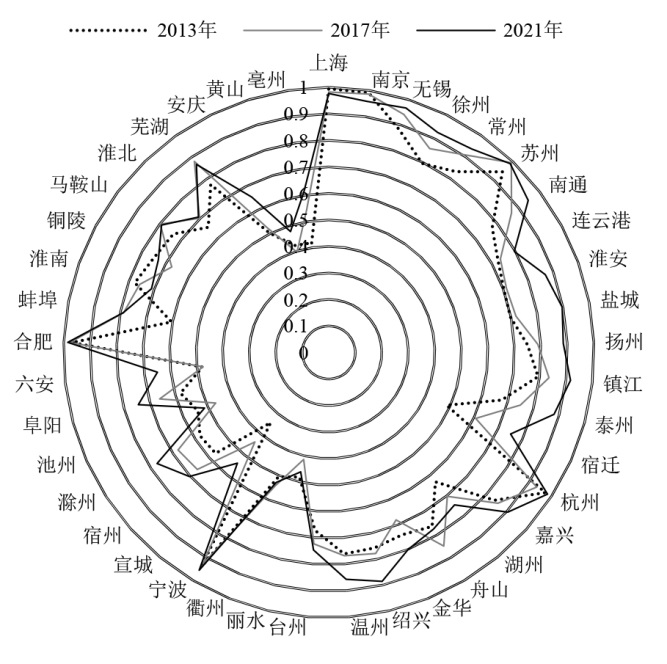
Figure 2 Coupling degree of innovation-ecology-economic system in the YRD urban agglomeration
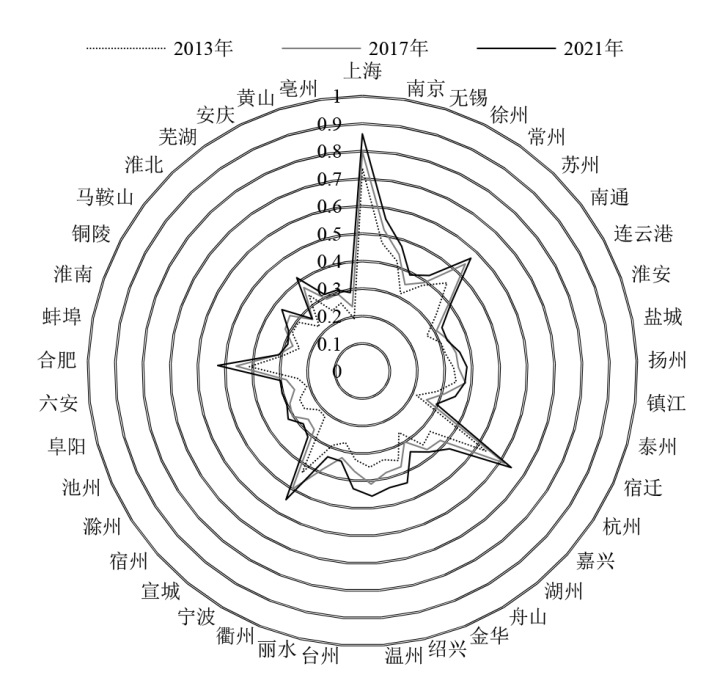
Figure 3 Coupling coordination degree of innovation-ecology-economic system in the YRD urban agglomeration
| 年份 | 总体差距 | 区域内差距 | 区域间差距 | 贡献率/% | ||||||||||||
|---|---|---|---|---|---|---|---|---|---|---|---|---|---|---|---|---|
| 上海 | 浙江 | 江苏 | 安徽 | 上海-浙江 | 上海-江苏 | 上海-安徽 | 浙江-江苏 | 浙江-安徽 | 江苏-安徽 | 区域内 | 区域间 | 超变密度 | ||||
| 2013 | 0.157 | 0.000 | 0.108 | 0.114 | 0.107 | 0.360 | 0.369 | 0.478 | 0.114 | 0.166 | 0.163 | 21.52 | 59.06 | 19.42 | ||
| 2014 | 0.152 | 0.000 | 0.107 | 0.107 | 0.101 | 0.335 | 0.362 | 0.465 | 0.112 | 0.173 | 0.152 | 21.17 | 62.47 | 16.36 | ||
| 2015 | 0.146 | 0.000 | 0.103 | 0.108 | 0.095 | 0.344 | 0.362 | 0.457 | 0.109 | 0.155 | 0.144 | 21.58 | 59.71 | 18.71 | ||
| 2016 | 0.144 | 0.000 | 0.096 | 0.107 | 0.086 | 0.345 | 0.373 | 0.466 | 0.108 | 0.160 | 0.138 | 20.50 | 63.53 | 15.97 | ||
| 2017 | 0.145 | 0.000 | 0.101 | 0.112 | 0.086 | 0.331 | 0.356 | 0.452 | 0.112 | 0.160 | 0.143 | 21.04 | 61.58 | 17.38 | ||
| 2018 | 0.145 | 0.000 | 0.104 | 0.116 | 0.088 | 0.337 | 0.348 | 0.445 | 0.113 | 0.152 | 0.146 | 21.71 | 57.25 | 21.04 | ||
| 2019 | 0.140 | 0.000 | 0.100 | 0.106 | 0.079 | 0.338 | 0.356 | 0.448 | 0.107 | 0.152 | 0.139 | 20.72 | 60.09 | 19.19 | ||
| 2020 | 0.143 | 0.000 | 0.110 | 0.109 | 0.084 | 0.343 | 0.355 | 0.447 | 0.113 | 0.150 | 0.140 | 21.46 | 57.13 | 21.41 | ||
| 2021 | 0.146 | 0.000 | 0.108 | 0.109 | 0.083 | 0.331 | 0.363 | 0.452 | 0.116 | 0.165 | 0.140 | 20.76 | 61.06 | 18.18 | ||
Table 6 Analysis of regional differences in coupling coordination degree of the YRD urban agglomeration
| 年份 | 总体差距 | 区域内差距 | 区域间差距 | 贡献率/% | ||||||||||||
|---|---|---|---|---|---|---|---|---|---|---|---|---|---|---|---|---|
| 上海 | 浙江 | 江苏 | 安徽 | 上海-浙江 | 上海-江苏 | 上海-安徽 | 浙江-江苏 | 浙江-安徽 | 江苏-安徽 | 区域内 | 区域间 | 超变密度 | ||||
| 2013 | 0.157 | 0.000 | 0.108 | 0.114 | 0.107 | 0.360 | 0.369 | 0.478 | 0.114 | 0.166 | 0.163 | 21.52 | 59.06 | 19.42 | ||
| 2014 | 0.152 | 0.000 | 0.107 | 0.107 | 0.101 | 0.335 | 0.362 | 0.465 | 0.112 | 0.173 | 0.152 | 21.17 | 62.47 | 16.36 | ||
| 2015 | 0.146 | 0.000 | 0.103 | 0.108 | 0.095 | 0.344 | 0.362 | 0.457 | 0.109 | 0.155 | 0.144 | 21.58 | 59.71 | 18.71 | ||
| 2016 | 0.144 | 0.000 | 0.096 | 0.107 | 0.086 | 0.345 | 0.373 | 0.466 | 0.108 | 0.160 | 0.138 | 20.50 | 63.53 | 15.97 | ||
| 2017 | 0.145 | 0.000 | 0.101 | 0.112 | 0.086 | 0.331 | 0.356 | 0.452 | 0.112 | 0.160 | 0.143 | 21.04 | 61.58 | 17.38 | ||
| 2018 | 0.145 | 0.000 | 0.104 | 0.116 | 0.088 | 0.337 | 0.348 | 0.445 | 0.113 | 0.152 | 0.146 | 21.71 | 57.25 | 21.04 | ||
| 2019 | 0.140 | 0.000 | 0.100 | 0.106 | 0.079 | 0.338 | 0.356 | 0.448 | 0.107 | 0.152 | 0.139 | 20.72 | 60.09 | 19.19 | ||
| 2020 | 0.143 | 0.000 | 0.110 | 0.109 | 0.084 | 0.343 | 0.355 | 0.447 | 0.113 | 0.150 | 0.140 | 21.46 | 57.13 | 21.41 | ||
| 2021 | 0.146 | 0.000 | 0.108 | 0.109 | 0.083 | 0.331 | 0.363 | 0.452 | 0.116 | 0.165 | 0.140 | 20.76 | 61.06 | 18.18 | ||
| 年份 | 2013 | 2014 | 2015 | 2016 | 2017 | 2018 | 2019 | 2020 | 2021 |
|---|---|---|---|---|---|---|---|---|---|
| 莫兰指数Z得分 | 0.260 (2.74) | 0.265 (2.77) | 0.263 (2.78) | 0.243 (2.62) | 0.260 (2.73) | 0.251 (2.63) | 0.242 (2.57) | 0.265 (2.78) | 0.262 (2.74) |
Table 7 The overall spatial relationship of coupling coordination degree of the YRD urban agglomeration
| 年份 | 2013 | 2014 | 2015 | 2016 | 2017 | 2018 | 2019 | 2020 | 2021 |
|---|---|---|---|---|---|---|---|---|---|
| 莫兰指数Z得分 | 0.260 (2.74) | 0.265 (2.77) | 0.263 (2.78) | 0.243 (2.62) | 0.260 (2.73) | 0.251 (2.63) | 0.242 (2.57) | 0.265 (2.78) | 0.262 (2.74) |
| 区域 | 指数得分 | 2013 | 2014 | 2015 | 2016 | 2017 | 2018 | 2019 | 2020 | 2021 |
|---|---|---|---|---|---|---|---|---|---|---|
| 江苏 | 莫兰指数 Z得分 | 0.4182 (2.65) | 0.3896 (2.51) | 0.3825 (2.48) | 0.3355 (2.23) | 0.3164 (2.15) | 0.3403 (2.26) | 0.3066 (2.09) | 0.2705 (1.90) | 0.2808 (1.95) |
| 浙江 | 莫兰指数 Z得分 | −0.1539 (−0.25) | −0.2682 (−0.79) | −0.2848 (−0.85) | −0.3374 (−1.11) | −0.3593 (−1.24) | −0.3726 (−1.29) | −0.2597 (−0.74) | −0.1079 (−0.03) | −0.1682 (−0.30) |
| 安徽 | 莫兰指数 Z得分 | 0.4403 (2.62) | 0.4817 (2.94) | 0.4875 (2.96) | 0.4263 (2.80) | 0.4432 (2.83) | 0.2467 (1.80) | 0.2391 (1.88) | 0.2618 (2.02) | 0.3517 (2.51) |
Table 8 Provincial spatial relationship of coupling coordination degree of the YRD urban agglomeration
| 区域 | 指数得分 | 2013 | 2014 | 2015 | 2016 | 2017 | 2018 | 2019 | 2020 | 2021 |
|---|---|---|---|---|---|---|---|---|---|---|
| 江苏 | 莫兰指数 Z得分 | 0.4182 (2.65) | 0.3896 (2.51) | 0.3825 (2.48) | 0.3355 (2.23) | 0.3164 (2.15) | 0.3403 (2.26) | 0.3066 (2.09) | 0.2705 (1.90) | 0.2808 (1.95) |
| 浙江 | 莫兰指数 Z得分 | −0.1539 (−0.25) | −0.2682 (−0.79) | −0.2848 (−0.85) | −0.3374 (−1.11) | −0.3593 (−1.24) | −0.3726 (−1.29) | −0.2597 (−0.74) | −0.1079 (−0.03) | −0.1682 (−0.30) |
| 安徽 | 莫兰指数 Z得分 | 0.4403 (2.62) | 0.4817 (2.94) | 0.4875 (2.96) | 0.4263 (2.80) | 0.4432 (2.83) | 0.2467 (1.80) | 0.2391 (1.88) | 0.2618 (2.02) | 0.3517 (2.51) |
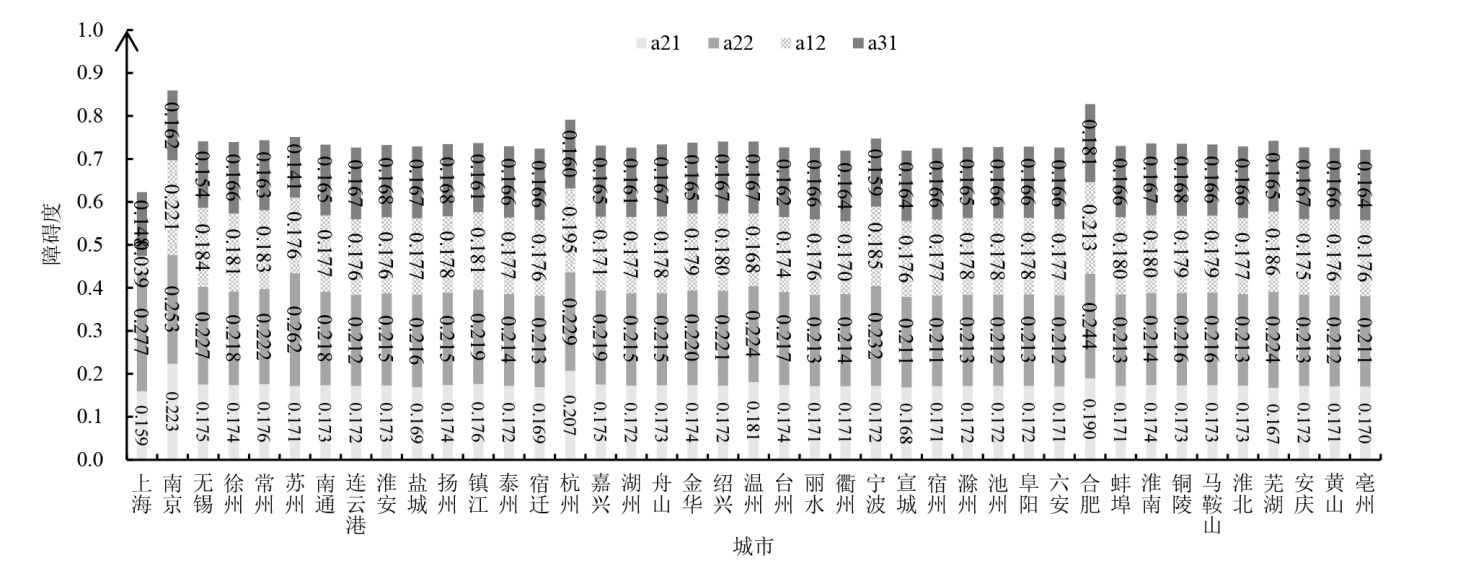
Figure 4 The main obstacle indicators of the innovation system of the YRD urban agglomeration
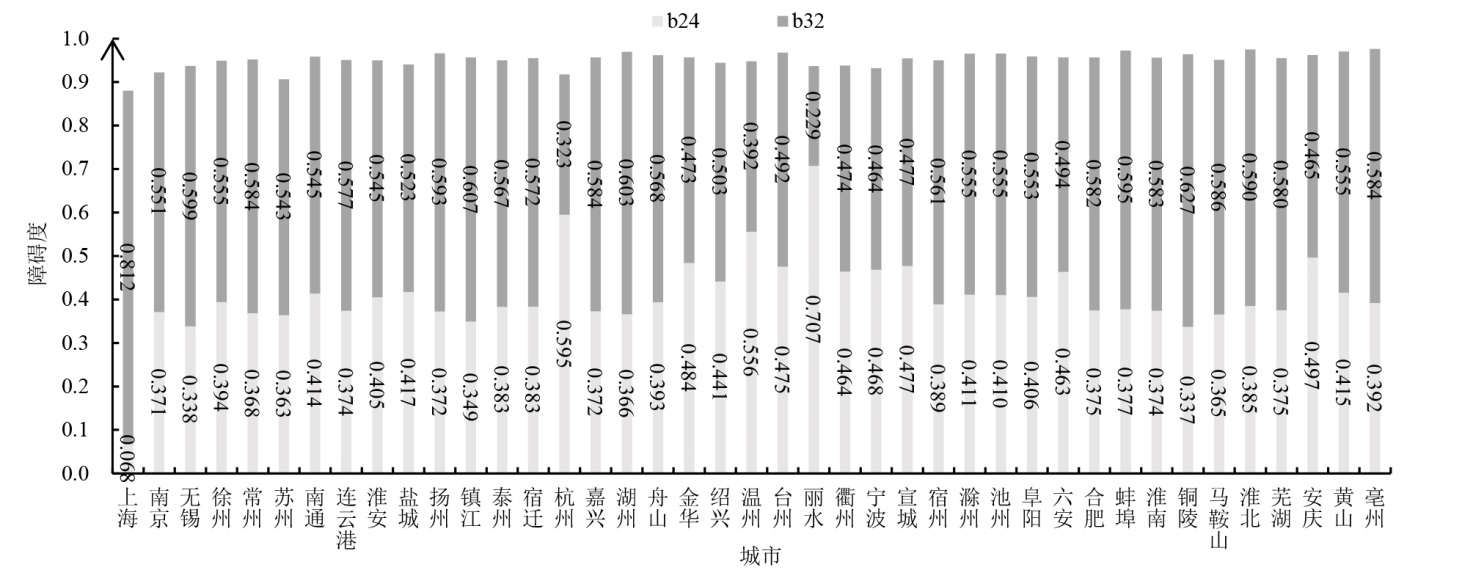
Figure 5 The main obstacle indicators of the ecology system of the YRD urban agglomeration
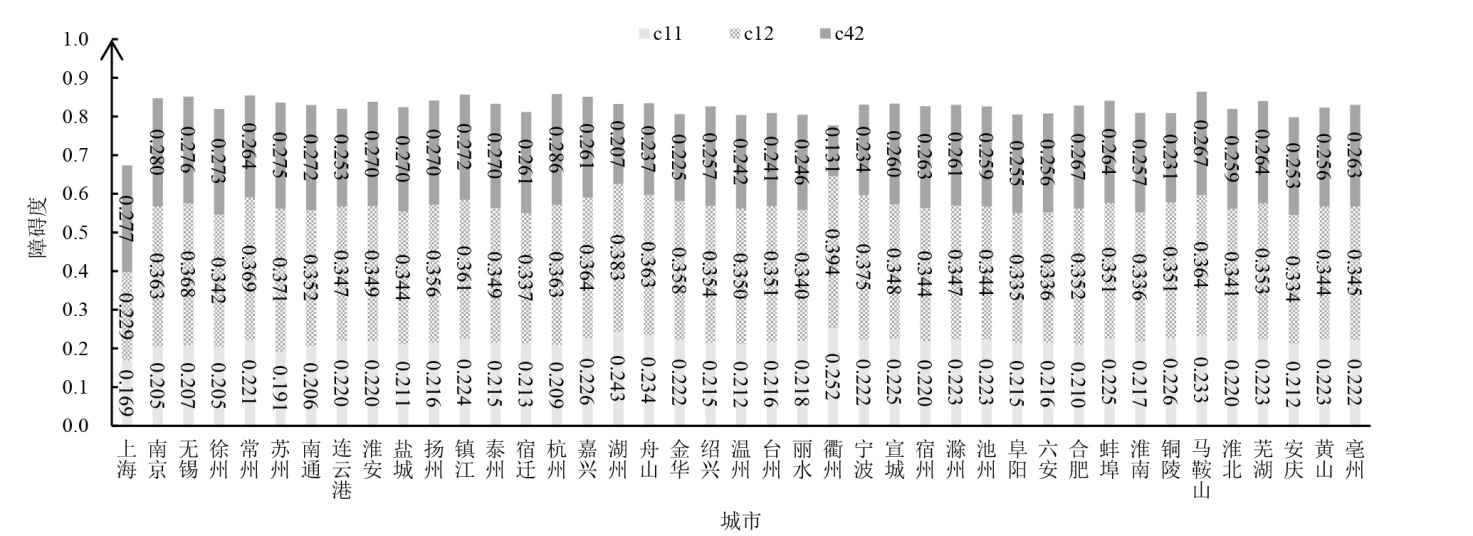
Figure 6 The main obstacle indicators of the economic development system of the YRD urban agglomeration
| [1] |
DAGUM C, 1997. A new approach to the decomposition of the GINI income inequality ratio[J]. Empirical Economics, 22(4): 515-531.
DOI URL |
| [2] |
GIL-GARCIA J R, CHEN T, GASCO-HERNANDEZ M, 2023. Smart city results and sustainability: Current progress and emergent opportunities for future research[J]. Sustainability, 15(10): 8082.
DOI URL |
| [3] |
HAARSTAD H, WATHNE M W, 2019. Are smart city projects catalyzing urban energy sustainability?[J]. Energy Policy, 129: 918-925.
DOI |
| [4] |
KIM J H, 2022. Smart city trends: A focus on 5 countries and 15 companies[J]. Cities, 123: 103551.
DOI URL |
| [5] |
LI Z J, ZHANG W J, SARWAR S, HU M J, 2023. The spatio-temporal interactive effects between ecological urbanization and industrial ecologization in the Yangtze River Delta region[J]. Sustainable Development, 31(5): 3254-3271.
DOI URL |
| [6] |
MARCH J G, 1991. Exploration and exploitation in organizational learning[J]. Organization Science, 2(1): 71-87.
DOI URL |
| [7] |
ROMER P M, 1986. Increasing returns and long-run growth[J]. Journal of political economy, 94(5): 1002-1037.
DOI URL |
| [8] |
SHU Y X, DENG N X, WU Y M, et al., 2023. Urban governance and sustainable development: The effect of smart city on carbon emission in China[J]. Technological Forecasting and Social Change, 193: 122643.
DOI URL |
| [9] |
TAO J, XIE Y J, ZHOU H Y, et al., 2022. Cross-county characteristics of water-ecology-economy coupling coordination in the Wuding River watershed, China[J]. Land, 11(12): 2283.
DOI URL |
| [10] |
曹靖, 张文忠, 2020. 不同时期城市创新投入对绿色经济效率的影响——以粤港澳大湾区为例[J]. 地理研究, 39(9): 1987-1999.
DOI |
| CAO J, ZHANG W Z, 2020. The influence of urban innovation input on green economy efficiency in different periods: A case study of the Guangdong-Hong Kong-Macao Bay Area[J]. Geographical Research, 39(9): 1987-1999. | |
| [11] | 陈斌, 李拓, 2020. 财政分权和环境规制促进了中国绿色技术创新吗?[J]. 统计研究, 37(6): 27-39. |
| CHEN B, LI T, 2020. Do fiscal decentralization and environmental regulation promote green technology innovation in China?[J]. Statistical Research, 37(6): 27-39. | |
| [12] | 葛鹏飞, 韩永楠, 武宵旭, 2020. 中国创新与经济发展的耦合协调性测度与评价[J]. 数量经济技术经济研究, 37(10): 101-117. |
| GE P F, HAN Y N, WU X X, 2020. Measurement and evaluation of the coupling coordination between innovation and economic development in China[J]. The Journal of Quantitative & Technical Economics, 37(10): 101-117. | |
| [13] | 顾炜宇, 闫伟峰, 祝伟, 等, 2025. 数字经济、技术创新与生态效率: 来自我国30个省份面板数据的证据[J]. 中国软科学, 40(2): 181-195. |
| GU W Y, YAN W F, ZHU W, et al., 2025. Digital economy, technological innovation and eco-efficiency: Evidence from panel data from 30 provinces and cities in China[J]. China Soft Science, 40(2): 181-195. | |
| [14] |
韩永楠, 葛鹏飞, 周伯乐, 2021. 中国市域技术创新与绿色发展耦合协调演变分异[J]. 经济地理, 41(6): 12-19.
DOI |
|
HAN Y N, GE P F, ZHOU B L, 2021. Evolution and differentiation of coupling coordination between technological innovation and green development in Chinese cities[J]. Economic Geography, 41(6): 12-19.
DOI |
|
| [15] |
郝智娟, 文琦, 施琳娜, 等, 2023. 黄河流域城市群社会经济与生态环境耦合协调空间网络分析[J]. 经济地理, 43(12): 181-191.
DOI |
|
HAO Z J, WEN Q, SHI L N, et al., 2023. Spatial Network Analysis of Coupling Coordination Between Social Economy and Eco-Environment in Yellow River Basin Urban Agglomerations[J]. Economic Geography, 43(12): 181-191.
DOI |
|
| [16] | 洪银兴, 2013. 论创新驱动经济发展战略[J]. 经济学家, 25(1): 5-11. |
| HONG Y X, 2013. On the innovation-driven economic development[J]. Economist, 25(1): 5-11. | |
| [17] | 李嘉程, 李晟, 郑卫民, 等, 2025. 基于MSPA-InVEST模型的长株潭城市群生态网络演变研究[J]. 中国环境科学, 45(10): 5769-5783. |
| LI J C, LI S, ZHENG W M, et al., 2025. Evolution of Ecological Networks in the Chang-Zhu-Tan Urban Agglomeration: An MSPA-InVEST Model-Based Approach[J]. China Environmental Science, 45(10): 5769-5783. | |
| [18] |
李喆, 陈圣宾, 陈芝阳, 2022. 地表温度与土地利用类型间的空间尺度依赖性——以成都为例[J]. 生态环境学报, 31(5): 999-1007.
DOI |
| LI Z, CHEN S B, CHEN Z Y, 2022. Spatial scale dependence between land surface temperature and land use types: A case study of Chengdu city[J]. Ecology and Environmental Sciences, 31(5): 999-1007. | |
| [19] | 庞博, 傅尧, 李晓星, 等, 2024. 黄河流域数字经济-技术创新-生态环境协整分析[J]. 人民黄河, 46(11): 15-21. |
| PANG B, FU Y, LI X X, et al., 2024. Co-integration analysis of digital economy-technological innovation-ecological environment in the Yellow River Basin[J]. Yellow Rive, 46(11): 15-21. | |
| [20] | 唐未兵, 傅元海, 王展祥, 2014. 技术创新、技术引进与经济增长方式转变[J]. 经济研究, 49(7): 31-43. |
| TANG W B, FU Y H, WANG Z X, 2014. Technology innovation, technology introduction and transformation of economic growth pattern[J]. Economic Research Journal, 49(7): 31-43. | |
| [21] |
陶德凯, 张子建, 2025. 江苏省国土空间绿色发展水平与生态系统服务耦合协同关系研究[J]. 生态环境学报, 34(2): 181-196.
DOI |
| TAO D K, ZHANG Z J, 2025. A study on the coupling and synergistic relationship between the level of territorial space green development and ecosystem services in Jiangsu province[J]. Ecology and Environmental Sciences, 34(2): 181-196. | |
| [22] | 汪阳昕, 巫强, 曹长帅, 2025. 科技创新如何推动区域现代化——来自长三角城市的证据[J]. 华东经济管理, 39(7): 35-46. |
| WANG Y X, WU Q, CAO C S, 2025. How Scientific and Technological Innovation Drives Regional Modernization: Evidence from Yangtze River Delta cities[J]. East China Economic Management, 39(7): 35-46. | |
| [23] |
王建康, 韩倩, 2021. 中国城市经济-社会-环境耦合协调的时空格局[J]. 经济地理, 41(5): 193-203.
DOI |
|
WANG J K, HAN Q, 2021. Spatial-temporal pattern of the coupling coordination of urban economy-society-environment in China[J]. Economic Geography, 41(5): 193-203.
DOI |
|
| [24] | 王凌青, 王雪平, 方华军, 等, 2021. 青藏高原典型区域资源环境与社会经济耦合分析[J]. 环境科学学报, 41(6): 2510-2518. |
| WANG L Q, WANG X P, FANG H J, et al., 2021. Coupling relationship between resource environment and social economy development in typical regions of Qinghai-Tibet Plateau[J]. Acta Scientiae Circumstantiae, 41(6): 2510-2518. | |
| [25] | 伍文生, 胡艳, 朱晓莉, 2024. 长江经济带科技创新、经济发展与生态环境的耦合协调及时空演化[J]. 统计与决策, 40(23): 132-137. |
| WU W S, HU Y, ZHU X L, 2024. The coupling coordination and spatio-temporal evolution of scientific and technological innovation, economic development and ecological environment in the Yangtze River Economic Belt[J]. Statistics & Decision, 40(23): 132-137. | |
| [26] | 余泳泽, 孙鹏博, 宣烨, 2020. 地方政府环境目标约束是否影响了产业转型升级?[J]. 经济研究, 55(8): 57-72. |
| YU Y Z, SUN P B, XUAN Y, 2020. Do constraints on local governments’ environmental targets affect industrial transformation and upgrading?[J]. Economic Research Journal, 55(8): 57-72. | |
| [27] |
曾鹏, 尚玲杰, 2024. 中国市域科技创新与实体经济融合水平分析及其时空特征[J]. 经济地理, 44(4): 110-120.
DOI |
|
ZENG P, SHANG L J, 2024. Integration level between technology innovation and the real economy and its spatio-temporal characteristics in China at the prefecture level[J]. Economic Geography, 44(4): 110-120.
DOI |
|
| [28] | 张贵, 孙建华, 2024. 京津冀协同创新共同体的生成机理、评价及对策——基于生态视角的区域创新新解释[J]. 城市问题, 43(2): 18-27. |
| ZHANG G, SUN J H, 2024. Generation mechanism, evaluation and countermeasures of Beijing-Tianjin-Hebei collaborative innovation community: A new interpretation of regional innovation based on ecological perspective[J]. Urban Problems, 43(2): 18-27. | |
| [29] | 张鹏, 李小红, 2025. 创新生态系统理论视域下首发经济的驱动机理与推进路径研究[J]. 中国软科学, 40(6): 88-98. |
| ZHANG P, LI X H, 2025. Study on the driving mechanism and promotion pathways of the China’s debut economy from the perspective of innovation ecosystem theory[J]. China Soft Science, 40(6): 88-98. | |
| [30] | 周成, 冯学钢, 唐睿, 2016. 区域经济-生态环境-旅游产业耦合协调发展分析与预测——以长江经济带沿线各省市为例[J]. 经济地理, 36(3): 186-193. |
| ZHOU C, FENG X G, TANG R, 2016. Analysis and forecast of coupling coordination development among the regional economy-ecological environment-tourism industry: A case study of provinces along the Yangtze Economic Zone[J]. Economic Geography, 36(3): 186-193. |
| [1] | CHENG Chuanpeng, XU Mingjie, LIU Huifeng. Effects of Thinning on Carbon Dynamics and Economic Value of Carbon Fixation in Subtropical Pinus massoniana Plantation [J]. Ecology and Environmental Sciences, 2022, 31(8): 1499-1509. |
| Viewed | ||||||
|
Full text |
|
|||||
|
Abstract |
|
|||||
Copyright © 2021 Editorial Office of ACTA PETROLEI SINICA
Address:No. 6 Liupukang Street, Xicheng District, Beijing, P.R.China, 510650
Tel: 86-010-62067128, 86-010-62067137, 86-010-62067139
Fax: 86-10-62067130
Email: syxb@cnpc.com.cn
Support byBeijing Magtech Co.ltd, E-mail:support@magtech.com.cn