Ecology and Environmental Sciences ›› 2025, Vol. 34 ›› Issue (10): 1609-1617.DOI: 10.16258/j.cnki.1674-5906.2025.10.011
• Research Article [Environmental Science] • Previous Articles Next Articles
WANG Gongbin1,2( ), HUA Lizhong1,2,*(), LU Xuan1,2, LI Lin1,2, ZHANG Xinxin1, LI Lanhui1,2
Received:2025-03-24
Online:2025-10-18
Published:2025-09-26
王恭斌1,2(), 花利忠1,2,*(), 卢璇1,2, 李琳1,2, 章欣欣1, 李兰晖1,2
通讯作者:
E-mail: 作者简介:王恭斌(1997年生),男,硕士研究生,主要从事城市热环境研究。E-mail: 13023909076@163.com
基金资助:CLC Number:
WANG Gongbin, HUA Lizhong, LU Xuan, LI Lin, ZHANG Xinxin, LI Lanhui. Spatiotemporal Patterns and Drivers of Summer Urban Heat Islands in Chinese Cities (2003-2022): A Multi-Climate Zone Analysis Using Remote Sensing and Machine Learning[J]. Ecology and Environmental Sciences, 2025, 34(10): 1609-1617.
王恭斌, 花利忠, 卢璇, 李琳, 章欣欣, 李兰晖. 基于遥感与机器学习的中国城市夏季热岛气候带分异特征(2003-2022年)及其驱动因子分析[J]. 生态环境学报, 2025, 34(10): 1609-1617.
Add to citation manager EndNote|Ris|BibTeX
URL: https://www.jeesci.com/EN/10.16258/j.cnki.1674-5906.2025.10.011
| 气候类型 | 城市 | 数量 |
|---|---|---|
| 暖温带 | 成都,重庆,贵阳,南宁,广州,长沙,南昌,福州,杭州,上海,武汉,合肥,南京,郑州,泉州,漳州,佛山,东莞,宁波,温州,扬州,徐州,蚌埠,平顶山,襄阳,赣州,衡阳,柳州,西安,运城,开封,金华 | 32 |
| 冷温带 | 沈阳,长春,济南,大庆,鞍山,临沂,齐齐哈尔,唐山,吉林,阜新,锦州,牡丹江,鹤岗,抚顺,秦皇岛,哈尔滨, 天津,北京,通辽,赤峰,保定,衡水,石家庄,临汾,邢台,邯郸 | 26 |
| 干带 | 兰州,银川,太原,大同,包头,乌鲁木齐,呼和浩特 | 7 |
Table 1 Classification of cities in different climate zones
| 气候类型 | 城市 | 数量 |
|---|---|---|
| 暖温带 | 成都,重庆,贵阳,南宁,广州,长沙,南昌,福州,杭州,上海,武汉,合肥,南京,郑州,泉州,漳州,佛山,东莞,宁波,温州,扬州,徐州,蚌埠,平顶山,襄阳,赣州,衡阳,柳州,西安,运城,开封,金华 | 32 |
| 冷温带 | 沈阳,长春,济南,大庆,鞍山,临沂,齐齐哈尔,唐山,吉林,阜新,锦州,牡丹江,鹤岗,抚顺,秦皇岛,哈尔滨, 天津,北京,通辽,赤峰,保定,衡水,石家庄,临汾,邢台,邯郸 | 26 |
| 干带 | 兰州,银川,太原,大同,包头,乌鲁木齐,呼和浩特 | 7 |
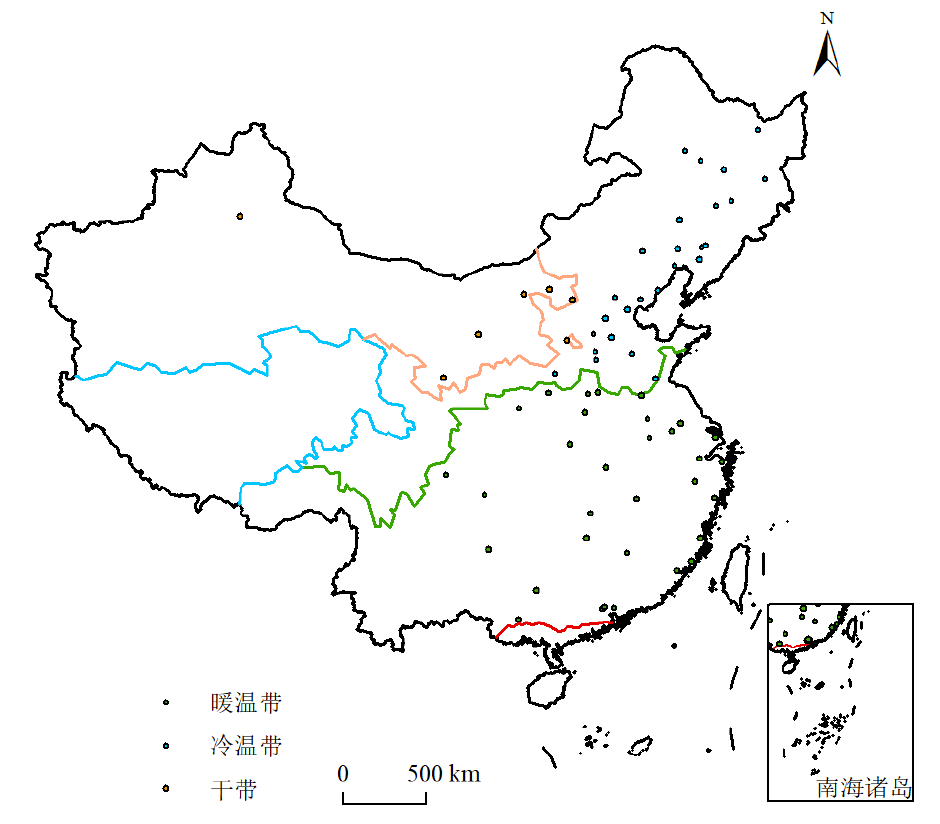
Figure 1 Schematic diagram of the division of China’s climate zones and selection of corresponding cities
| 名称 | 类型 | 空间 分辨率 | 来源 | 时间范围 |
|---|---|---|---|---|
| 城市边界 | 矢量 | - | 自然资源部标准地图 | 2020 |
| 土地利用数据集 | 栅格 | 30 m | https://zenodo.org/ | 2003-2022 |
| 地表温度数据 | 栅格 | 1 km | MYD11A2 | 2003-2022 |
| 增强植被指数 | 栅格 | 1 km | MOD13A2 | 2003-2022 |
| 蒸散发 | 栅格 | 1 km | MOD16A2 | 2003-2022 |
| 夜间灯光指数 | 栅格 | 1 km | DMSP/OLS | 2003-2012 |
| 栅格 | 500 m | NPP/VIIRS | 2013-2022 | |
| 高程 | 栅格 | 90 m | SRTM | |
| 人口数据集 | 栅格 | 1 km | 国家统计年鉴 | 2003-2022 |
| 气溶胶光学厚度 | 栅格 | 1 km | MCD19A2_ GRANULES | 2003-2022 |
| 降水量 | 栅格 | 5.6 km | UCSB-CHG | 2003-2022 |
| 白空反照率 | 栅格 | 500 m | MCD43A3 | 2003-2022 |
Table 2 Data sources
| 名称 | 类型 | 空间 分辨率 | 来源 | 时间范围 |
|---|---|---|---|---|
| 城市边界 | 矢量 | - | 自然资源部标准地图 | 2020 |
| 土地利用数据集 | 栅格 | 30 m | https://zenodo.org/ | 2003-2022 |
| 地表温度数据 | 栅格 | 1 km | MYD11A2 | 2003-2022 |
| 增强植被指数 | 栅格 | 1 km | MOD13A2 | 2003-2022 |
| 蒸散发 | 栅格 | 1 km | MOD16A2 | 2003-2022 |
| 夜间灯光指数 | 栅格 | 1 km | DMSP/OLS | 2003-2012 |
| 栅格 | 500 m | NPP/VIIRS | 2013-2022 | |
| 高程 | 栅格 | 90 m | SRTM | |
| 人口数据集 | 栅格 | 1 km | 国家统计年鉴 | 2003-2022 |
| 气溶胶光学厚度 | 栅格 | 1 km | MCD19A2_ GRANULES | 2003-2022 |
| 降水量 | 栅格 | 5.6 km | UCSB-CHG | 2003-2022 |
| 白空反照率 | 栅格 | 500 m | MCD43A3 | 2003-2022 |
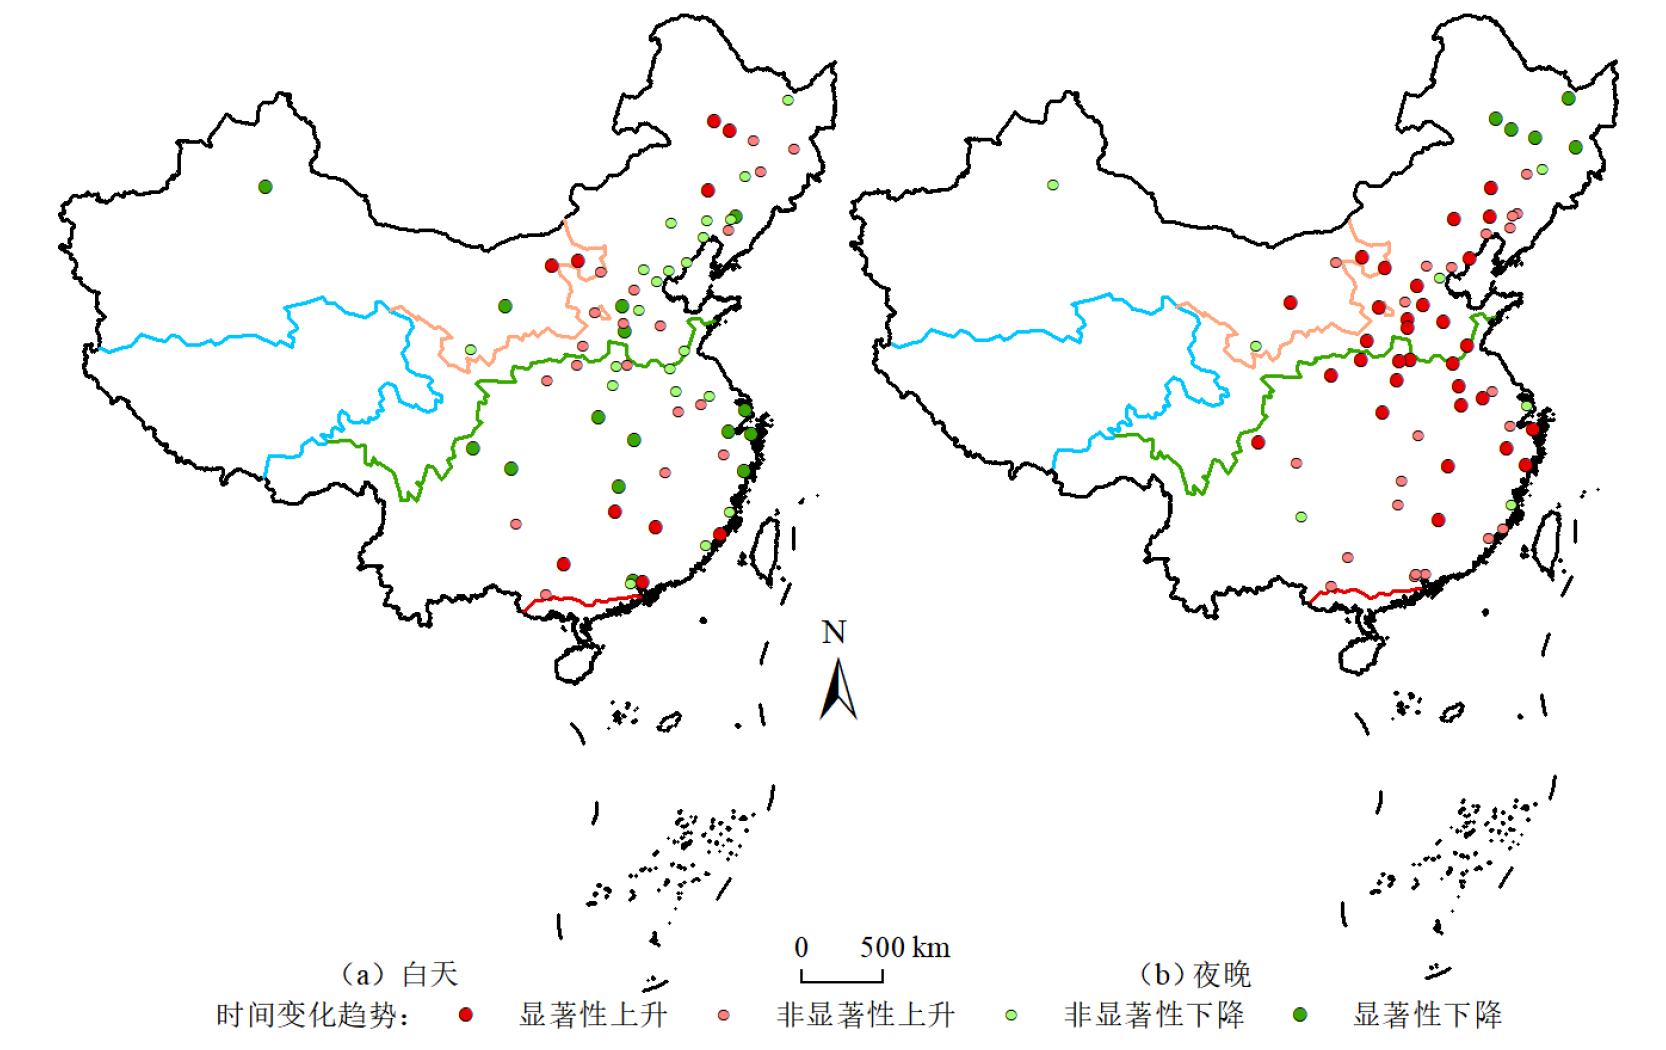
Figure 2 Spatial distribution of annual mean daytime and nighttime SUHII in different climate zones in China, 2003-2022 (summer)
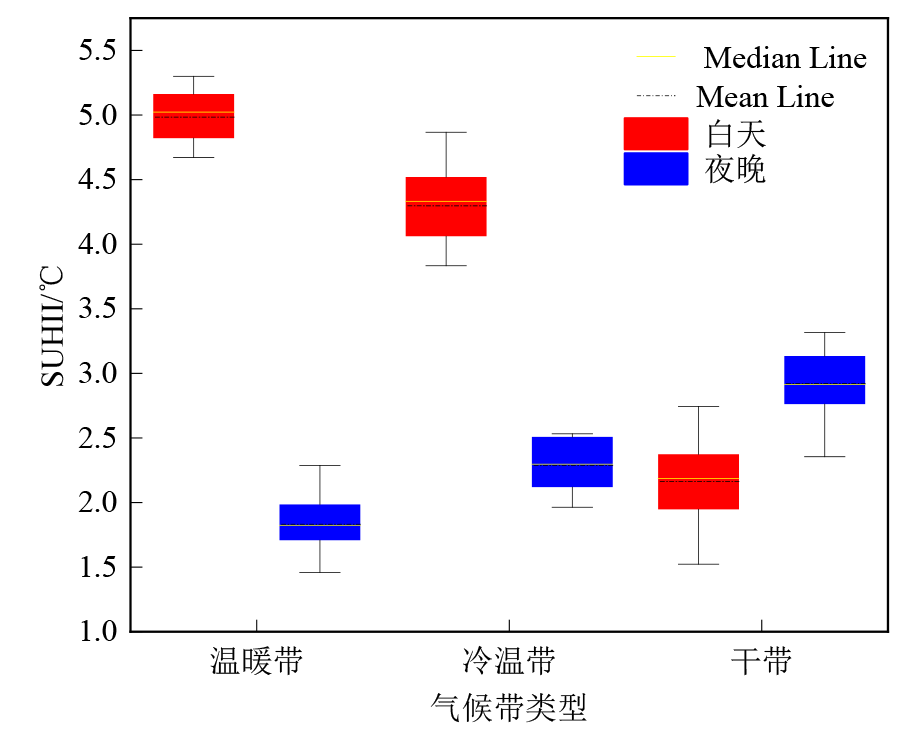
Figure 3 Comparison of summer annual mean SUHII across different climate zones in China
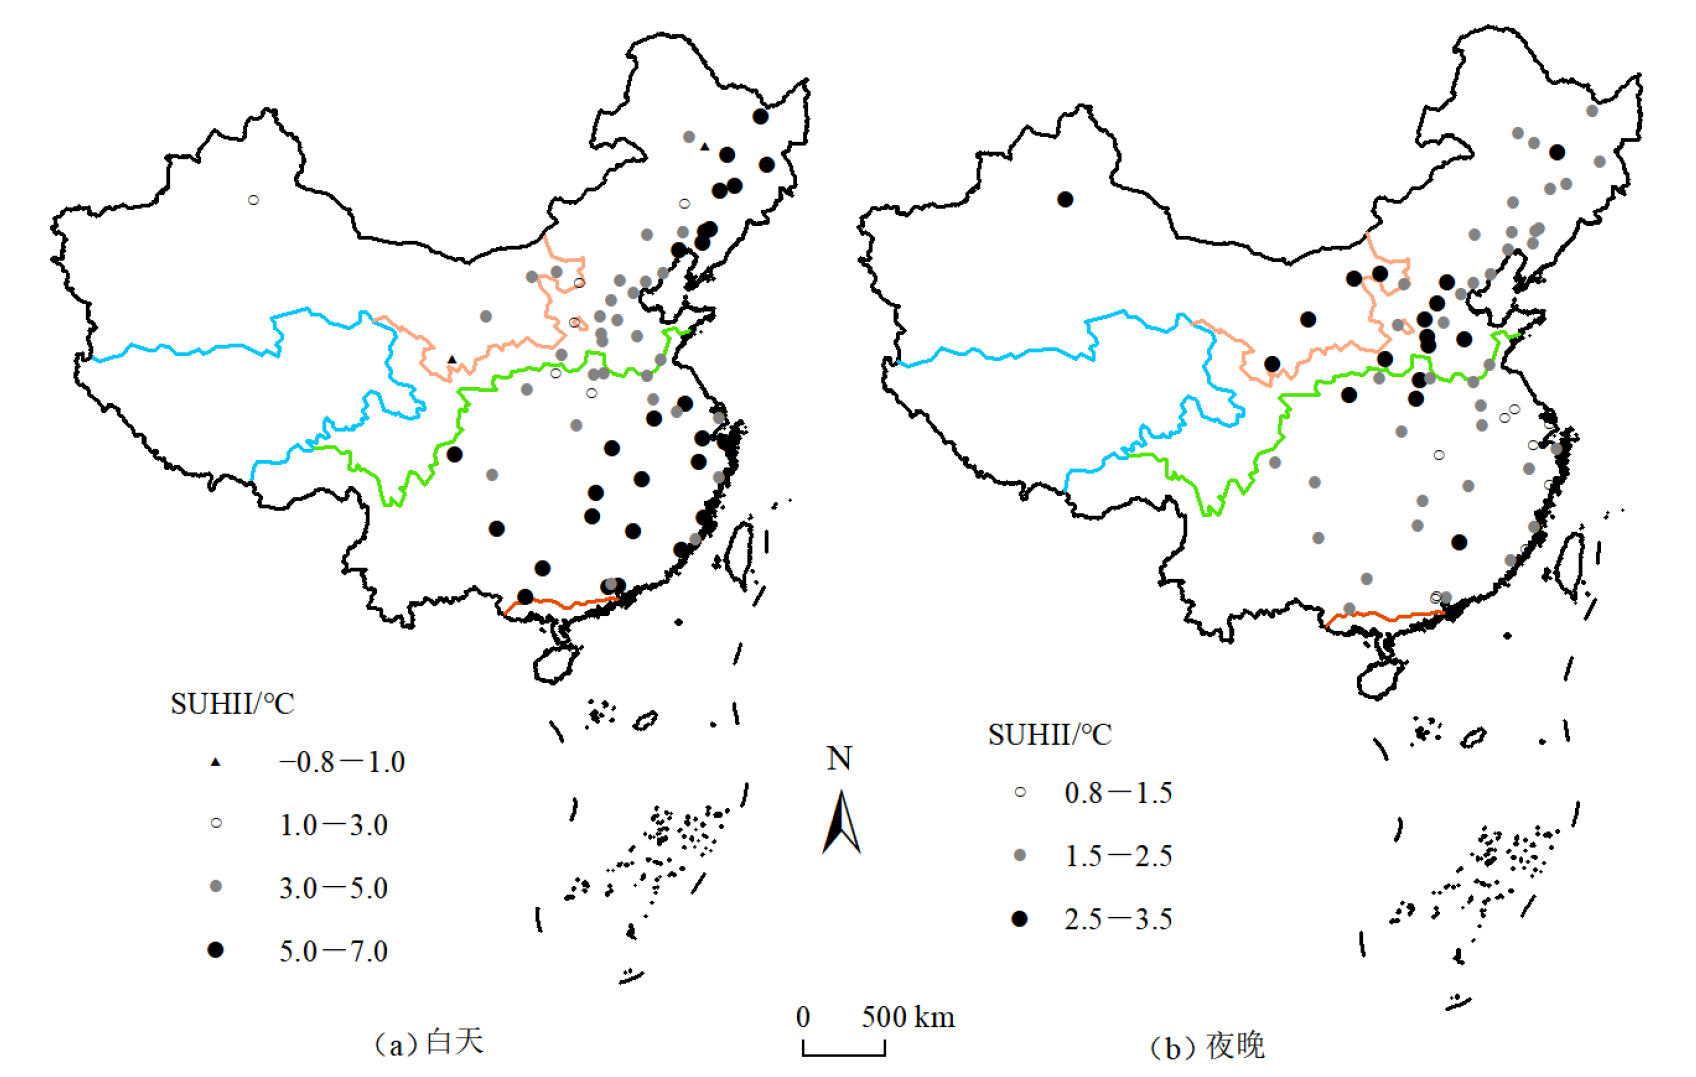
Figure 4 Temporal trends of daytime and nighttime SUHII across three K?ppen climate zones in China, 2003-2022 (Summer)
| 时间 | 显著上升 | 非显著上升 | 非显著下降 | 显著下降 |
|---|---|---|---|---|
| 白天 | 15 | 29 | 32 | 24 |
| 夜晚 | 48 | 34 | 11 | 7 |
Table 3 Summary of SUHII change trends across China in summer %
| 时间 | 显著上升 | 非显著上升 | 非显著下降 | 显著下降 |
|---|---|---|---|---|
| 白天 | 15 | 29 | 32 | 24 |
| 夜晚 | 48 | 34 | 11 | 7 |
| 气候带 | 白天 | 夜晚 | |||
|---|---|---|---|---|---|
| R2 | RMSE | R2 | RMSE | ||
| 暖温带(n=32) | 0.91 | 0.40 | 0.90 | 0.22 | |
| 冷温带(n=26) | 0.91 | 0.41 | 0.88 | 0.14 | |
| 干带(n=7) | 0.89 | 0.56 | 0.73 | 0.19 | |
| 均值 | 0.90 | 0.46 | 0.84 | 0.18 | |
Table 4 R2 and root mean square error (RMSE) of the random forest model regression results
| 气候带 | 白天 | 夜晚 | |||
|---|---|---|---|---|---|
| R2 | RMSE | R2 | RMSE | ||
| 暖温带(n=32) | 0.91 | 0.40 | 0.90 | 0.22 | |
| 冷温带(n=26) | 0.91 | 0.41 | 0.88 | 0.14 | |
| 干带(n=7) | 0.89 | 0.56 | 0.73 | 0.19 | |
| 均值 | 0.90 | 0.46 | 0.84 | 0.18 | |
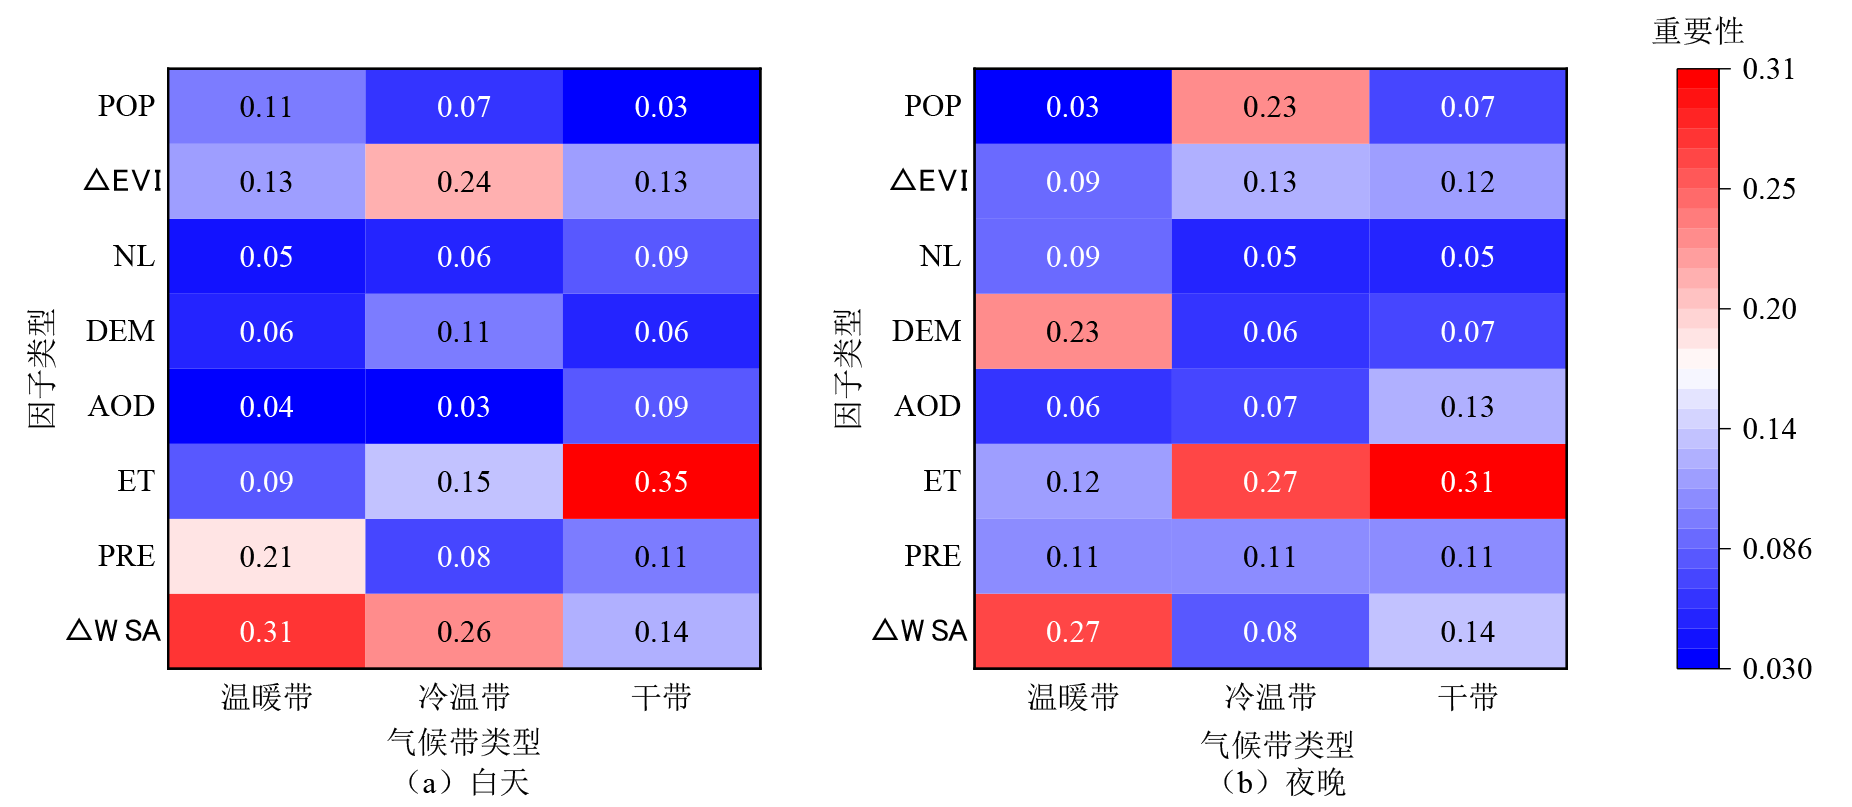
Figure 5 Importance of influencing factors for daytime and nighttime SUHII in different climate zones
| 驱动 因子 | 白天 | 夜晚 | |||||
|---|---|---|---|---|---|---|---|
| 暖温带 | 冷温带 | 干带 | 暖温带 | 冷温带 | 干带 | ||
| POP | −0.28 | −0.10 | 0.16 | 0.03 | 0.65** | −0.23 | |
| △EVI | −0.45** | −0.76** | −0.54** | −0.57* | 0.28 | 0.43 | |
| NL | 0.03 | −0.12 | 0.47 | −0.38 | 0.19 | −0.25 | |
| DEM | −0.12 | −0.33 | 0 | −0.46** | 0.33 | 0.22 | |
| AOD | −0.04 | −0.13 | −0.44 | −0.06 | −0.35 | −0.04 | |
| ET | 0.56** | 0.76** | 0.11 | 0.06 | 0.08 | −0.37 | |
| PRE | 0.46** | 0.17 | 0.43 | 0.43* | 0.39 | −0.32 | |
| △WSA | −0.49** | −0.58** | −0.54** | −0.39 | −0.42 | 0.46 | |
Table 5 Correlations between daytime/nighttime SUHII and driving factors in summer climate zones of China
| 驱动 因子 | 白天 | 夜晚 | |||||
|---|---|---|---|---|---|---|---|
| 暖温带 | 冷温带 | 干带 | 暖温带 | 冷温带 | 干带 | ||
| POP | −0.28 | −0.10 | 0.16 | 0.03 | 0.65** | −0.23 | |
| △EVI | −0.45** | −0.76** | −0.54** | −0.57* | 0.28 | 0.43 | |
| NL | 0.03 | −0.12 | 0.47 | −0.38 | 0.19 | −0.25 | |
| DEM | −0.12 | −0.33 | 0 | −0.46** | 0.33 | 0.22 | |
| AOD | −0.04 | −0.13 | −0.44 | −0.06 | −0.35 | −0.04 | |
| ET | 0.56** | 0.76** | 0.11 | 0.06 | 0.08 | −0.37 | |
| PRE | 0.46** | 0.17 | 0.43 | 0.43* | 0.39 | −0.32 | |
| △WSA | −0.49** | −0.58** | −0.54** | −0.39 | −0.42 | 0.46 | |
| 作者 | 城市数量 | 时间范围 | 时间变化 | 空间变化 | 主要驱动因子 |
|---|---|---|---|---|---|
| 王恭斌等(本研究) | 65 | 2003-2022 | 夏季白天SUHII以下降趋势为主,夜间以增加趋势为主 | 夏季白天SUHII在暖温带和冷温带较高,在干旱带城市较低;夜间SUHII相反 | 昼夜SUHII由△WSA主要影响,不同气候带的其他主要影响因子不同 |
| Zhou et al., | 32 | 2003-2011 | - | 中国东南部白天SUHII较高,北部夜间SUHII较高 | 夏季白天SUHII受夜间灯光主导,夜晚受△WSA主导 |
| 曹畅等, | 39 | 2003-2013 | - | 白天SUHII在半湿润区城市较高,夜间SUHII在半干旱/干旱区城市较高 | 夏季白天SUHII由农田像元比例主导,夜晚由△WSA差异主导 |
| 刘宇翔等, | 332 | 2003-2019 | 大部分城市昼夜SUHII呈上升趋势;夏季白天上升趋势城市数量高于夜晚 | 白天SUHII在热带、亚热带及温带的东部城市较高,夜间SUHII在中温带较高 | - |
| Geng et al., | 253 | 2001-2020 | 大部分城市昼夜SUHII呈上升趋势;白天显著上升趋势分布在南亚热带、中亚热带和北亚热带且占比逐渐增加,夜晚则分布在南温带 | 白天SUHII在南亚热带城市较高,夜间SUHII在南温带较高 | 不同气候带昼夜SUHII皆由城市面积主导,不同气候带及季节的其他主要驱动因子不同 |
Table 6 Comparison between the study and previous studies on SUHII
| 作者 | 城市数量 | 时间范围 | 时间变化 | 空间变化 | 主要驱动因子 |
|---|---|---|---|---|---|
| 王恭斌等(本研究) | 65 | 2003-2022 | 夏季白天SUHII以下降趋势为主,夜间以增加趋势为主 | 夏季白天SUHII在暖温带和冷温带较高,在干旱带城市较低;夜间SUHII相反 | 昼夜SUHII由△WSA主要影响,不同气候带的其他主要影响因子不同 |
| Zhou et al., | 32 | 2003-2011 | - | 中国东南部白天SUHII较高,北部夜间SUHII较高 | 夏季白天SUHII受夜间灯光主导,夜晚受△WSA主导 |
| 曹畅等, | 39 | 2003-2013 | - | 白天SUHII在半湿润区城市较高,夜间SUHII在半干旱/干旱区城市较高 | 夏季白天SUHII由农田像元比例主导,夜晚由△WSA差异主导 |
| 刘宇翔等, | 332 | 2003-2019 | 大部分城市昼夜SUHII呈上升趋势;夏季白天上升趋势城市数量高于夜晚 | 白天SUHII在热带、亚热带及温带的东部城市较高,夜间SUHII在中温带较高 | - |
| Geng et al., | 253 | 2001-2020 | 大部分城市昼夜SUHII呈上升趋势;白天显著上升趋势分布在南亚热带、中亚热带和北亚热带且占比逐渐增加,夜晚则分布在南温带 | 白天SUHII在南亚热带城市较高,夜间SUHII在南温带较高 | 不同气候带昼夜SUHII皆由城市面积主导,不同气候带及季节的其他主要驱动因子不同 |
| [1] | BECK H E, MCVICAR T R, VERGOPOLAN N, et al., 2023. High-resolution (1 km) Köppen-Geiger maps for 1901-2099 based on constrained CMIP6 projections[J]. Scientific Data, 10(1): 724. |
| [2] | DOS SANTOS A R, DE OLIVEIRA F S, DA SILVA A G, et al., 2017. Spatial and temporal distribution of urban heat islands[J]. Science of the Total Environment, 605-606: 946-956. |
| [3] | GENG X L, ZHANG D, LI C W, et al., 2023. Impacts of climatic zones on urban heat island: Spatiotemporal variations, trends, and drivers in China from 2001-2020[J]. Sustainable Cities and Society, 89: 104303. |
| [4] | HAN D L, ZHANG T T, QIN Y X, et al., 2022. A comparative review on the mitigation strategies of urban heat island (UHI): A pathway for sustainable urban development[J]. Climate and Development, 15(5): 379-403. |
| [5] | KIM H, GU D, KIM H Y, 2018. Effects of urban heat island mitigation in various climate zones in the United States[J]. Sustainable Cities and Society, 41: 841-852. |
| [6] | LI H D, ZHOU Y Y, LI X M, et al., 2018. A new method to quantify surface urban heat island intensity[J]. Science of The Total Environment, 624: 262-272. |
| [7] | LI K N, CHEN Y H, JIANG J B, 2023. Grading surface urban heat island and investigating factor weight based on interpretable deep learning model across global cities[J]. Environment International., 180: 108196. |
| [8] | LI L, ZHA Y, ZHANG J H, 2020. Spatially non-stationary effect of underlying driving factors on surface urban heat islands in global major cities[J]. International Journal of Applied Earth Observation and Geoinformation, 90: 102131. |
| [9] | LI X M, ZHOU Y Y, ASRAR G R, et al., 2017. The surface urban heat island response to urban expansion: A panel analysis for the conterminous United States[J]. Science of the Total Environment, 605-606: 426-435. |
| [10] | LIU F, LIU J, ZHANG Y Q, et al., 2024. Construction of a cold island network for the urban heat island effect mitigation[J]. Science of the Total Environment, 915: 169950. |
| [11] | OKE T R, 1982. The energetic basis of the urban heat island[J]. Quarterly Journal of the Royal Meteorological Society, 108(455): 1-24. |
| [12] | O'MALLEY C, KIKUMOTO H, 2022. An investigation into heat storage by adopting local climate zones and nocturnal-diurnal urban heat island differences in the Tokyo Prefecture[J]. Sustainable Cities and Society, 83: 103959. |
| [13] | PENG X X, ZHOU Y Y, FU X H, et al., 2022. Study on the spatial-temporal pattern and evolution of surface urban heat island in 180 shrinking cities in China[J]. Sustainable Cities and Society, 84: 104018. |
| [14] | RINCHUMPHU D, SRIVANIT M, IAMCHUEN N, et al., 2024. Exploring summer variations of driving factors affecting land use zoning based on the surface urban heat island in Chiang Mai, Thailand[J]. ISPRS International Journal of Geo-Information, 13(7): 228. |
| [15] | SHE Y H, LIU Z H, ZHAN W F, et al., 2022. Strong regulation of daily variations in nighttime surface urban heat islands by meteorological variables across global cities[J]. Environmental Research Letters, 17(1): 14049. |
| [16] | WAN Y, DU H, YUAN L, et al., 2025. Exploring the influence of block environmental characteristics on land surface temperature and its spatial heterogeneity for a high-density city[J]. Sustainable Cities and Society, 118: 105973. |
| [17] | WANG L Q, DE BOECK H J, CHEN L X, et al., 2022. Urban warming increases the temperature sensitivity of spring vegetation phenology at 292 cities across China[J]. Science of the Total Environment, 834: 155154. |
| [18] | XIE P Y, WANG H, 2021. Potential benefit of photovoltaic pavement for mitigation of urban heat island effect[J]. Applied Thermal Engineering, 191: 116883. |
| [19] | YANG J, HUANG X, 2021. The 30 m annual land cover dataset and its dynamics in China from 1990 to 2019[J]. Earth System Science Data, 13(8): 3907-3925. |
| [20] | YAO R, WANG L C, HUANG X, et al., 2019. Greening in rural areas increases the surface urban heat island intensity[J]. Geophysical Research Letters, 46(4): 2204-2212. |
| [21] | ZHOU D C, ZHAO S Q, LIU S G, et al., 2014. Surface urban heat island in China’s 32 major cities: Spatial patterns and drivers[J]. Remote Sensing of Environment, 152: 51-61. |
| [22] | 曹畅, 李旭辉, 张弥, 等, 2017. 中国城市热岛时空特征及其影响因子的分析[J]. 环境科学, 38(10): 3987-3997. |
| CAO C, LI X H, ZHANG M, et al., 2017. Analysis of the spatiotemporal characteristics and influencing factors of urban heat islands in China[J]. Environmental Science, 38(10): 3987-3997. | |
| [23] | 侯赛男, 党国锋, 2022. 机器学习模拟热环境及热岛时空变化特征研究[J]. 测绘科学, 47(9): 200-207. |
| HOU S N, DANG G F, 2022. Research on machine learning simulation of thermal environment and spatiotemporal variation characteristics of heat islands[J]. Science of Surveying and Mapping, 47(9): 200-207. | |
| [24] | 贾文茜, 任国玉, 于秀晶, 等, 2021. 中国东部季风区不同气候带城市热岛效应的差异[J]. 气候与环境研究, 26(5): 569-582. |
| JIA W Q, REN G Y, YU X J, et al., 2021. Differences in urban heat island effects among different climate zones in the eastern monsoon region of China[J]. Climatic and Environmental Research, 26(5): 569-582. | |
| [25] |
刘宇翔, 杨英宝, 胡佳, 等, 2022. 基于长时序MODIS数据的中国城市昼夜热岛强度时空特征[J]. 地球信息科学学报, 24(5): 981-995.
DOI |
| LIU Y X, YANG Y B, HU J, et al., 2022. Spatiotemporal characteristics of daytime and nighttime urban heat island intensity in China based on long-term MODIS data[J]. Journal of Geo-information Science, 24(5): 981-995. | |
| [26] | 孙艳伟, 王润, 郭青海, 等, 2021. 基于人居尺度的中国城市热岛强度时空变化及其驱动因子解析[J]. 环境科学, 42(1): 501-512. |
| SUN Y W, WANG R, GUO Q H, et al., 2021. Analysis of spatiotemporal variation and driving factors of urban heat island intensity in China based on human settlement scale[J]. Environmental Science, 42(1): 501-512. | |
| [27] |
孙喆, 2020. 高密度城区形态要素对热环境的影响作用——以北京市五环内区域为例[J]. 生态环境学报, 29(10): 2020-2027.
DOI |
| SUN Z, 2020. Impact of urban morphology factors on thermal environment in high density urban areas: A case of Beijing within 5th ring road[J]. Journal of Ecology and Environment, 29(10): 2020-2027. | |
| [28] |
王嘉丽, 冯婧珂, 杨元征, 等, 2023. 南宁市主城区不透水面与热环境效应的空间关系研究[J]. 生态环境学报, 32(3): 525-534.
DOI |
| WANG J L, FENG J K, YANG Y Z, et al., 2023. Research on spatial relations between impervious surfaces and the urban thermal environment in the central metropolitan area of Nanning city[J]. Journal of Ecology and Environment, 32(3): 525-534. | |
| [29] |
王美雅, 徐涵秋, 2018. 中国大城市的城市组成对城市热岛强度的影响研究[J]. 地球信息科学学报, 20(12): 1787-1798.
DOI |
| WANG M Y, XU H Q, 2018. Research on the impact of urban composition on urban heat island intensity in large cities in China[J]. Journal of Geo-information Science, 20(12): 1787-1798. | |
| [30] | 王阳, 孙然好, 2021. 区域气候背景对城市热岛效应的影响规律[J]. 生态学报, 41(11): 4288-4299. |
| WANG Y, SUN R H, 2021. The Influence of regional climate background on urban heat island effects[J]. Acta Ecologica Sinica, 41(11): 4288-4299. |
| [1] | WU Xiyan, LI Weijun, KA Nate, PENG Yujie. Analysis of China’s Continuous Temporal xCO2 Change in 2023 Based on Random Forest and OCO-2 Remote Sensing Data [J]. Ecology and Environmental Sciences, 2025, 34(9): 1341-1350. |
| [2] | ZHANG Shengbo, WU Zuohang, DANG Haofei, LIAO Kuo, LU Dengsheng, LI Dengqiu. The Response and Differences of Different Remote Sensing Vegetation Indices to Extreme Climate Events in the Wuyi Mountain Region over the Last 20 Years [J]. Ecology and Environmental Sciences, 2025, 34(8): 1240-1254. |
| [3] | QI Xun, FENG Xinxin, CHEN Yingjun, FENG Yanli, CHEN Tian, LI Jun, ZHANG Gan. Emission Characteristics and Influence Factors of NH3 and Amines in Particulate Matter Emitted by Light-duty Gasoline Trucks [J]. Ecology and Environmental Sciences, 2025, 34(7): 997-1006. |
| [4] | ZHANG Dandan, WU Zhenhai, WU Ke, BI Fang, LI Yunfeng, AN Cong, HAN Yixin, LIU Zhengyang, ZHU Ling, WANG Xuezhong. Characterization of Ozone Pollution and Influencing Factors Based on Different Types of Ozone Pollution Days: A Case Study in Bozhou City [J]. Ecology and Environmental Sciences, 2025, 34(5): 720-730. |
| [5] | GUO Zhao, SHI Yun, LIU Tieming, ZHANG Yuxin, YAN Yongzhi. Analysis of Spatiotemporal Patterns and Driving Factors of NPP on the Northern Slope of the Qinling Mountains from 2001 to 2020 [J]. Ecology and Environmental Sciences, 2025, 34(3): 401-410. |
| [6] | ZHAO Zhongbao, LI Jing, LIU Xiaodan, BAI Xiang, LIU Haoye, XU Xiaona, GENG Shigang, LU Shaobao. Studies on the Valuation of Forest Ecological Products and the Spatial Distribution Driving Factors in Hebei Province [J]. Ecology and Environmental Sciences, 2025, 34(2): 321-332. |
| [7] | LI Jianfu, HUANG Zhilin, HE Chengzhong, JIANG Xin, SONG Lin, LIU Jiaxin, CHEN Liding. Spatial Distribution and Key Factors Affecting Soil Organic Carbon Within the Karst Fault Basin in Eastern Yunnan, China [J]. Ecology and Environmental Sciences, 2024, 33(9): 1339-1352. |
| [8] | DAI Xiaoai, MA Jiaxin, TANG Yiling, LI Weile. Spatio-temporal Dynamics and Attribution Analysis of Vegetation in Gansu Province [J]. Ecology and Environmental Sciences, 2024, 33(8): 1163-1173. |
| [9] | LI Haiyan, YANG Tao, LIAO Yilin, QU Yajie. Analysis of Distribution Pattern and Driving Habitat Quality of Rivers in the Wei River Basin (Shaanxi section) [J]. Ecology and Environmental Sciences, 2024, 33(7): 1153-1162. |
| [10] | ZHANG Weichen, WANG Xingqi, WANG Bojie. Spatiotemporal Pattern and Influencing Factors of the Ecosystem Services in the Tabu River Basin [J]. Ecology and Environmental Sciences, 2024, 33(7): 1142-1152. |
| [11] | WANG Meinai, FAN Shunxiang, SHU Hanjun, ZHANG Jianjie, CHU Liqi, FA Yuqi. Spatio-temporal Variations in Soil Erosion and Its Economic Value of Soil Conservation in Henan Province [J]. Ecology and Environmental Sciences, 2024, 33(5): 730-744. |
| [12] | LI Rongjie, LI Huimei, WU Feifei, ZHAO mingde, WANG Shihan, SUN xueying. Study on the Spatial Differentiation Pattern and Driving Force of Ecosystem Services in Qinghai Lake Basin [J]. Ecology and Environmental Sciences, 2024, 33(2): 301-309. |
| [13] | LI Huiqiang, LIANG Xiaoying, WEI Zheng, ZHU Yongfei, SHI Jinxin. Driving Force Analysis of Ecosystem Service Bundle Change Based on Logistic Regression Model: A Case Study of Guantian Economic Zone [J]. Ecology and Environmental Sciences, 2024, 33(11): 1803-1815. |
| [14] | LUO Guangyu, WANG Zhiyuan. Research on the Carbon Storage Effect and Driving Factors of the Evolution of Territorial Space Pattern in Dongting Lake Ecological and Economic Zone [J]. Ecology and Environmental Sciences, 2024, 33(11): 1672-1685. |
| [15] | TIAN Jiali, MAO Jingyu, PENG Jiachao, YAO Tingting, FU Shuke. The Spatiotemporal Differentiation and Driving Factors of the Synergistic Effect of Pollution and Carbon Reduction in Heavily Polluting Enterprises: Evidence from 100 A-share Enterprises [J]. Ecology and Environmental Sciences, 2024, 33(11): 1661-1671. |
| Viewed | ||||||
|
Full text |
|
|||||
|
Abstract |
|
|||||
Copyright © 2021 Editorial Office of ACTA PETROLEI SINICA
Address:No. 6 Liupukang Street, Xicheng District, Beijing, P.R.China, 510650
Tel: 86-010-62067128, 86-010-62067137, 86-010-62067139
Fax: 86-10-62067130
Email: syxb@cnpc.com.cn
Support byBeijing Magtech Co.ltd, E-mail:support@magtech.com.cn