Ecology and Environment ›› 2024, Vol. 33 ›› Issue (11): 1661-1671.DOI: 10.16258/j.cnki.1674-5906.2024.11.001
• Papers on Carbon Cycling and Carbon Emission Reduction • Next Articles
TIAN Jiali1,2( ), MAO Jingyu1, PENG Jiachao1,2,3,4, YAO Tingting1,2,*(), FU Shuke1,2
Received:2024-08-30
Online:2024-11-18
Published:2024-12-06
Contact:
YAO Tingting
田嘉莉1,2(), 毛靖宇1, 彭甲超1,2,3,4, 姚婷婷1,2,*(), 付书科1,2
通讯作者:
姚婷婷
作者简介:田嘉莉(1990年生),女,副教授,博士,主要研究方向为环境经济。E-mail: tjl@wit.edu.cn
基金资助:CLC Number:
TIAN Jiali, MAO Jingyu, PENG Jiachao, YAO Tingting, FU Shuke. The Spatiotemporal Differentiation and Driving Factors of the Synergistic Effect of Pollution and Carbon Reduction in Heavily Polluting Enterprises: Evidence from 100 A-share Enterprises[J]. Ecology and Environment, 2024, 33(11): 1661-1671.
田嘉莉, 毛靖宇, 彭甲超, 姚婷婷, 付书科. 重污染企业减污降碳协同效应时空分异特征及其驱动因素分析——来自A股100家企业的证据[J]. 生态环境学报, 2024, 33(11): 1661-1671.
Add to citation manager EndNote|Ris|BibTeX
URL: https://www.jeesci.com/EN/10.16258/j.cnki.1674-5906.2024.11.001
| 变量类型 | 变量名称 | 变量符号 | 数据来源及处理方法 |
|---|---|---|---|
| 被解释变量 | 耦合协调度 | D | 来源于EPS上市公司数据库、中国工业企业污染排放数据库、上市公司社会责任报告和国泰安数据, 并利用耦合协调度模型计算获得。对未披露碳排的企业利用排放因子法进行估算; 参照毛捷等 ( |
| 核心解释变量 | 能源消耗总量 | TEC | 来源于上市公司企业社会责任报告、EPS上市公司数据库, 以及通过Python爬取整理的企业公开披露信息 |
| 控制变量 | 全要素生产率 | TFP | 使用LP方法 (朱沛华等, |
| 环保背景高管总数 | EP | 来源于新浪财经网站公布的上市公司高管个人简历信息 (王辉等, | |
| ESG表现 | ESG | 来源于Wind数据库 | |
| 绿色技术创新 | Green | 利用中国研究数据服务平台提供的企业绿色专利申请数量 (Gong et al., | |
| 利润总额 | TP | 来源于上市公司年报 | |
| 固定资产净额 | Net | 来源于上市公司年报,对于缺失值采用插值法处理 (李云燕等, | |
| 调节变量 | 环境规制强度 | EI | 采用重污染企业所在地区当年用于污染治理的金额占该年度工业产值的比值来表示 |
| 公众环境关注度 | BI | 在百度搜索引擎中检索关键词, 采用Python爬取2008-2022年间公众对 “环境污染” 和 “雾霾” 等词条的日均搜索量, 并将其加总后加一取自然对数 (Chen et al., |
Table 1 Data description
| 变量类型 | 变量名称 | 变量符号 | 数据来源及处理方法 |
|---|---|---|---|
| 被解释变量 | 耦合协调度 | D | 来源于EPS上市公司数据库、中国工业企业污染排放数据库、上市公司社会责任报告和国泰安数据, 并利用耦合协调度模型计算获得。对未披露碳排的企业利用排放因子法进行估算; 参照毛捷等 ( |
| 核心解释变量 | 能源消耗总量 | TEC | 来源于上市公司企业社会责任报告、EPS上市公司数据库, 以及通过Python爬取整理的企业公开披露信息 |
| 控制变量 | 全要素生产率 | TFP | 使用LP方法 (朱沛华等, |
| 环保背景高管总数 | EP | 来源于新浪财经网站公布的上市公司高管个人简历信息 (王辉等, | |
| ESG表现 | ESG | 来源于Wind数据库 | |
| 绿色技术创新 | Green | 利用中国研究数据服务平台提供的企业绿色专利申请数量 (Gong et al., | |
| 利润总额 | TP | 来源于上市公司年报 | |
| 固定资产净额 | Net | 来源于上市公司年报,对于缺失值采用插值法处理 (李云燕等, | |
| 调节变量 | 环境规制强度 | EI | 采用重污染企业所在地区当年用于污染治理的金额占该年度工业产值的比值来表示 |
| 公众环境关注度 | BI | 在百度搜索引擎中检索关键词, 采用Python爬取2008-2022年间公众对 “环境污染” 和 “雾霾” 等词条的日均搜索量, 并将其加总后加一取自然对数 (Chen et al., |
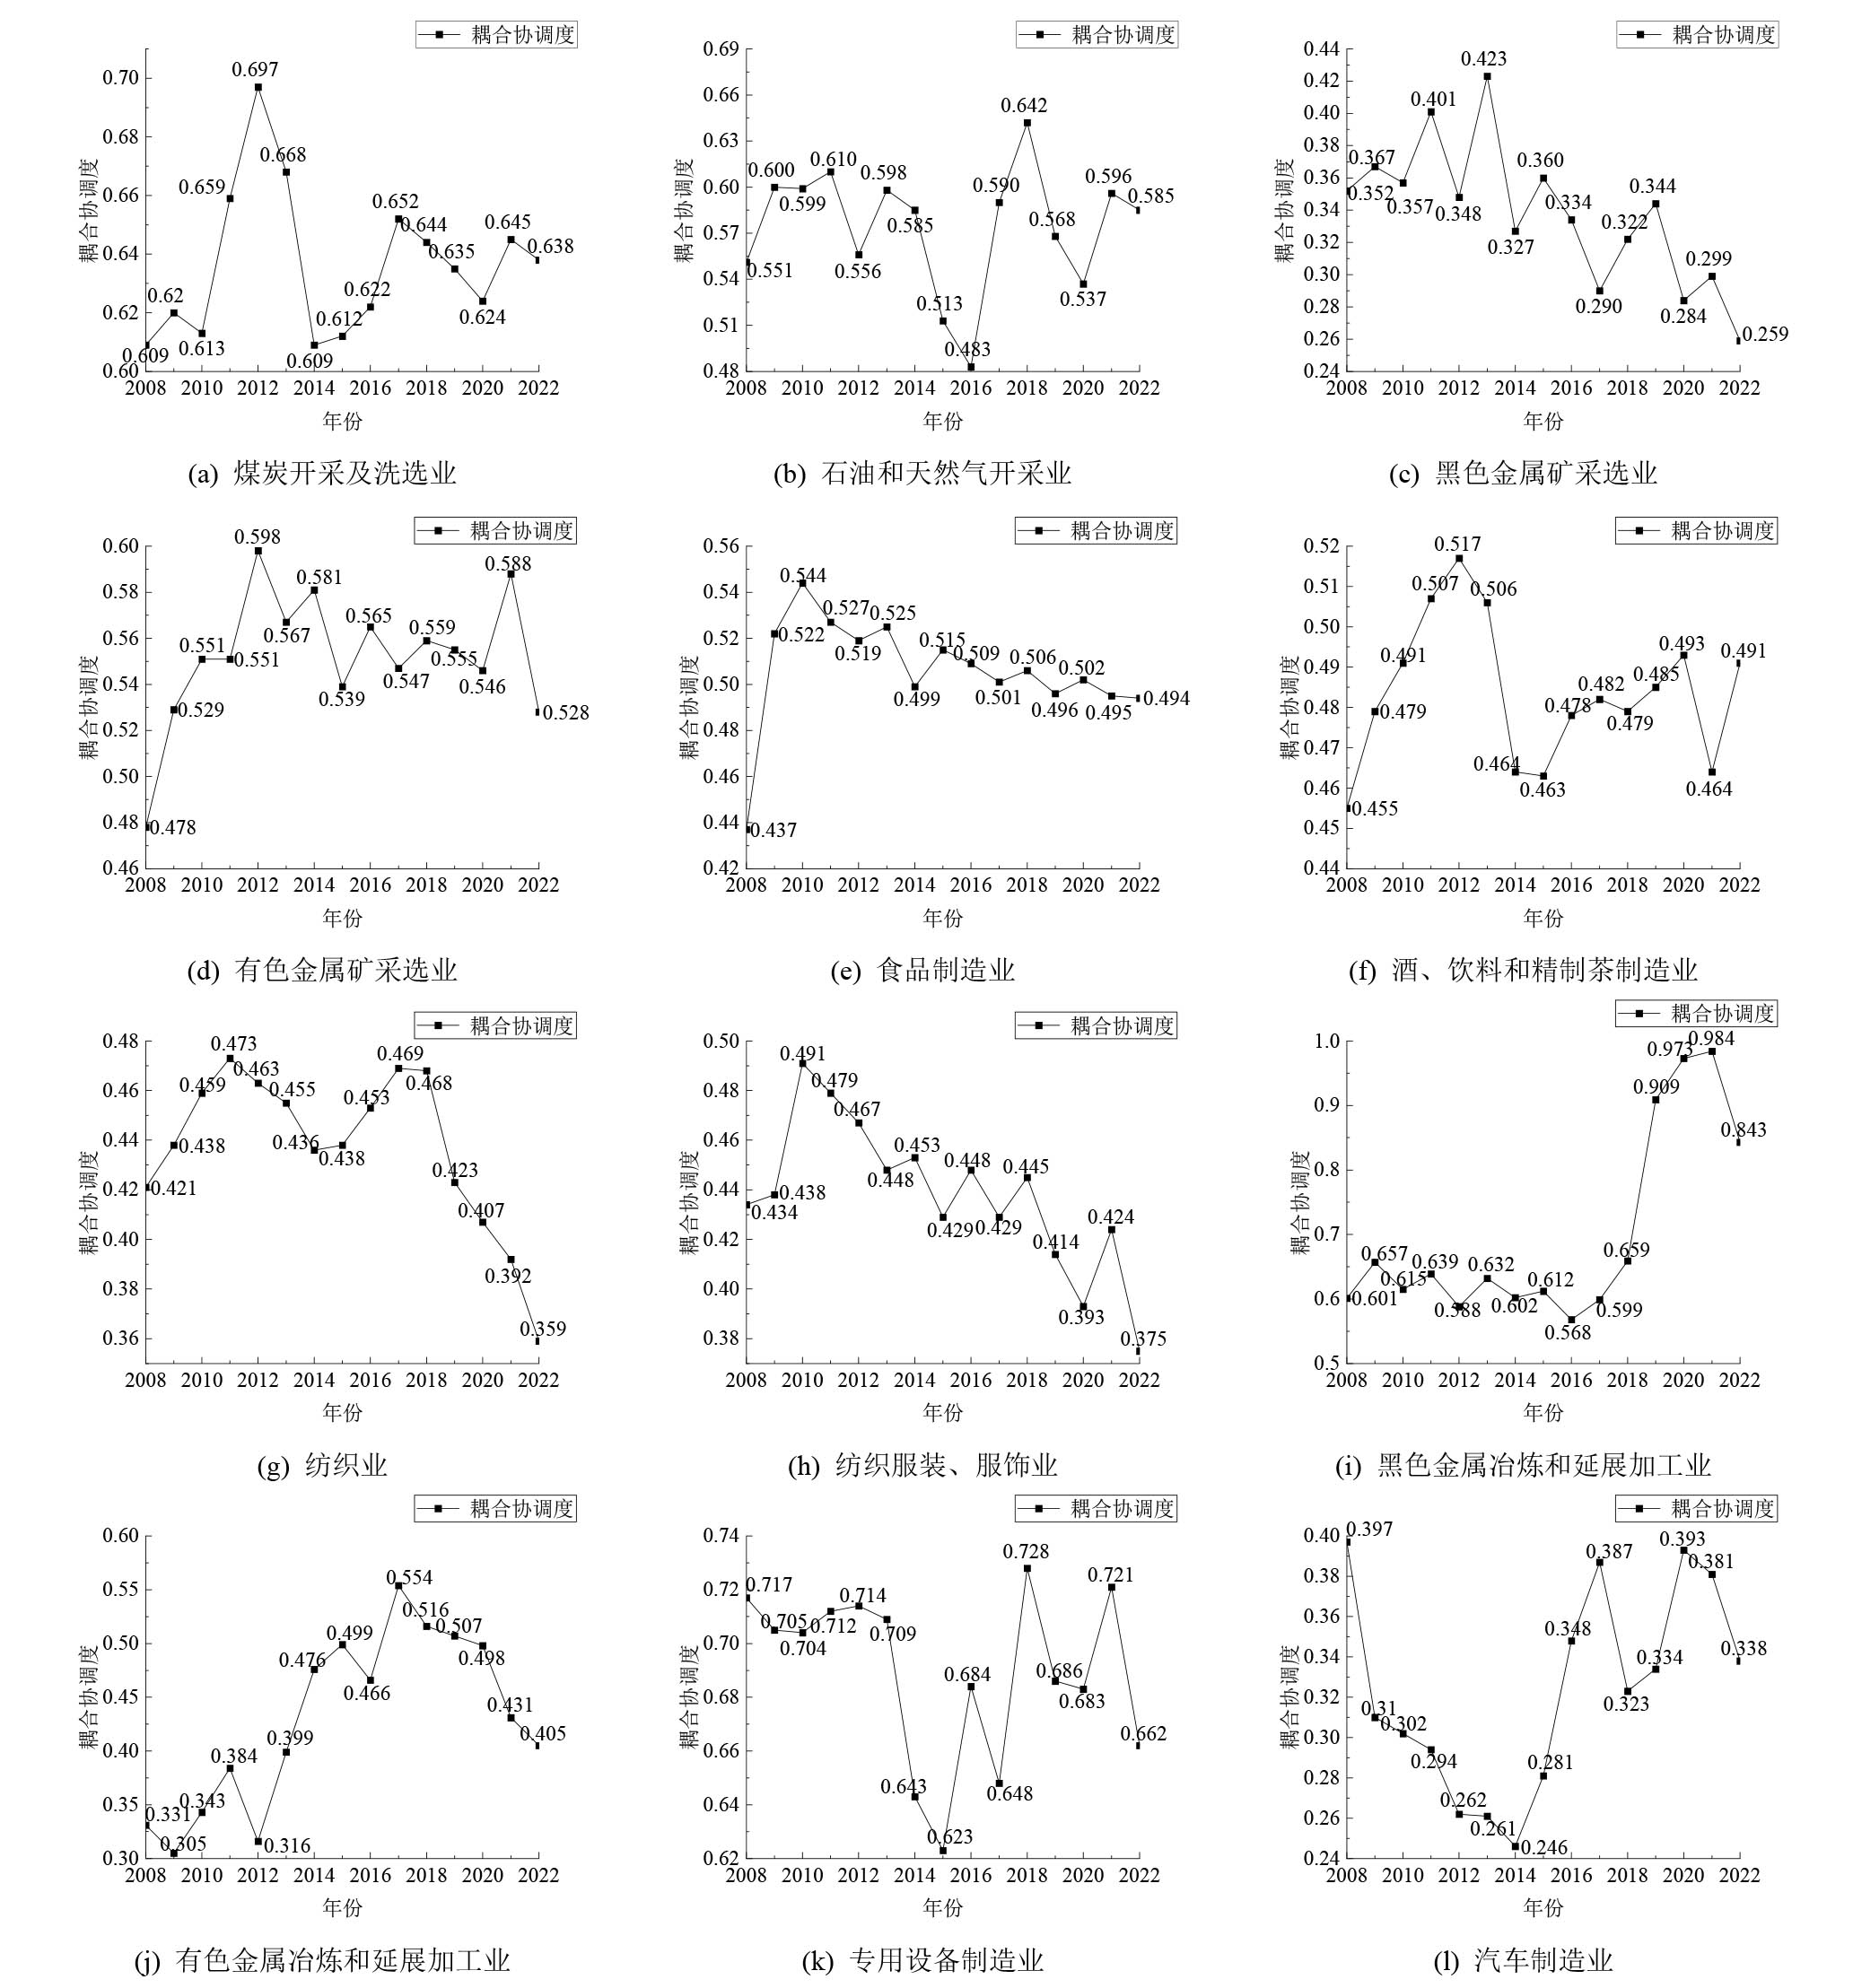
Figure 1 Trends in coupling coordination of heavy pollution subsectors

Figure 2 Spatial distribution of the synergistic effect of pollution reduction and carbon reduction in heavily polluting enterprises
| 变量 | D | ||
|---|---|---|---|
| TEC | -0.010*** 1) | -0.009*** | -0.010*** |
| (-21.080) | (-16.800) | (-21.080) | |
| TFP | 0.110*** | 0.089*** | 0.110*** |
| (43.200) | (28.430) | (43.200) | |
| EP | 4.42×10⁻³** 2) | 3.30×10-3* 3) | 4.42×10⁻³** |
| (2.520) | (1.720) | (2.520) | |
| ESG | 6.4×10⁻⁴ | 2.3×10⁻⁴ | 6.4×10⁻⁴ |
| (0.290) | (0.100) | (0.290) | |
| Green | 9.2×10⁻⁴*** | 1.0×10⁻⁴*** | 9.2×10⁻⁴*** |
| (1.380) | (1.490) | (1.380) | |
| TP | 1.3×10⁻³*** | 9.7×10⁻⁴** | 1.3×10⁻³*** |
| (3.410) | (2.420) | (3.410) | |
| Net | -1.4×10⁻⁴ | 4×10⁻⁴ | -1.4×10⁻⁴ |
| (-1.510) | (0.240) | (-1.510) | |
| _cons | -0.566*** | -0.362*** | -0.566*** |
| (-22.060) | (-11.390) | (-22.060) | |
| 个体效应 | 不控制 | 控制 | 控制 |
| 时间效应 | 控制 | 控制 | 控制 |
| N | 1500 | 1500 | 1500 |
| R2 | 0.388 | 0.389 | 0.388 |
Table 2 Benchmark regression results
| 变量 | D | ||
|---|---|---|---|
| TEC | -0.010*** 1) | -0.009*** | -0.010*** |
| (-21.080) | (-16.800) | (-21.080) | |
| TFP | 0.110*** | 0.089*** | 0.110*** |
| (43.200) | (28.430) | (43.200) | |
| EP | 4.42×10⁻³** 2) | 3.30×10-3* 3) | 4.42×10⁻³** |
| (2.520) | (1.720) | (2.520) | |
| ESG | 6.4×10⁻⁴ | 2.3×10⁻⁴ | 6.4×10⁻⁴ |
| (0.290) | (0.100) | (0.290) | |
| Green | 9.2×10⁻⁴*** | 1.0×10⁻⁴*** | 9.2×10⁻⁴*** |
| (1.380) | (1.490) | (1.380) | |
| TP | 1.3×10⁻³*** | 9.7×10⁻⁴** | 1.3×10⁻³*** |
| (3.410) | (2.420) | (3.410) | |
| Net | -1.4×10⁻⁴ | 4×10⁻⁴ | -1.4×10⁻⁴ |
| (-1.510) | (0.240) | (-1.510) | |
| _cons | -0.566*** | -0.362*** | -0.566*** |
| (-22.060) | (-11.390) | (-22.060) | |
| 个体效应 | 不控制 | 控制 | 控制 |
| 时间效应 | 控制 | 控制 | 控制 |
| N | 1500 | 1500 | 1500 |
| R2 | 0.388 | 0.389 | 0.388 |
| 变量 | D | |||||
|---|---|---|---|---|---|---|
| TEC | -8.0×10⁻³ | -8.3×10⁻³*** | -8.4×10⁻³*** | -8.4×10⁻³*** | -8.4×10⁻³*** | -8.5×10⁻³*** |
| (0.001) | (0.001) | (0.001) | (0.001) | (0.001) | (0.001) | |
| TFP | 0.090*** | 0.091*** | 0.090*** | 0.090*** | 0.089*** | |
| (0.013) | (0.013) | (0.013) | (0.013) | (0.013) | ||
| EP | 3.4×10⁻³ | 3.5×10⁻³ | 3.3×10⁻³ | 3.3×10⁻³ | ||
| (0.003) | (0.003) | (0.003) | (0.003) | |||
| ESG | 5.0×10⁻⁴ | 7.0×10⁻⁴ | 2.0×10⁻⁴ | |||
| (0.005) | (0.005) | (0.005) | ||||
| Green | 0.001*** | 0.001*** | ||||
| (4.0×10⁻⁴) | (4.0×10⁻⁴) | |||||
| TP | 0.001* | |||||
| (0.001) | ||||||
| _cons | 0.522*** | -0.371*** | -0.375*** | -0.376*** | -0.376*** | -0.363*** |
| (0.017) | (0.133) | (0.132) | (0.134) | (0.134) | (0.136) | |
| R2 | 0.002 | 0.383 | 0.384 | 0.384 | 0.386 | 0.389 |
| N | 1500 | 1500 | 1500 | 1500 | 1500 | 1500 |
Table 3 Robustness test
| 变量 | D | |||||
|---|---|---|---|---|---|---|
| TEC | -8.0×10⁻³ | -8.3×10⁻³*** | -8.4×10⁻³*** | -8.4×10⁻³*** | -8.4×10⁻³*** | -8.5×10⁻³*** |
| (0.001) | (0.001) | (0.001) | (0.001) | (0.001) | (0.001) | |
| TFP | 0.090*** | 0.091*** | 0.090*** | 0.090*** | 0.089*** | |
| (0.013) | (0.013) | (0.013) | (0.013) | (0.013) | ||
| EP | 3.4×10⁻³ | 3.5×10⁻³ | 3.3×10⁻³ | 3.3×10⁻³ | ||
| (0.003) | (0.003) | (0.003) | (0.003) | |||
| ESG | 5.0×10⁻⁴ | 7.0×10⁻⁴ | 2.0×10⁻⁴ | |||
| (0.005) | (0.005) | (0.005) | ||||
| Green | 0.001*** | 0.001*** | ||||
| (4.0×10⁻⁴) | (4.0×10⁻⁴) | |||||
| TP | 0.001* | |||||
| (0.001) | ||||||
| _cons | 0.522*** | -0.371*** | -0.375*** | -0.376*** | -0.376*** | -0.363*** |
| (0.017) | (0.133) | (0.132) | (0.134) | (0.134) | (0.136) | |
| R2 | 0.002 | 0.383 | 0.384 | 0.384 | 0.386 | 0.389 |
| N | 1500 | 1500 | 1500 | 1500 | 1500 | 1500 |
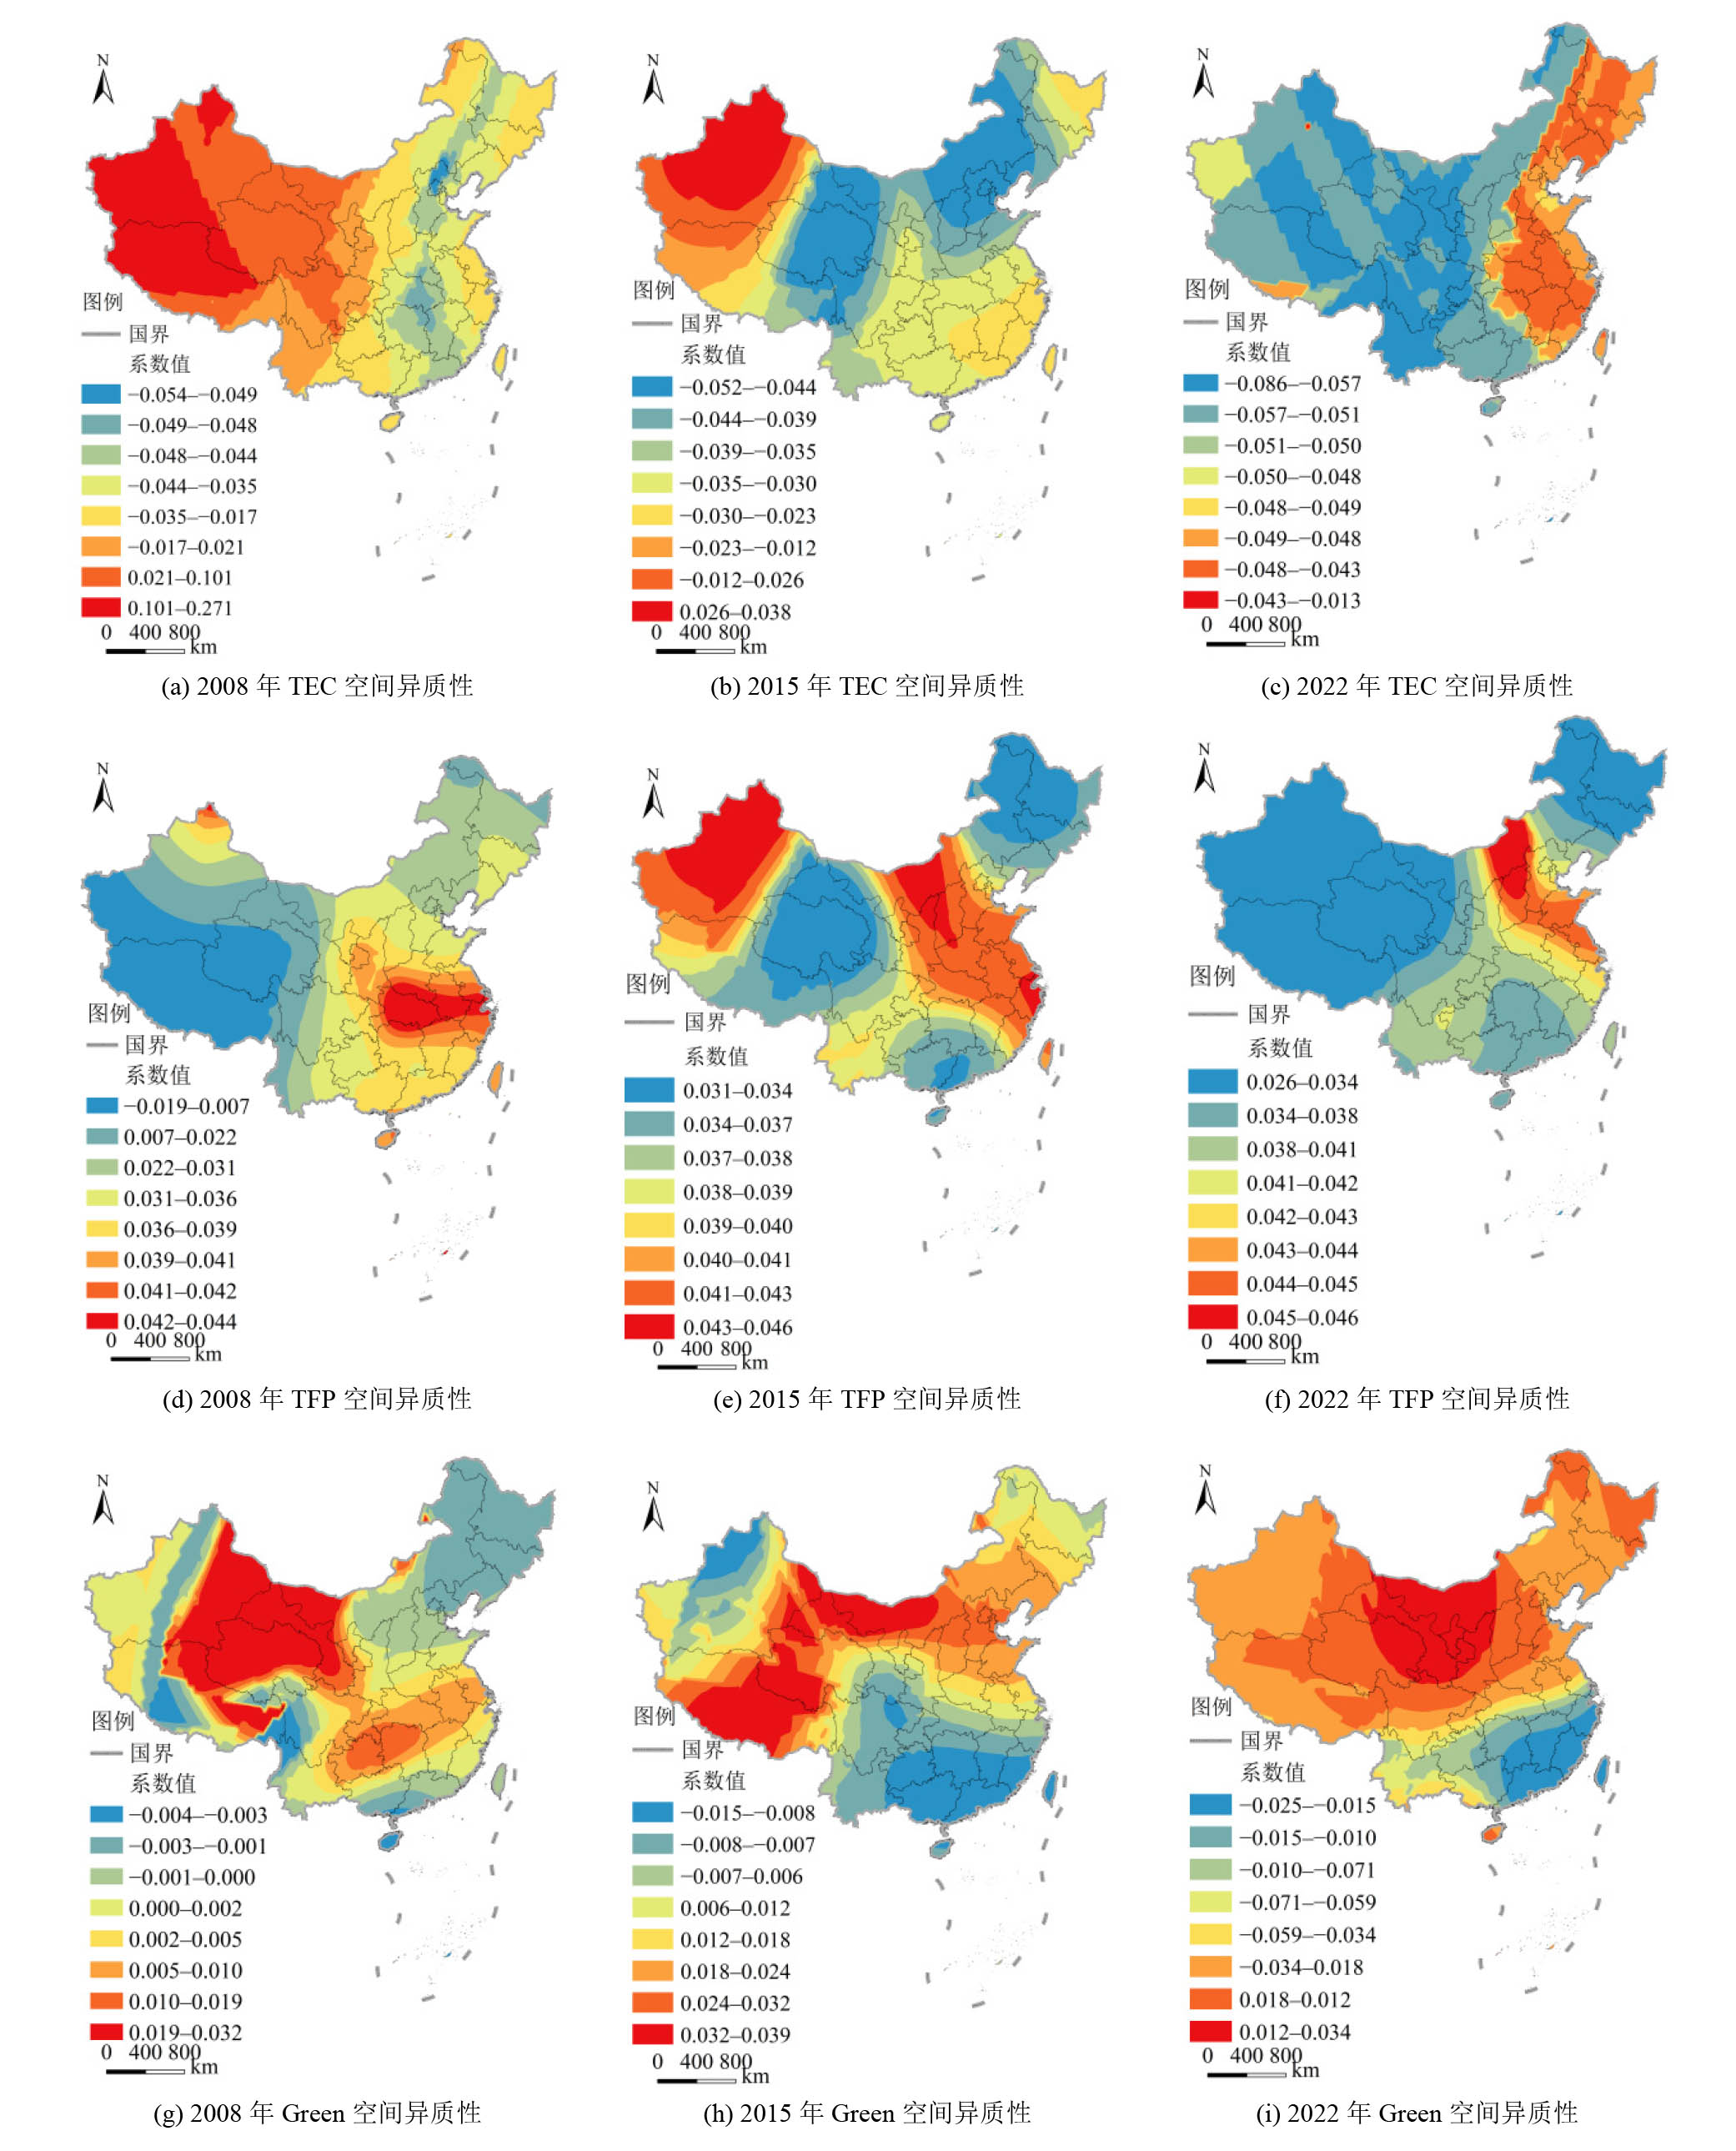
Figure 3 Spatial heterogeneity of drivers
| 变量 | D | |||
|---|---|---|---|---|
| TEC | -0.005*** | -0.005*** | -0.005*** | -0.004*** |
| (-7.02) | (-5.69) | (-7.19) | (-4.000) | |
| TFP | 0.004 | 0.004 | 0.005* | 0.004 |
| (-1.540) | (-1.530) | (-1.810) | (-1.530) | |
| Green | 5.84×10⁻⁴ | 5.84×10⁻⁴ | 6.77×10⁻⁴ | 6.14×10⁻⁴ |
| (0.710) | (0.710) | (0.820) | (0.740) | |
| TECEI | 3.31×10⁻³ | |||
| (0.020) | ||||
| TECBI | -9.82×10⁻⁵** | |||
| (-2.290) | ||||
| _cons | 0.548*** | 0.548*** | 0.564*** | 0.537*** |
| (16.590) | (16.290) | (17.570) | (15.790) | |
| N | 1200 | 1200 | 1200 | 1200 |
| R2 | 0.082 | 0.082 | 0.086 | 0.090 |
Table 4 Moderating effects of environmental regulation intensity and public concern of listed companies
| 变量 | D | |||
|---|---|---|---|---|
| TEC | -0.005*** | -0.005*** | -0.005*** | -0.004*** |
| (-7.02) | (-5.69) | (-7.19) | (-4.000) | |
| TFP | 0.004 | 0.004 | 0.005* | 0.004 |
| (-1.540) | (-1.530) | (-1.810) | (-1.530) | |
| Green | 5.84×10⁻⁴ | 5.84×10⁻⁴ | 6.77×10⁻⁴ | 6.14×10⁻⁴ |
| (0.710) | (0.710) | (0.820) | (0.740) | |
| TECEI | 3.31×10⁻³ | |||
| (0.020) | ||||
| TECBI | -9.82×10⁻⁵** | |||
| (-2.290) | ||||
| _cons | 0.548*** | 0.548*** | 0.564*** | 0.537*** |
| (16.590) | (16.290) | (17.570) | (15.790) | |
| N | 1200 | 1200 | 1200 | 1200 |
| R2 | 0.082 | 0.082 | 0.086 | 0.090 |
| [1] | CHEN F K, ZHANG S W, LIANG Y W, et al., 2023a. Spatiotemporal variability in municipal solid waste production and the determinants in Hefei’s core urban districts[J]. Sustainability, 15(22): 16058. |
| [2] | CHEN J C, SUN H, 2023b. Network attention and carbon dioxide emission performance of agricultural enterprises: Empirical evidence from China’s baidu search index[J]. Frontiers in Environmental Science, 11: 1136318. |
| [3] | COMBER A, MARTIN C, PAUL H, et al., 2022. Gwverse: A template for a new generic Geographically Weighted R Package[J]. Geographical Analysis, 54(3): 685-709. |
| [4] | DACHUAN L, PU W, YAN S, et al., 2024. Co-abatement of carbon and air pollutants emissions in China’s iron and steel industry under carbon neutrality scenarios[J]. Renewable and Sustainable Energy Reviews, 191: 114140. |
| [5] | FANG L L, WANG L C, CHEN W X, et al., 2021. Identifying the impacts of natural and human factors on ecosystem service in the Yangtze and Yellow River Basins[J]. Journal of Cleaner Production, 314(1): 127995. |
| [6] | FENG S H, PENG X J, ADAMS P, et al., 2024. Economic implications of carbon neutrality in China: A dynamic general equilibrium analysis[J]. Economic Modelling, 135: 106727. |
| [7] | GONG Y H, CAO H J, YUAN L, 2024. Does patent pledge reduce pollution and carbon emissions? Evidence from China[J]. Environmental Research, 247: 118274. |
| [8] | HU J Y, ZHANG J X, LI Y Q, 2022. Exploring the spatial and temporal driving mechanisms of landscape patterns on habitat quality in a city undergoing rapid urbanization based on GTWR and MGWR: The case of Nanjing, China[J]. Ecological Indicators, 143: 109333. |
| [9] |
LIU D D, 2022. Convergence of energy carbon emission efficiency: Evidence from manufacturing sub-sectors in China[J]. Environmental Science and Pollution Research International, 29(21): 31133-31147.
DOI PMID |
| [10] | LIU D Y, LIN Y K, FU S J, 2023. Does green innovation reduce carbon emission intensity of Chinese cities? Analysis based on GS2SLS[J]. Applied Economics, 55(58): 6892-6904. |
| [11] | PENG D, LIU H B, 2022. Measurement and driving factors of carbon emissions from coal consumption in China based on the Kaya-LMDI model[J]. Energies, 16(1): 439. |
| [12] | ZHENG S S, JIN S Y, 2023. Can companies reduce carbon emission intensity to enhance sustainability?[J]. Systems, 11(5): 249. |
| [13] | ZHOU J K, ZHOU Y K, BAI X, 2023. Can Green-Technology innovation reduce atmospheric environmental pollution?[J]. Toxics, 11(5): 403. |
| [14] | ZHOU Y, CHEN T, WANG J J, et al., 2023. Analyzing the factors driving the changes of ecosystem service value in the Liangzi Lake basin: A GeoDetector-Based Application[J]. Sustainability, 15(22): 15763. |
| [15] | 曹廷求, 张光利, 2020. 自愿性信息披露与股价崩盘风险:基于电话会议的研究[J]. 经济研究, 55(11): 191-207. |
| CAO T Q, ZHANG G L, 2020. Voluntary information disclosure and stock price crash risk: A study based on conference calls[J]. Economic Research Journal, 55(11): 191-207. | |
| [16] | 陈嘉雯, 陈华超, 徐强, 2018. 全要素生产率与能源消费对碳排放影响的实证分析[J]. 统计与决策, 34(13): 130-134. |
| CHEN J W, CHEN H C, XU Q, 2018. Empirical analysis of the impact of total factor productivity and energy consumption on carbon emissions[J]. Statistics & Decision, 34(13): 130-134. | |
| [17] |
方颖, 余兴锦, 2024. 产业数字化的减污与降碳效应——基于 “生产率悖论” 的研究视角[J]. 系统工程理论与实践, 44(9): 2795-2818.
DOI |
| FANG Y, YU X J, 2024. The effects of industrial digitalization on pollution reduction and carbon reduction: A study from the perspective of the “productivity paradox”[J]. Systems Engineering-Theory & Practice, 44(9): 2795-2818. | |
| [18] |
胡国建, 陆玉麒, 钟业喜, 2024. 上市公司(总部)地理位置的分歧——兼论企业位置标准与区位理论发展创新[J]. 经济地理, 44(1): 130-138.
DOI |
| HU G J, LU Y Q, ZHONG Y X, 2024. Divergence in the geographical location of listed companies (headquarters): Discussing the innovation of corporate location standards and location theory[J]. Economic Geography, 44(1): 130-138. | |
| [19] | 李云燕, 杜文鑫, 2023. 京津冀城市群减污降碳时空特征及影响因素异质性分析[J]. 环境工程技术学报, 13(6): 2006-2015. |
| LI Y Y, DU W X, 2023. Spatiotemporal characteristics and heterogeneity analysis of influencing factors of pollution reduction and carbon reduction in the Beijing-Tianjin-Hebei urban agglomeration[J]. Journal of Environmental Engineering Technology, 13(6): 2006-2015. | |
| [20] | 毛捷, 郭玉清, 曹婧, 等, 2022. 融资平台债务与环境污染治理[J]. 管理世界, 38(10): 96-109. |
| MAO J, GUO Y Q, CAO J, et al., 2022. Financing platform debt and environmental pollution control[J]. Management World, 38(10): 96-109. | |
| [21] | 裴秋亚, 李诚, 张明喜, 2023. 数字创业生态系统协同水平测度与动态趋势特征分析[J]. 统计与决策, 39(17): 179-183. |
| PEI Q Y, LI C, ZHANG M X, 2023. Measurement and dynamic trend characteristics of the coordination level of digital entrepreneurship ecosystems[J]. Statistics & Decision, 39(17): 179-183. | |
| [22] | 王辉, 林伟芬, 谢锐, 2022. 高管环保背景与绿色投资者进入[J]. 数量经济技术经济研究, 39(12): 173-194. |
| WANG H, LIN W F, XIE R, 2022. Environmental background of executives and the entry of green investors[J]. Quantitative & Technological Economics Research, 39(12): 173-194. | |
| [23] |
王淑佳, 孔伟, 任亮, 等, 2021. 国内耦合协调度模型的误区及修正[J]. 自然资源学报, 36(3): 793-810.
DOI |
| WANG S J, KONG W, REN L, et al., 2021. Misunderstandings and corrections of the coupling coordination degree model in China[J]. Journal of Natural Resources, 36(3): 793-810. | |
| [24] |
徐佳乐, 杨兴川, 赵文吉, 等, 2024. 气候变化背景下内蒙古中西部植被覆盖度演变特征研究[J]. 生态环境学报, 33(7): 1008-1018.
DOI |
| XU J L, YANG X C, ZHAO W J, et al., 2024. Evolution characteristics of vegetation coverage in central and western Inner Mongolia under the background of climate change[J]. Ecology and Environmental Sciences, 33(7): 1008-1018. | |
| [25] | 杨思微, 李品, 2024. 数字经济发展对工业企业碳减排的影响——基于A股上市公司的证据[J]. 煤炭经济研究, 44(3): 105-115. |
| YANG S W, LI P, 2024. The impact of digital economy development on carbon emission reduction in industrial enterprises: Evidence from A-share listed companies[J]. Coal Economic Research, 44(3): 105-115. | |
| [26] | 杨雪娇, 王聪, 2024. 公众环境关注、绿色技术创新与企业绩效[J]. 技术与创新管理, 45(1): 19-31. |
| YANG X J, WANG C, 2024. Public environmental concern, green technology innovation, and corporate performance[J]. Technology & Innovation Management, 45(1): 19-31. | |
| [27] | 叶芳羽, 单汨源, 李勇, 等, 2022. 碳排放权交易政策的减污降碳协同效应评估[J]. 湖南大学学报(社会科学版), 36(2): 43-50. |
| YE F Y, SHAN M Y, LI Y, et al., 2022. Assessment of the synergy effect of pollution reduction and carbon reduction under the carbon emission trading policy[J]. Journal of Hunan University (Social Sciences), 36(2): 43-50. | |
| [28] |
原伟鹏, 孙慧, 王晶, 等, 2022. 中国城市减污降碳协同的时空演化及驱动力探析[J]. 经济地理, 42(10): 72-82.
DOI |
| YUAN W P, SUN H, WANG J, et al., 2022. Exploring the spatial and temporal evolution and driving forces of pollution and carbon reduction synergies in Chinese cities[J]. Economic Geography, 42(10): 72-82. | |
| [29] | 张为师, 徐颖, 惠婧璇, 2023. 中国城市CO2排放和空气质量协同变化特征及驱动因素研究[J]. 中国环境管理, 15(2): 38-47. |
| ZHANG W S, XU Y, HUI J X, 2023. Study on the characteristics and driving factors of coordinated changes in CO2 emissions and air quality in Chinese cities[J]. China Environmental Management, 15(2): 38-47. | |
| [30] |
郑晓豪, 陈颖彪, 郑子豪, 等, 2023. 湖北省生态系统服务价值动态变化及其影响因素演变[J]. 生态环境学报, 32(1): 195-206.
DOI |
| ZHENG X H, CHEN Y B, ZHENG Z H, et al., 2023. Dynamic changes of ecosystem service value and evolution of its influencing factors in Hubei province[J]. Ecology and Environmental Sciences, 32(1): 195-206. | |
| [31] | 周行, 马延柏, 2023. 地方政府 “减污降碳” 协同治理的减排效应研究——基于环境规制策略的调节效应[J]. 经济与管理, 37(3): 40-48. |
| ZHOU X, MA Y B, 2023. Research on the emission reduction effect of local governments’ “pollution reduction and carbon reduction” coordinated governance: Based on the moderating effect of environmental regulation strategies[J]. Economic & Management, 37(3): 40-48. | |
| [32] | 朱沛华, 陈林, 2020. 工业增加值与全要素生产率估计——基于中国制造业的拟蒙特卡洛实验[J]. 中国工业经济 (7): 24-42. |
| ZHU P H, CHEN L, 2020. Estimation of industrial added value and total factor productivity: Based on a quasi-Monte Carlo experiment in Chinese manufacturing[J]. China Industrial Economics (7): 24-42. | |
| [33] | 朱思瑜, 于冰, 2024. 长三角减污降碳政策的协同效应和作用机制研究[J]. 环境科学研究, 37(2): 256-265. |
| ZHU S Y, YU B, 2024. Research on the synergy effect and mechanism of pollution reduction and carbon reduction policies in the Yangtze River Delta[J]. Environmental Science Research, 37(2): 256-265. |
| [1] | DAI Xiaoai, MA Jiaxin, TANG Yiling, LI Weile. Spatio-temporal Dynamics and Attribution Analysis of Vegetation in Gansu Province [J]. Ecology and Environment, 2024, 33(8): 1163-1173. |
| [2] | LI Haiyan, YANG Tao, LIAO Yilin, QU Yajie. Analysis of Distribution Pattern and Driving Habitat Quality of Rivers in the Wei River Basin (Shaanxi section) [J]. Ecology and Environment, 2024, 33(7): 1153-1162. |
| [3] | WANG Meinai, FAN Shunxiang, SHU Hanjun, ZHANG Jianjie, CHU Liqi, FA Yuqi. Spatio-temporal Variations in Soil Erosion and Its Economic Value of Soil Conservation in Henan Province [J]. Ecology and Environment, 2024, 33(5): 730-744. |
| [4] | LI Rongjie, LI Huimei, WU Feifei, ZHAO mingde, WANG Shihan, SUN xueying. Study on the Spatial Differentiation Pattern and Driving Force of Ecosystem Services in Qinghai Lake Basin [J]. Ecology and Environment, 2024, 33(2): 301-309. |
| [5] | LUO Guangyu, WANG Zhiyuan. Research on the Carbon Storage Effect and Driving Factors of the Evolution of Territorial Space Pattern in Dongting Lake Ecological and Economic Zone [J]. Ecology and Environment, 2024, 33(11): 1672-1685. |
| [6] | LI Huiqiang, LIANG Xiaoying, WEI Zheng, ZHU Yongfei, SHI Jinxin. Driving Force Analysis of Ecosystem Service Bundle Change Based on Logistic Regression Model: A Case Study of Guantian Economic Zone [J]. Ecology and Environment, 2024, 33(11): 1803-1815. |
| [7] | HU Yingying, LUO Hongxia, DAI Shengpei, YU Xuan, DENG Chunmei, LI Hailiang, LIANG Weihong, ZHENG Qian. Evaluation of Ecological Environment Quality and Analysis of Driving Mechanism in Wuzhishan City of Hainan Island Based on Remote Sensing Ecological Indices [J]. Ecology and Environment, 2024, 33(10): 1624-1633. |
| [8] | XIAO Chengzhi, JI Yang, LI Jianzhong, ZHANG Zhi, BA Renji, CAO Yating. Spatial and Temporal Differentiation of Ecological Vulnerability and Interaction Effects of Driving Factors in the Upper reaches of the Minjiang River: A Case Study of the Zagunao River Basin [J]. Ecology and Environment, 2023, 32(10): 1760-1770. |
| [9] | FU Rong, WU Xinmei, CHEN Bin. Analysis on the Spatial Stratified Heterogeneity and Driving Factors Differences of the Urban Land Surface Temperature: A Case Study of Hefei [J]. Ecology and Environment, 2023, 32(1): 110-122. |
| [10] | ZHENG Xiaohao, CHEN Yingbiao, ZHENG Zihao, GUO Cheng, HUANG Zhounan, ZHOU Yongshi. Dynamic Changes of Ecosystem Service Value and Evolution of Its Influencing Factors in Hubei Province [J]. Ecology and Environment, 2023, 32(1): 195-206. |
| [11] | WANG Lixia, SHI Yuanli, ZHANG Hongwei, BI Xiaoling, SHEN Wenming, MA Wandong. Analysis of Vegetation Ecological Function Changes and Driving Factors in Farming-pastoral Ecotone in Northern China from 2000 to 2020 [J]. Ecology and Environment, 2021, 30(10): 1990-1998. |
| [12] | LEI Jinrui, CHEN Zongzhu, CHEN Yiqing, CHEN Xiaohua, LI Yuanling, WU Tingtian. Dynamic Analysis of Wetland Landscape Ecological Security Pattern of Hainan Island in 1990‒2018 [J]. Ecology and Environment, 2020, 29(2): 293-302. |
| [13] | LEI Jinrui, CHEN Zongzhu, CHEN Yiqing, CHEN Xiaohua, LI Yuanling, WU Tingtian. Landscape Pattern Changes and Driving Factors Analysis of Wetland in Hainan Island during 1990-2018 [J]. Ecology and Environment, 2020, 29(1): 59-70. |
| Viewed | ||||||
|
Full text |
|
|||||
|
Abstract |
|
|||||
Copyright © 2021 Editorial Office of ACTA PETROLEI SINICA
Address:No. 6 Liupukang Street, Xicheng District, Beijing, P.R.China, 510650
Tel: 86-010-62067128, 86-010-62067137, 86-010-62067139
Fax: 86-10-62067130
Email: syxb@cnpc.com.cn
Support byBeijing Magtech Co.ltd, E-mail:support@magtech.com.cn