Ecology and Environmental Sciences ›› 2025, Vol. 34 ›› Issue (11): 1690-1704.DOI: 10.16258/j.cnki.1674-5906.2025.11.003
• Papers on Carbon Cycling and Carbon Emission Reduction • Previous Articles Next Articles
ZHANG Chengchi( ), YAO Huifang, MA Xiuzhi*()
Received:2025-04-03
Online:2025-11-18
Published:2025-11-05
张成驰(), 姚慧芳, 马秀枝*()
通讯作者:
E-mail: 作者简介:张成驰(2002年生),男,硕士研究生,研究方向为植被定量遥感。E-mail: qingtangmianyyds@imau.edu.cn
基金资助:CLC Number:
ZHANG Chengchi, YAO Huifang, MA Xiuzhi. Spatiotemporal Dynamics and Attribution Analysis of Net Ecosystem Productivity in the Tianshan Region[J]. Ecology and Environmental Sciences, 2025, 34(11): 1690-1704.
张成驰, 姚慧芳, 马秀枝. 新疆天山地区净生态系统生产力时空动态及归因分析[J]. 生态环境学报, 2025, 34(11): 1690-1704.
Add to citation manager EndNote|Ris|BibTeX
URL: https://www.jeesci.com/EN/10.16258/j.cnki.1674-5906.2025.11.003

Figure 1 Overview of the study area schematic diagram
| 数据 | 产品 | 空间分辨率 | 时间分辨率 | 时段 | 来源 |
|---|---|---|---|---|---|
| NPP | MODIS NPP | 500 m | 年 | 2001-2024 | https://doi.org/10.5067/MODIS/MOD17A3HGF.061 |
| 气象数据 | Terra climate | 4 km | 月 | 2001-2024 | https://www.climatologylab.org/terraclimate.html |
| 植被类型 | 中国1꞉1000000植被图集 | - | - | - | https://www.plantplus.cn/cn |
| 高程 | SRTM | 30 m | - | 2024 | https://srtm.csi.cgiar.org/ |
| 行政区划 | GS(2024)0650 | - | - | 2024 | https://cloudcenter.tianditu.gov.cn/administrativeDivision/ |
Table 1 The dataset used in this study
| 数据 | 产品 | 空间分辨率 | 时间分辨率 | 时段 | 来源 |
|---|---|---|---|---|---|
| NPP | MODIS NPP | 500 m | 年 | 2001-2024 | https://doi.org/10.5067/MODIS/MOD17A3HGF.061 |
| 气象数据 | Terra climate | 4 km | 月 | 2001-2024 | https://www.climatologylab.org/terraclimate.html |
| 植被类型 | 中国1꞉1000000植被图集 | - | - | - | https://www.plantplus.cn/cn |
| 高程 | SRTM | 30 m | - | 2024 | https://srtm.csi.cgiar.org/ |
| 行政区划 | GS(2024)0650 | - | - | 2024 | https://cloudcenter.tianditu.gov.cn/administrativeDivision/ |
| 中位数斜率(Q) | 标准化统计量(Z) | 趋势类型 |
|---|---|---|
| Q>0 | Z<2.58 1.96<Z≤2.58 1.65<Z≤1.96 Z≤1.65 | 极显著上升 显著上升 微显著上升 不显著上升 |
| Q=0 | Z=0 | 无变化 |
| Q<0 | Z≤1.65 1.65<Z≤1.96 1.96<Z≤2.58 Z<2.58 | 不显著下降 微显著下降 显著下降 极显著下降 |
Table 2 Classification of Mann-Kenddall test trend
| 中位数斜率(Q) | 标准化统计量(Z) | 趋势类型 |
|---|---|---|
| Q>0 | Z<2.58 1.96<Z≤2.58 1.65<Z≤1.96 Z≤1.65 | 极显著上升 显著上升 微显著上升 不显著上升 |
| Q=0 | Z=0 | 无变化 |
| Q<0 | Z≤1.65 1.65<Z≤1.96 1.96<Z≤2.58 Z<2.58 | 不显著下降 微显著下降 显著下降 极显著下降 |
| 中位数斜率(Q) | Hurst指数(H) | 趋势类型 |
|---|---|---|
| Q>0 | 0<H≤0.5 0.5<H≤1 | 反持续上升 持续上升 |
| Q<0 | 0<H≤0.5 0.5<H≤1 | 反持续下降 持续下降 |
Table 3 Time series classification based on Hurst exponent and slope (Q)
| 中位数斜率(Q) | Hurst指数(H) | 趋势类型 |
|---|---|---|
| Q>0 | 0<H≤0.5 0.5<H≤1 | 反持续上升 持续上升 |
| Q<0 | 0<H≤0.5 0.5<H≤1 | 反持续下降 持续下降 |
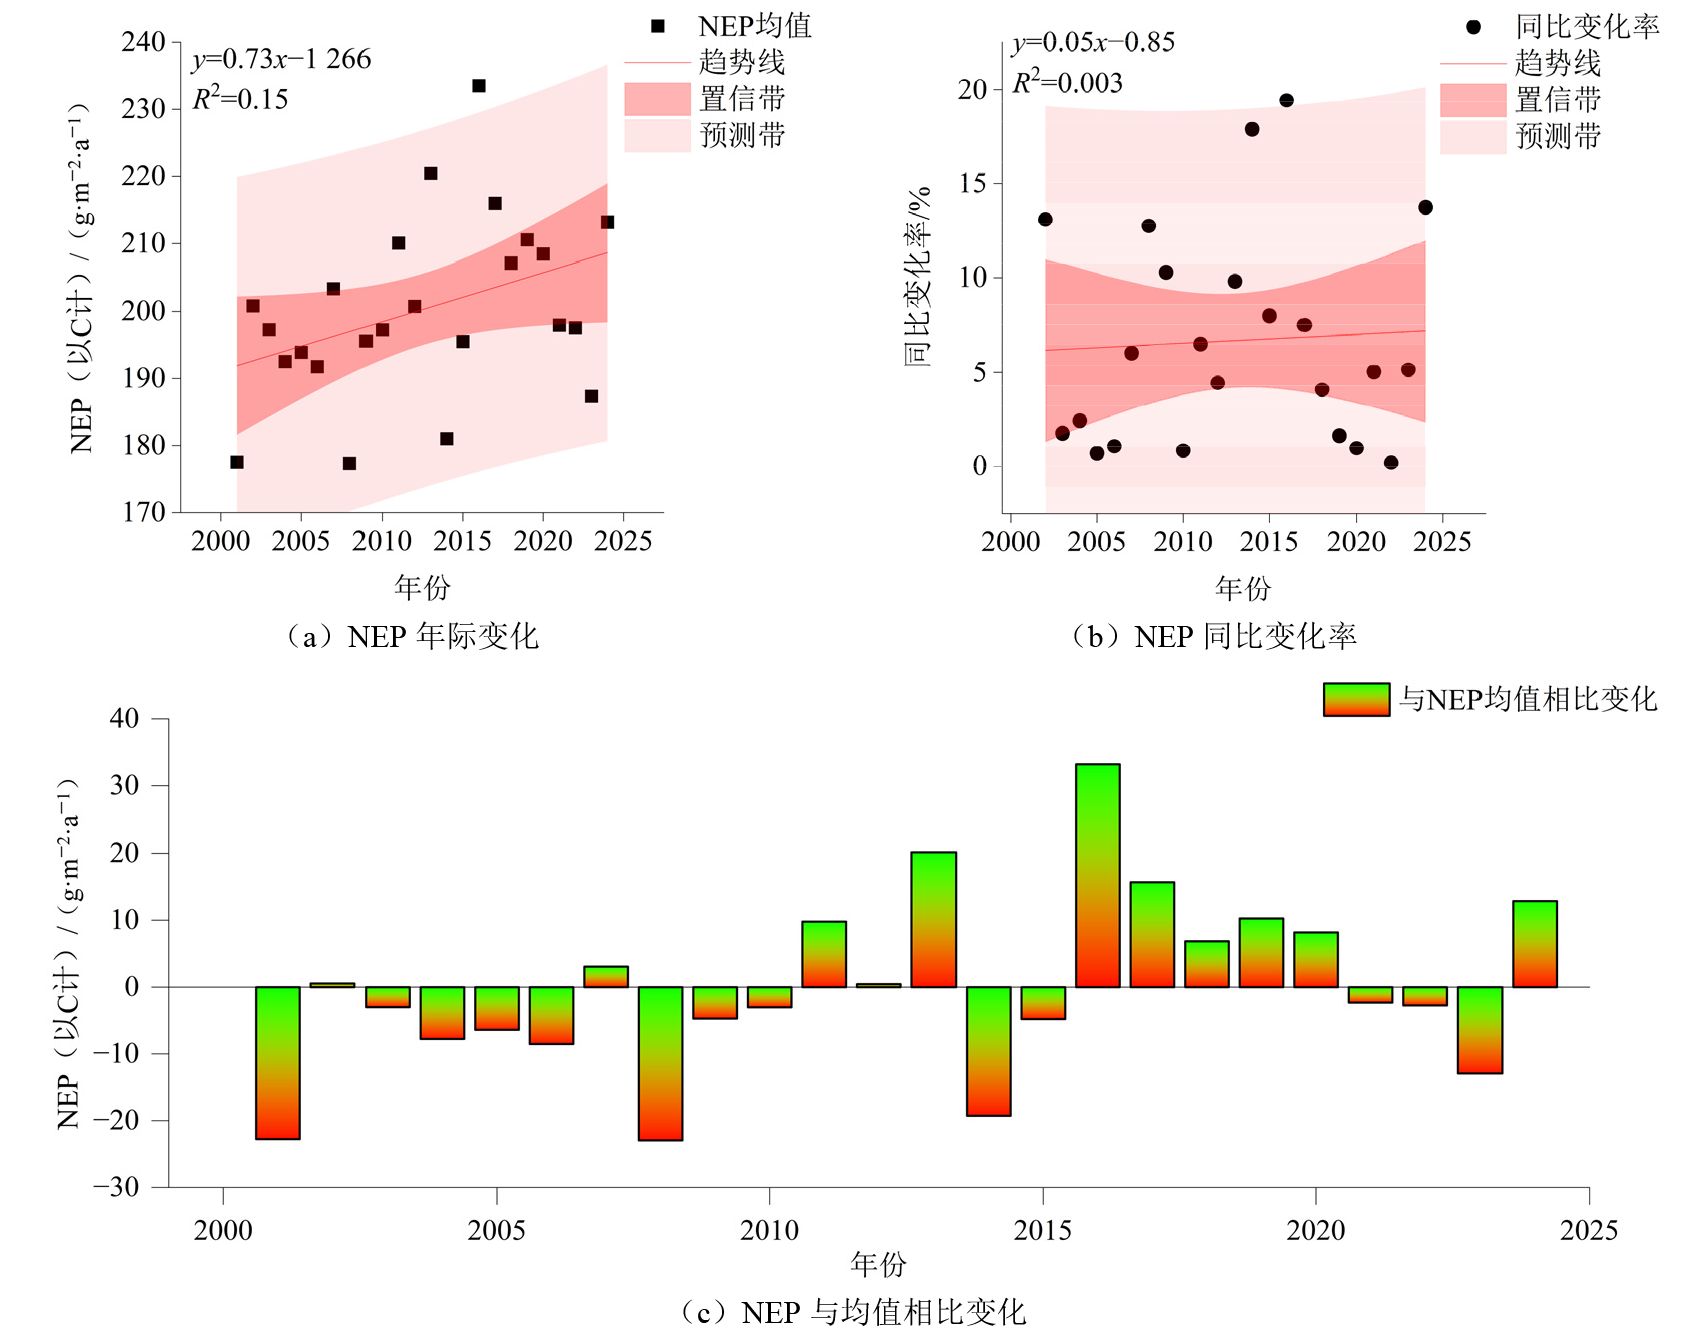
Figure 2 The interannual variation of NEP in Tianshan region from 2001 to 2024

Figure 3 The trend of NEP of different vegetation types in Tianshan region from 2001 to 2024
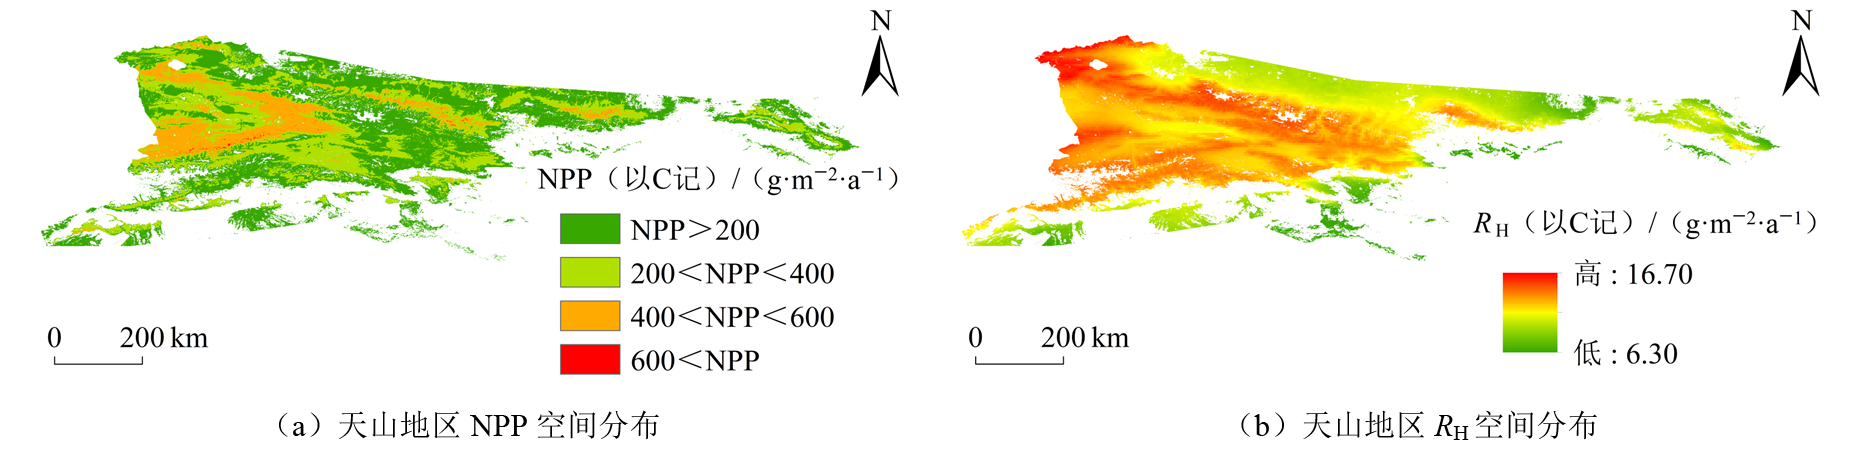
Figure 4 The spatial distribution of NPP and RH in Tianshan region from 2001 to 2024

Figure 5 The change trend of NEP in Tianshan region from 2001 to 2024 and its future trend prediction

Figure 6 The percentage and mean value of the change trend of each vegetation type from 2001 to 2024

Figure 7 The interannual variation of meteorological factors in Tianshan region from 2001 to 2024

Figure 8 The relative and absolute contributions of climatic factors to NEP in Tianshan region
| 植被类型 | 各气候因子对不同植被的相对贡献/% | |||
|---|---|---|---|---|
| 累计降水 | 土壤湿度 | 太阳辐射 | 平均气温 | |
| 草甸 | 17.60 | 34.93 | 19.47 | 28.00 |
| 草原 | 17.93 | 38.43 | 17.03 | 26.61 |
| 高山植 | 9.94 | 32.44 | 28.44 | 29.18 |
| 灌丛 | 13.33 | 47.39 | 14.29 | 25.00 |
| 荒漠 | 32.45 | 34.84 | 13.25 | 19.46 |
| 阔叶林 | 32.37 | 39.37 | 7.35 | 20.91 |
| 栽培植 | 12.02 | 24.79 | 27.88 | 35.32 |
| 沼泽 | 34.75 | 31.33 | 12.43 | 21.49 |
| 针叶林 | 12.10 | 18.89 | 14.78 | 54.23 |
| 其他 | 14.77 | 41.67 | 18.06 | 25.50 |
Table 4 Comparison of the contribution of climatic factors to different vegetation types
| 植被类型 | 各气候因子对不同植被的相对贡献/% | |||
|---|---|---|---|---|
| 累计降水 | 土壤湿度 | 太阳辐射 | 平均气温 | |
| 草甸 | 17.60 | 34.93 | 19.47 | 28.00 |
| 草原 | 17.93 | 38.43 | 17.03 | 26.61 |
| 高山植 | 9.94 | 32.44 | 28.44 | 29.18 |
| 灌丛 | 13.33 | 47.39 | 14.29 | 25.00 |
| 荒漠 | 32.45 | 34.84 | 13.25 | 19.46 |
| 阔叶林 | 32.37 | 39.37 | 7.35 | 20.91 |
| 栽培植 | 12.02 | 24.79 | 27.88 | 35.32 |
| 沼泽 | 34.75 | 31.33 | 12.43 | 21.49 |
| 针叶林 | 12.10 | 18.89 | 14.78 | 54.23 |
| 其他 | 14.77 | 41.67 | 18.06 | 25.50 |
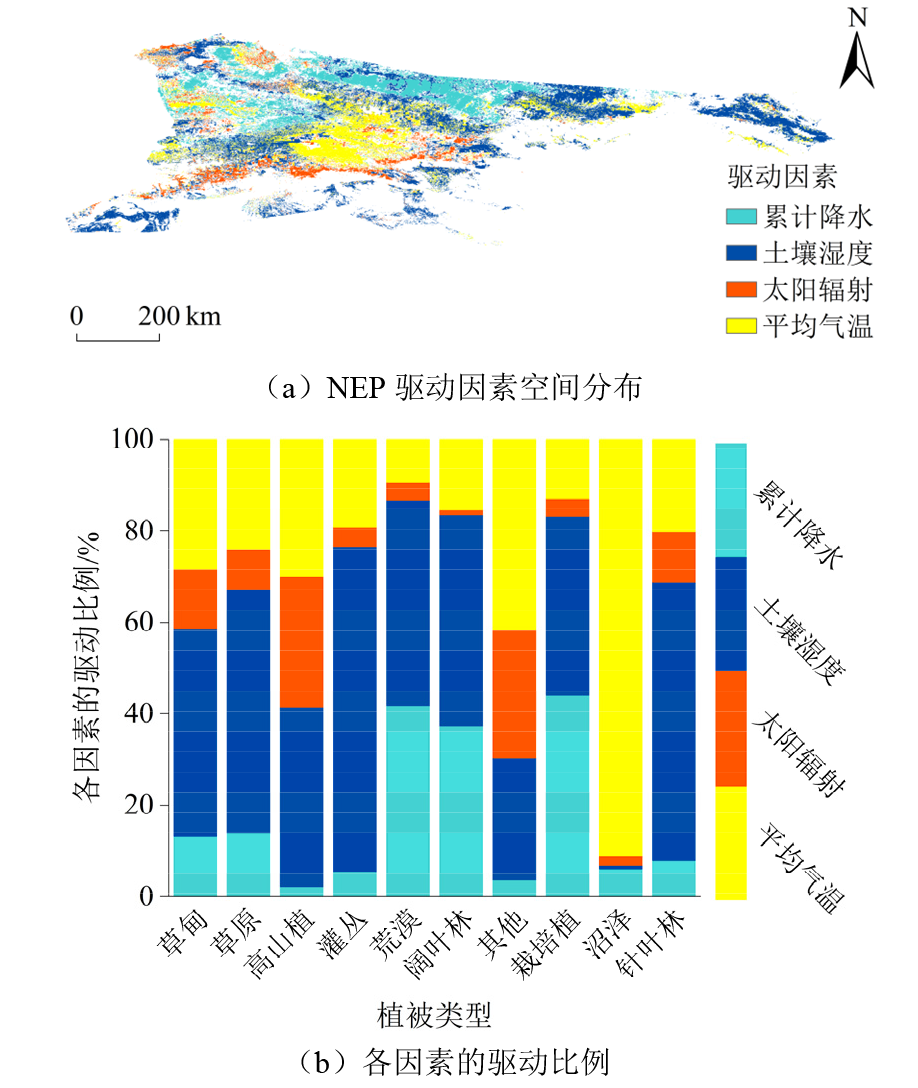
Figure 9 Distribution of NEP driving factors in Tianshan region

Figure 10 Contributions of climate change and human activities NEP in Tianshan region
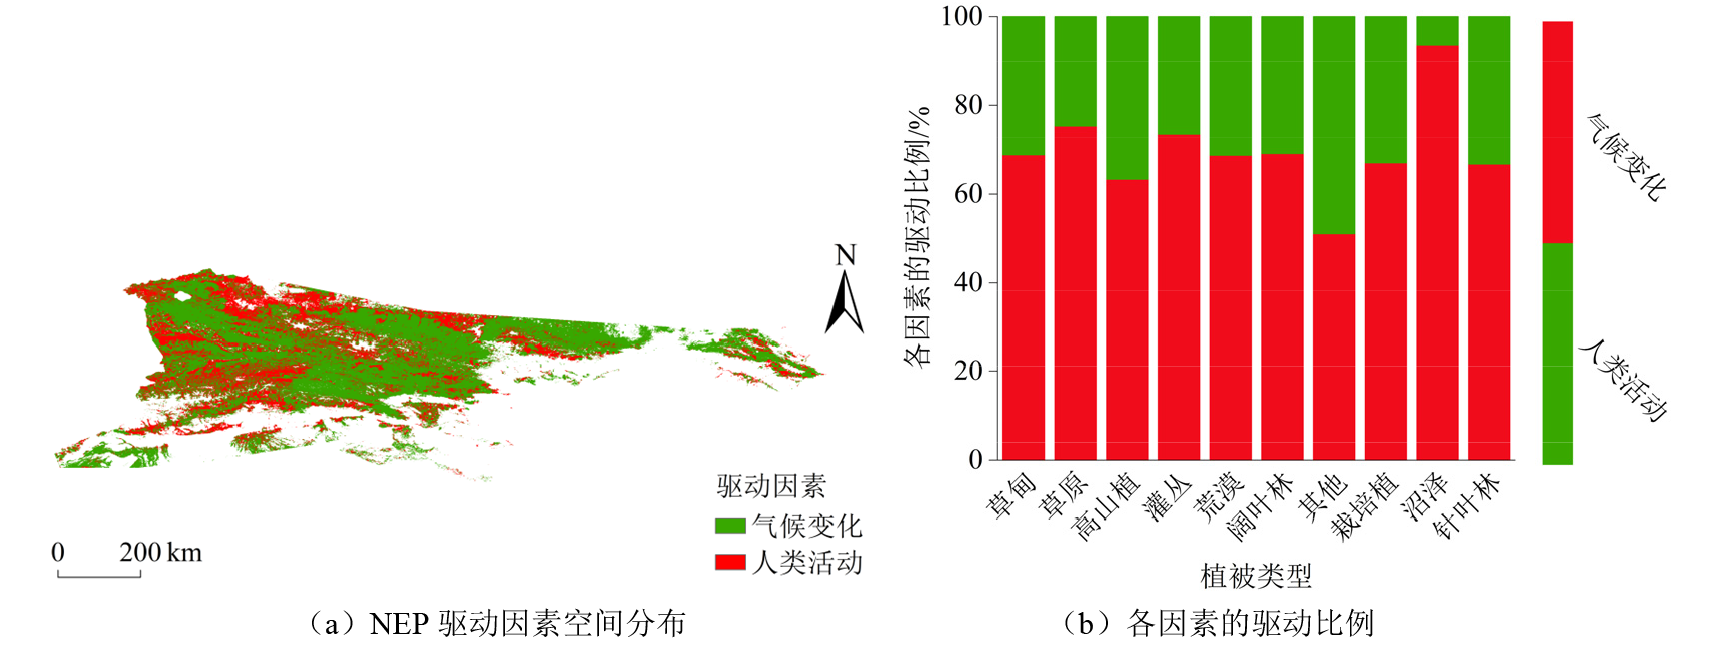
Figure 11 Climate change and human activities drive the distribution of NEP in Tianshan region
| [1] | ABATZOGLOU J T, DOBROWSKI S Z, PARKS S A, et al., 2018. Terraclimate, a high-resolution global dataset of monthly climate and climatic water balance from 1958-2015[J]. Scientific Data, 5(1): 170191. |
| [2] | CHANGE C, 2022. Mitigating Climate Change. Working Group III contribution to the sixth assessment report of the intergovernmental panel on climate change[M]. Cambridge: Cambridge University Press. |
| [3] |
ELTAHIR E A, 1998. A soil moisture-rainfall feedback mechanism: Theory and observations[J]. Water Resources Research, 34(4): 765-776.
DOI URL |
| [4] |
GANG C C, ZHOU W, CHEN Y Z, et al., 2014. Quantitative assessment of the contributions of climate change and human activities on global grassland degradation[J]. Environmental Earth Sciences, 72(11): 4273-4282.
DOI URL |
| [5] |
HOERL A E, KENNARD R W, 1970. Ridge regression: Biased estimation for nonorthogonal problems[J]. Technometrics, 12(1): 55-67.
DOI URL |
| [6] |
HURST H E, 1951. Long-term storage capacity of reservoirs[J]. Transactions of the American Society of Civil Engineers, 116(1): 770-799.
DOI URL |
| [7] | LI G, LIANG J Y, WANG S J, et al., 2024. Characteristics and drivers of vegetation change in Xinjiang, 2000-2020[J]. Forests, 15(2): 231. |
| [8] |
LIU Y Y, WANG Q, ZHANG Z Y, et al., 2019. Grassland dynamics in responses to climate variation and human activities in China from 2000 to 2013[J]. Science of the total Environment, 690(10): 27-39.
DOI URL |
| [9] | LIU N, DING Y X, PENG S Z, et al., 2021. Temporal effects of climate on vegetation trigger the response biases of vegetation to human activities[J]. Global Ecology and Conservation, 31: 1822. |
| [10] |
MANN H B, 1945. Nonparametric tests against trend[J]. Econometrica: Journal of the Econometric Society, 13(3): 245-259.
DOI URL |
| [11] |
MOORE C J, 1976. A comparative study of radiation balance above forest and grassland[J]. Quarterly Journal of the Royal Meteorological Society, 102(434): 889-899.
DOI URL |
| [12] |
PARTON W, MORGAN J, SMITH D, et al., 2012. Impact of precipitation dynamics on net ecosystem productivity[J]. Global Change Biology, 18(3): 915-927.
DOI URL |
| [13] |
PEI Z Y, OUYANG H, ZHOU C P, et al., 2009. Carbon balance in an alpine steppe in the Qinghai-Tibet Plateau[J]. Journal of Integrative Plant Biology, 51(5): 521-526.
DOI URL |
| [14] |
REN Y, ZHANG F, ZHAO C, et al., 2023. Attribution of climate change and human activities to vegetation NDVI in Jilin Province, China during 1998-2020[J]. Ecological Indicators, 153: 110415.
DOI URL |
| [15] |
REUTER H I, NELSON A, JARVIS A, 2007. An evaluation of void-filling interpolation methods for SRTM data[J]. International Journal of Geographical Information Science, 21(9): 983-1008.
DOI URL |
| [16] | RUNNING S, ZHAO M, 2021. MODIS/Terra Net Primary Production Gap-Filled Yearly L4 Global 500m SIN Grid V061[DB/OL]. distributed by NASA EOSDIS Land Processes Distributed Active Archive Center. https://doi.org/10.5067/MODIS/MOD17A3HGF.061. (Accessed 2025-03-14). |
| [17] |
SEN P K, 1968. Estimates of the regression coefficient based on Kendall’s tau[J]. Journal of the American Statistical Association, 63(324): 1379-1389.
DOI URL |
| [18] | TREDENNICK A T, HOOKER G, ELLNER S P, et al., 2021. A practical guide to selecting models for exploration, inference, and prediction in ecology[J]. Ecology, 102(6): e03336. |
| [19] |
WOODWELL G M, WHITTAKER R H, REINERS W A, et al., 1978. The Biota and the World Carbon Budget: The terrestrial biomass appears to be a net source of carbon dioxide for the atmosphere[J]. Science, 199(4325): 141-146.
PMID |
| [20] | WU G L, CHENG Z, ALATALO J M, et al., 2021. Climate warming consistently reduces grassland ecosystem productivity[J]. Earth’s Future, 9(6): 1837. |
| [21] |
ZHAO Y, CHEN Y, WU C, et al., 2023. Exploring the contribution of environmental factors to evapotranspiration dynamics in the Three- River-Source region, China[J]. Journal of Hydrology, 626: 130222.
DOI URL |
| [22] | ZHU X, PEI Y, ZHENG Z, et al., 2018. Underestimates of grassland gross primary production in MODIS standard products[J]. Remote Sensing, 10(11): 1771. |
| [23] |
艾则孜提约麦尔·麦麦提, 玉素甫江·如素力, 何辉, 等, 2019. 2000-2017年新疆天山植被水分利用效率时空特征及其与气候因子关系分析[J]. 植物生态学报, 43(6): 490-500.
DOI |
|
MAIMAITI A, RUSULI Y, HE H, et al., 2019. Spatio-temporal characteristics of vegetation water use efficiency and its relationship with climate factors in Tianshan Mountains in Xinjiang from 2000 to 2017[J]. Chinese Journal of Plant Ecology, 43(6): 490-500.
DOI |
|
| [24] | 曹丽君, 2021. 新疆天山植被物候时空变化及其对气候变化的响应[D]. 乌鲁木齐: 新疆师范大学. |
| CAO L J, 2021. Spatiotemporal variation of vegetation phenology and its response to climate change in the Tianshan Mountains, Xinjiang[D]. Urumqi: Xinjiang Normal University. | |
| [25] | 陈武迪, 刘晓煌, 李洪宇, 等, 2024. 新疆天山1990-2050年生态系统服务功能及安全格局[J]. 中国地质, 51(5): 1644-1663. |
| CHEN W D, LIU X H, LI H Y, et al., 2024. Ecosystem service function and security pattern of Tianshan Mountains in Xinjiang from 1990 to 2050[J]. Geology in China, 51(5): 1644-1663. | |
| [26] | 陈秀妍, 2018. 2000-2016年中亚天山植被动态变化及其驱动因素研究[D]. 北京: 中国科学院大学(中国科学院遥感与数字地球研究所). |
| CHEN X Y, 2018. Vegetation dynamics and its driving factors during 2000 to 2016 in Tian Shan, Central Asia[D]. Beijing: Institute of Remote Sensing and Digital Earth, Chinese Academy of Sciences. | |
| [27] | 范君, 2023. 北疆草地覆盖度和净初级生产力的时空变化及退化分析[D]. 乌鲁木齐: 新疆农业大学. |
| FAN J, 2023. Spatio-temporal variation and degradation analysis of grassland coverage and net primary productivity in north Xinjiang[D]. Urumqi: Xinjiang Agricultural University. | |
| [28] | 高军, 2019. 天山北坡植被净初级生产力时空分布特征及影响因素分析[D]. 石河子: 石河子大学. |
| GAO J, 2019. Characteristics and Influencing Factors of Vegetation Net Primary Productivity in the Northern Slope of Tianshan Mountains[D]. Shihezi: Shihezi University. | |
| [29] | 胡子瑛, 周俊菊, 张利利, 等, 2018. 中国北方气候干湿变化及干旱演变特征[J]. 生态学报, 38(6): 1908-1919. |
| HU Z Y, ZHOU J J, ZHANG L L, et al., 2018. Climate dry-wet change and drought evolution characteristics of different dry-wet areas in northern China[J]. Acta Ecologica Sinica, 38(6): 1908-1919. | |
| [30] | 胡汝骥, 2004. 中国天山自然地理[M]. 北京: 中国环境科学出版社. |
| HU R J, 2004. Physical geography of the Tianshan Mountains in China[M]. Beijing: China Environmental Science Press. | |
| [31] | 刘卫国, 2007. 新疆陆地生态系统净初级生产力和碳时空变化研究[D]. 乌鲁木齐: 新疆大学. |
| LIU W G, 2007. Research of Carbon and NPP Change of the land Ecosystem in Xingjiang[D]. Urumqi: Xinjiang University. | |
| [32] | 娄安如, 周国法, 2001. 天山中段主要植被类型中种群的空间分布格局与环境的关系[J]. 植物生态学报, 25(4): 385-391. |
| LOU A R, ZHOU G F, 2001. Relationships between environment and spatial pattern of vegetation types in the mid Tianshan Mountains[J]. Chinese Journal of Plant Ecology, 25(4): 385-391. | |
| [33] | 潘竟虎, 文岩, 2015. 中国西北干旱区植被碳汇估算及其时空格局[J]. 生态学报, 35(23): 7718-7728. |
| PAN J H, WEN Y, 2015. Estimation and spatial-temporal characteristics of carbon sink in the arid region of northwest China[J]. Acta Ecologica Sinica, 35(23): 7718-7728. | |
| [34] | 曲学斌, 李丹, 田野, 等, 2024. 2001-2021年呼伦贝尔地区净生态系统生产力分布及其与气温和降水的关系[J]. 气象与环境学报, 40(4): 100-106. |
| QU X B, LI D, TIAN Y, et al., 2024. Distribution of net ecosystem productivity in the Hulunbuir region from 2001 to 2021 and its relationship with temperature and precipitation[J]. Journal of Meteorology and Environment, 40(4): 100-106. | |
| [35] | 孙聪, 于佩鑫, 温倩倩, 等, 2024. 全球陆地生态系统净生态系统生产力估算[J]. 中国环境监测, 40(6): 11-20. |
| SUN C, YU P X, WEN Q Q, et al., 2024. Estimation of net ecosystem productivity of global terrestrial ecosystems[J]. Environmental Monitoring in China, 40(6): 11-20. | |
| [36] |
邬晓丹, 罗敏, 孟凡浩, 等, 2022. 气候暖湿化背景下新疆极端气候事件时空演变特征分析[J]. 干旱区研究, 39(6): 1695-1705.
DOI |
|
WU X D, LUO M, MENG F H, et al., 2022. New characteristics of spatio-temporal evolution of extreme climate events in Xinjiang under the background of warm and humid climate[J]. Arid Zone Research, 39(6): 1695-1705.
DOI |
|
| [37] | 许世贤, 王新军, 2022. 天山北坡中段地区土壤侵蚀敏感性评价及影响因素分析[J]. 农业与技术, 42(12): 95-100. |
| XU S X, WANG X J, 2022. Soil erosion sensitivity assessment and influencing factors analysis in the middle section of northern slope of Tianshan Mountains[J]. Agriculture and Technology, 42(12): 95-100. | |
| [38] | 杨静, 黄秉光, 黄玫, 等, 2017. 近55 a新疆净生态系统生产力对气候变化的响应[J]. 干旱区地理, 40(5): 1054-1060. |
| YANG J, HUANG B G, HUANG M, et al., 2017. Responses of net ecosystem productivity to climate change in Xinjiang in recent 55 years[J]. Arid Land Geography, 40(5): 1054-1060. | |
| [39] | 袁子玥, 2024. 新疆伊犁河流域极端气候特征及其与植被生产力关系分析[D]. 呼和浩特: 内蒙古农业大学. |
| YUAN Z Y, 2024. Analysis of Extreme Climate Characteristics and its Relationship with Vegetation Productivity in Yili River Basin, Xinjiang[D]. Hohhot: Inner Mongolia Agricultural University. | |
| [40] | 张辉, 2022. 基于多源遥感数据的内蒙古植被长势变化监测及其气候影响要素研究[D]. 南京: 南京信息工程大学. |
| ZHANG H, 2022. Monitoring vegetation growth dynamics in inner mongolia using multi-source remote sensing data and study on climatic influencing factors[D]. Nanjing: Nanjing University of Information Science and Technology. | |
| [41] | 张璐, 王静, 施润和, 2015. 2000-2010年东北三省碳源汇时空动态遥感研究[J]. 华东师范大学学报(自然科学版) (4): 164-173. |
| ZHANG L, WANG J, SHI R H, 2015. Temporal-spatial variations of carbon sink/source in northeast China from 2000 to 2010[J]. Journal of East China Normal University (Natural Science) (4): 164-173. | |
| [42] | 张新时, 2007. 中华人民共和国植被图 (1꞉1000000)[M]. 北京: 地质出版社. |
| ZHANG X S, 2007. Vegetation map of the People’s Republic of China (1꞉1000000)[M]. Beijing: Geological Publishing House. | |
| [43] | 张永, 2023. 气候变化背景下1980s以来天山垂直植被带变迁和土壤碳储量研究[D]. 兰州: 兰州大学. |
| ZHANG Y, 2023. Variations in altitudinal vegetation belt and soil carbon stock in the Tianshan Mountains since the 1980s in the context of climate[D]. Lanzhou: Lanzhou University. | |
| [44] | 张祯祺, 蔡惠文, 张平平, 等, 2023. 基于GEE遥感云平台的三江源植被碳源/汇时空变化研究[J]. 自然资源遥感, 35(1): 231-242. |
| ZHANG Z Q, CAI H W, ZHANG P P, et al., 2023. A GEE-based study on the temporal and spatial variations in the carbon source/sink function of vegetation in the Three-River Headwaters region[J]. Remote Sensing for Natural Resources, 35(1): 231-242. | |
| [45] | 周波涛, 钱进, 2021. IPCC AR6报告解读: 极端天气气候事件变化[J]. 气候变化研究进展, 17(6): 713-718. |
| ZHOU B T, QIAN J, 2021. Interpretation of IPCC AR6 report: changes in extreme weather and climate events[J]. Progress in Climate Change Research, 17(6): 713-718. |
| Viewed | ||||||
|
Full text |
|
|||||
|
Abstract |
|
|||||
Copyright © 2021 Editorial Office of ACTA PETROLEI SINICA
Address:No. 6 Liupukang Street, Xicheng District, Beijing, P.R.China, 510650
Tel: 86-010-62067128, 86-010-62067137, 86-010-62067139
Fax: 86-10-62067130
Email: syxb@cnpc.com.cn
Support byBeijing Magtech Co.ltd, E-mail:support@magtech.com.cn