Ecology and Environment ›› 2024, Vol. 33 ›› Issue (12): 1882-1890.DOI: 10.16258/j.cnki.1674-5906.2024.12.006
• Research Article [Environmental Science] • Previous Articles Next Articles
ZHANG Mengshen1,2( ), CHEN Zhihui3,*(), XU Min1, JIA Shiguo4, TIAN Shili5, Li Jiawei1, HU Bo1, PAN Yuepeng1,*()
Received:2024-05-13
Online:2024-12-18
Published:2025-01-03
Contact:
CHEN Zhihui,PAN Yuepeng
张孟燊1,2(), 陈志辉3,*(), 徐敏1, 贾世国4, 田世丽5, 李嘉伟1, 胡波1, 潘月鹏1,*()
通讯作者:
陈志辉,潘月鹏
作者简介:张孟燊(1998年生),男,硕士研究生,主要从事大气污染物排放与沉降研究。E-mail: zhangmengshen20@ucas.mails.ac.cn
基金资助:CLC Number:
ZHANG Mengshen, CHEN Zhihui, XU Min, JIA Shiguo, TIAN Shili, Li Jiawei, HU Bo, PAN Yuepeng. Size-resolved Aerosol Dry Deposition and Chemical Composition during Haze Weather in Beijing, China[J]. Ecology and Environment, 2024, 33(12): 1882-1890.
张孟燊, 陈志辉, 徐敏, 贾世国, 田世丽, 李嘉伟, 胡波, 潘月鹏. 不同污染天气下大气颗粒物及化学成分干沉降通量的粒径演变特征[J]. 生态环境学报, 2024, 33(12): 1882-1890.
Add to citation manager EndNote|Ris|BibTeX
URL: https://www.jeesci.com/EN/10.16258/j.cnki.1674-5906.2024.12.006
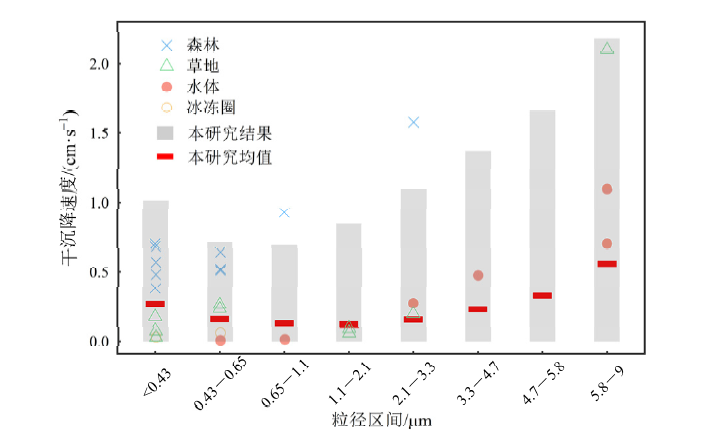
Figure 1 Size distribution of aerosol dry deposition velocity from January to February 2013 in this study (urban surface) and that reported in previous studies (other surfaces)
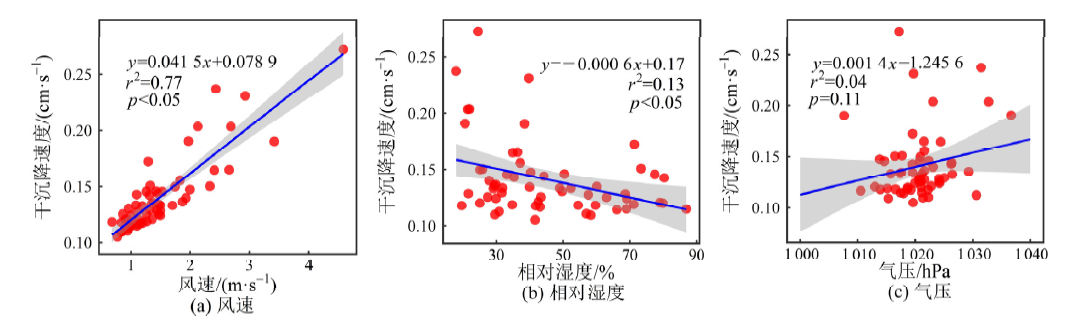
Figure 2 Correlation analysis of meteorological factor and particulate dry deposition velocity
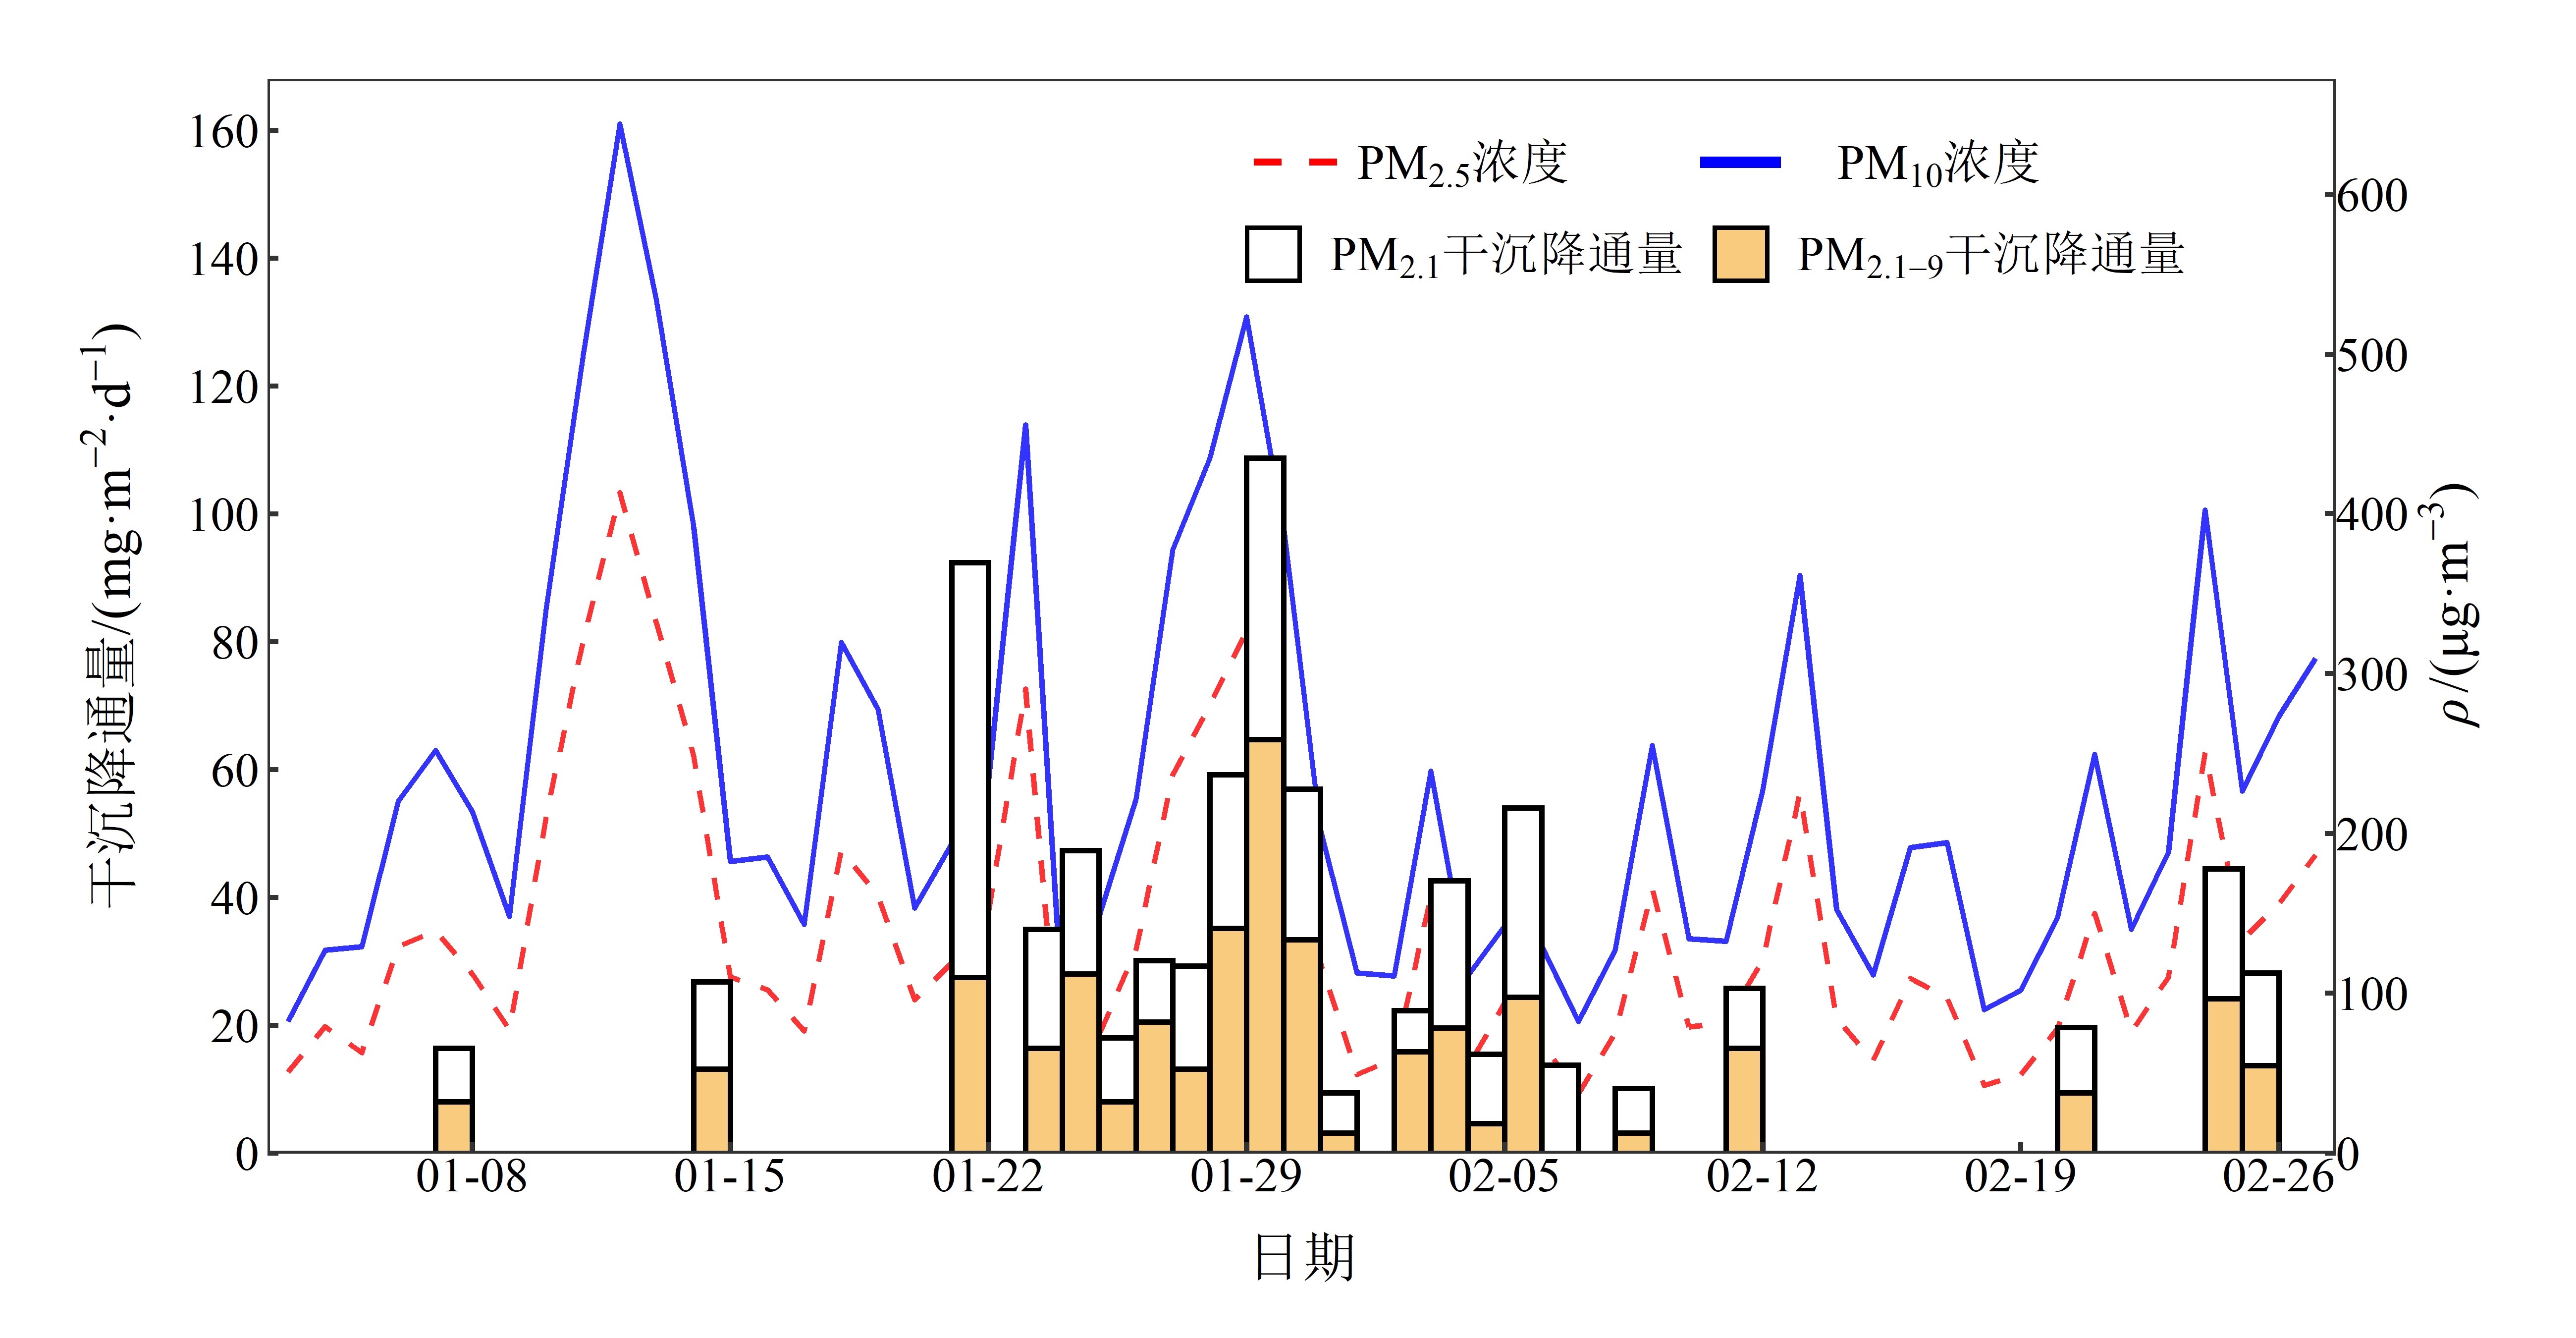
Figure 3 Daily variations of concentrations and dry deposition flux of size-resolved particulate matter during January and February 2013
| 颗粒物类型 | 观测时间 (年-月-年-月) | 研究地区 | 下垫面类型 | 干沉降通量/(mg·m−2·d−1) | 参考文献 |
|---|---|---|---|---|---|
| PM10 | 2001-09-2002-06 | 美国 | 城市 | 9.86 | Yi et al., |
| PM10 | 2010-09-2011-12 | 伊朗 | 城市 | 159.37±15.29 | Javid et al., |
| PM10 | 2009-02-2011-06 | 西班牙 | 城市 | 25.0±0.3 | López-García et al., |
| PM10 | 2001-11-2002-10 | 中国 (青岛) | 城市 | 130 | 张仁健等, |
| PM2.5 | 2014-04-2014-09 | 中国 (北京) | 水体 | 27.648 | Sun et al., |
| PM2.5 | 2014-04-2014-09 | 中国 (北京) | 森林 | 99.36 | Sun et al., |
| PM2.5 | 2013-04-2014-03 | 中国 (北京) | 森林 | 79.49±56.16 | Liu et al., |
| PM2.5 | 2013-04-2014-03 | 中国 (北京) | 水体 | 6.91±7.78 | Liu et al., |
| PM2.5 | 2013-12-2014-11 | 中国 (北京) | 城市 | 23.01 | 姚利等, |
| PM2.5 | 2013-12-2014-11 | 中国 (北京) | 城市 | 41.37 | 姚利等, |
| PM2.1 | 2013-01-2013-02 | 中国 (北京) | 城市 | 18.34±13.74 | 本研究 |
| PM9 | 2013-01-2013-02 | 中国 (北京) | 城市 | 36.65±25.61 | 本研究 |
Table 1 Comparison of particulate matter dry deposition from different regions
| 颗粒物类型 | 观测时间 (年-月-年-月) | 研究地区 | 下垫面类型 | 干沉降通量/(mg·m−2·d−1) | 参考文献 |
|---|---|---|---|---|---|
| PM10 | 2001-09-2002-06 | 美国 | 城市 | 9.86 | Yi et al., |
| PM10 | 2010-09-2011-12 | 伊朗 | 城市 | 159.37±15.29 | Javid et al., |
| PM10 | 2009-02-2011-06 | 西班牙 | 城市 | 25.0±0.3 | López-García et al., |
| PM10 | 2001-11-2002-10 | 中国 (青岛) | 城市 | 130 | 张仁健等, |
| PM2.5 | 2014-04-2014-09 | 中国 (北京) | 水体 | 27.648 | Sun et al., |
| PM2.5 | 2014-04-2014-09 | 中国 (北京) | 森林 | 99.36 | Sun et al., |
| PM2.5 | 2013-04-2014-03 | 中国 (北京) | 森林 | 79.49±56.16 | Liu et al., |
| PM2.5 | 2013-04-2014-03 | 中国 (北京) | 水体 | 6.91±7.78 | Liu et al., |
| PM2.5 | 2013-12-2014-11 | 中国 (北京) | 城市 | 23.01 | 姚利等, |
| PM2.5 | 2013-12-2014-11 | 中国 (北京) | 城市 | 41.37 | 姚利等, |
| PM2.1 | 2013-01-2013-02 | 中国 (北京) | 城市 | 18.34±13.74 | 本研究 |
| PM9 | 2013-01-2013-02 | 中国 (北京) | 城市 | 36.65±25.61 | 本研究 |
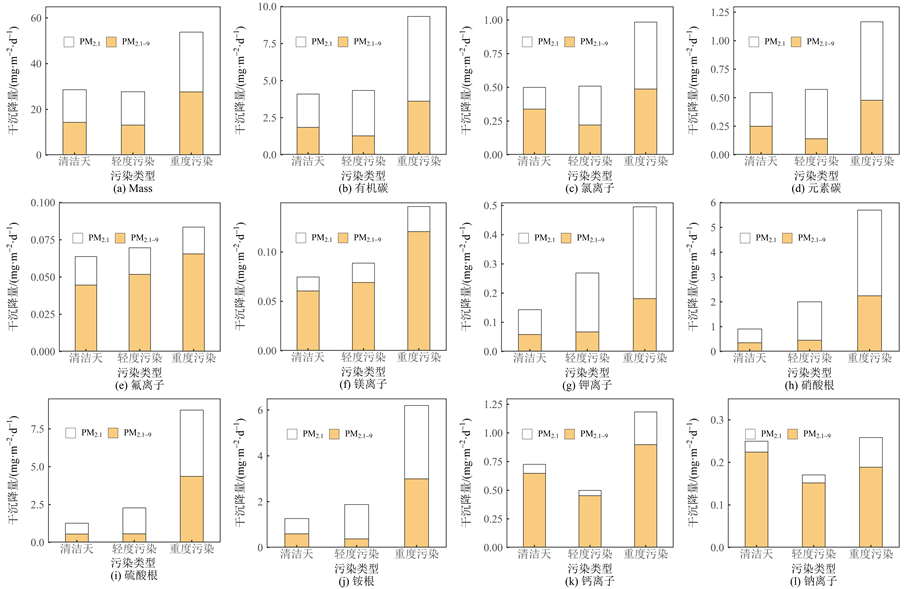
Figure 4 Variations of dry deposition of particulate matter and chemical compositions under different weather conditions
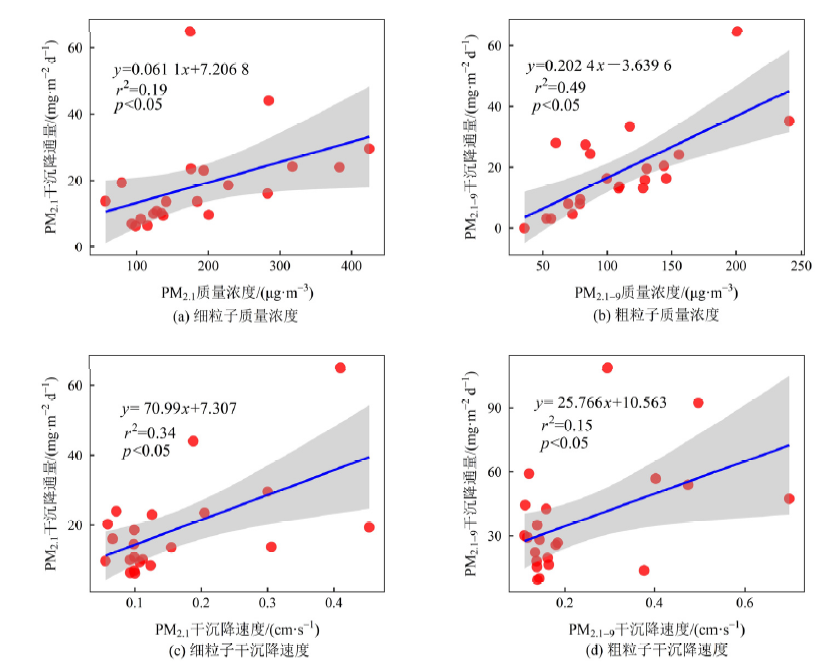
Figure 5 Particulate dry deposition flux versus concentration and dry deposition velocity
| 天气类型 | 颗粒物类型 | 指标 | Mass | NH4+ | NO3− | SO42- | Cl− | K+ | Mg2+ | F− | Na+ | Ca2+ | OC | EC |
|---|---|---|---|---|---|---|---|---|---|---|---|---|---|---|
| 清洁天 | PM1.1 | Avg | 10.11 | 0.36 | 0.30 | 0.37 | 0.10 | 0.05 | 0.01 | 0.01 | 0.02 | 0.05 | 1.44 | 0.17 |
| Sd | 4.22 | 0.12 | 0.22 | 0.24 | 0.13 | 0.02 | 0.01 | 0.01 | 0.02 | 0.07 | 1.18 | 0.19 | ||
| Max | 13.80 | 0.50 | 0.54 | 0.66 | 0.28 | 0.07 | 0.02 | 0.02 | 0.05 | 0.14 | 3.19 | 0.45 | ||
| Min | 4.49 | 0.24 | 0.00 | 0.09 | 0.00 | 0.02 | 0.00 | 0.00 | 0.00 | 0.00 | 0.61 | 0.05 | ||
| PM2.1 | Avg | 12.56 | 0.50 | 0.41 | 0.53 | 0.12 | 0.06 | 0.01 | 0.01 | 0.02 | 0.06 | 1.68 | 0.22 | |
| Sd | 5.47 | 0.25 | 0.30 | 0.37 | 0.15 | 0.02 | 0.01 | 0.01 | 0.03 | 0.08 | 1.49 | 0.24 | ||
| Max | 19.33 | 0.84 | 0.71 | 0.87 | 0.34 | 0.09 | 0.02 | 0.02 | 0.06 | 0.16 | 3.89 | 0.58 | ||
| Min | 6.28 | 0.27 | 0.00 | 0.10 | 0.00 | 0.03 | 0.00 | 0.00 | 0.00 | 0.00 | 0.63 | 0.07 | ||
| PM2.1‒9 | Avg | 8.96 | 0.45 | 0.27 | 0.41 | 0.25 | 0.04 | 0.05 | 0.03 | 0.17 | 0.48 | 1.38 | 0.19 | |
| Sd | 12.87 | 0.47 | 0.34 | 0.50 | 0.33 | 0.05 | 0.04 | 0.03 | 0.22 | 0.37 | 1.33 | 0.12 | ||
| Max | 28.03 | 1.14 | 0.77 | 1.11 | 0.73 | 0.12 | 0.11 | 0.07 | 0.48 | 0.98 | 3.37 | 0.33 | ||
| Min | 0.00 | 0.13 | 0.00 | 0.00 | 0.00 | 0.00 | 0.00 | 0.01 | 0.00 | 0.14 | 0.58 | 0.04 | ||
| 轻度污染天 | PM1.1 | Avg | 10.16 | 0.91 | 0.95 | 0.97 | 0.18 | 0.12 | 0.01 | 0.01 | 0.01 | 0.03 | 1.89 | 0.26 |
| Sd | 6.52 | 0.51 | 0.72 | 0.60 | 0.07 | 0.11 | 0.01 | 0.01 | 0.01 | 0.04 | 0.72 | 0.12 | ||
| Max | 22.73 | 2.13 | 2.79 | 2.39 | 0.30 | 0.39 | 0.03 | 0.03 | 0.04 | 0.10 | 3.53 | 0.47 | ||
| Min | 4.51 | 0.43 | 0.41 | 0.46 | 0.08 | 0.05 | 0.00 | 0.00 | 0.00 | 0.00 | 1.17 | 0.12 | ||
| PM2.1 | Avg | 13.08 | 1.12 | 1.15 | 1.28 | 0.22 | 0.15 | 0.01 | 0.01 | 0.01 | 0.03 | 2.29 | 0.32 | |
| Sd | 7.96 | 0.61 | 0.83 | 0.77 | 0.08 | 0.12 | 0.01 | 0.01 | 0.01 | 0.04 | 0.81 | 0.14 | ||
| Max | 29.61 | 2.51 | 3.20 | 2.94 | 0.34 | 0.45 | 0.03 | 0.03 | 0.04 | 0.13 | 4.07 | 0.56 | ||
| Min | 6.43 | 0.49 | 0.50 | 0.58 | 0.10 | 0.07 | 0.00 | 0.01 | 0.00 | 0.00 | 1.42 | 0.18 | ||
| PM2.1‒9 | Avg | 13.14 | 0.28 | 0.34 | 0.42 | 0.16 | 0.05 | 0.05 | 0.04 | 0.11 | 0.34 | 0.95 | 0.10 | |
| Sd | 6.64 | 0.16 | 0.24 | 0.19 | 0.17 | 0.04 | 0.02 | 0.02 | 0.10 | 0.18 | 0.39 | 0.06 | ||
| Max | 24.44 | 0.58 | 0.67 | 0.71 | 0.54 | 0.15 | 0.09 | 0.10 | 0.35 | 0.67 | 1.67 | 0.21 | ||
| Min | 3.19 | 0.13 | 0.07 | 0.17 | 0.00 | 0.01 | 0.03 | 0.02 | 0.01 | 0.11 | 0.30 | 0.03 | ||
| 重度污染天 | PM1.1 | Avg | 16.30 | 1.48 | 1.65 | 1.63 | 0.26 | 0.16 | 0.01 | 0.01 | 0.04 | 0.20 | 2.73 | 0.42 |
| Sd | 7.88 | 1.10 | 1.24 | 1.25 | 0.13 | 0.16 | 0.02 | 0.01 | 0.02 | 0.30 | 2.29 | 0.29 | ||
| Max | 30.36 | 3.86 | 4.52 | 4.41 | 0.47 | 0.55 | 0.06 | 0.03 | 0.08 | 0.92 | 8.34 | 0.97 | ||
| Min | 7.44 | 0.55 | 0.71 | 0.52 | 0.11 | 0.03 | 0.00 | 0.00 | 0.01 | 0.00 | 1.14 | 0.14 | ||
| PM2.1 | Avg | 26.17 | 2.39 | 2.58 | 3.27 | 0.37 | 0.23 | 0.02 | 0.01 | 0.05 | 0.21 | 4.27 | 0.51 | |
| Sd | 17.43 | 1.97 | 2.10 | 2.97 | 0.18 | 0.20 | 0.02 | 0.01 | 0.03 | 0.32 | 4.18 | 0.32 | ||
| Max | 64.90 | 6.57 | 7.19 | 9.61 | 0.70 | 0.67 | 0.06 | 0.04 | 0.12 | 1.00 | 14.63 | 1.11 | ||
| Min | 9.68 | 0.70 | 0.89 | 0.73 | 0.13 | 0.05 | 0.00 | 0.00 | 0.01 | 0.00 | 1.34 | 0.22 | ||
| PM2.1-9 | Avg | 27.64 | 2.24 | 1.68 | 3.26 | 0.36 | 0.14 | 0.09 | 0.05 | 0.14 | 0.67 | 2.70 | 0.36 | |
| Sd | 16.04 | 2.91 | 1.40 | 3.58 | 0.13 | 0.13 | 0.04 | 0.02 | 0.08 | 0.46 | 1.79 | 0.24 | ||
| Max | 64.72 | 8.82 | 4.07 | 10.57 | 0.60 | 0.36 | 0.16 | 0.08 | 0.25 | 1.45 | 5.31 | 0.92 | ||
| Min | 13.17 | 0.27 | 0.52 | 0.56 | 0.22 | 0.01 | 0.03 | 0.02 | 0.02 | 0.18 | 0.89 | 0.13 |
Table 2 Size-resolved dry deposition flux of particulate matter and chemical compositions under different weather conditions mg·m?2·d?1
| 天气类型 | 颗粒物类型 | 指标 | Mass | NH4+ | NO3− | SO42- | Cl− | K+ | Mg2+ | F− | Na+ | Ca2+ | OC | EC |
|---|---|---|---|---|---|---|---|---|---|---|---|---|---|---|
| 清洁天 | PM1.1 | Avg | 10.11 | 0.36 | 0.30 | 0.37 | 0.10 | 0.05 | 0.01 | 0.01 | 0.02 | 0.05 | 1.44 | 0.17 |
| Sd | 4.22 | 0.12 | 0.22 | 0.24 | 0.13 | 0.02 | 0.01 | 0.01 | 0.02 | 0.07 | 1.18 | 0.19 | ||
| Max | 13.80 | 0.50 | 0.54 | 0.66 | 0.28 | 0.07 | 0.02 | 0.02 | 0.05 | 0.14 | 3.19 | 0.45 | ||
| Min | 4.49 | 0.24 | 0.00 | 0.09 | 0.00 | 0.02 | 0.00 | 0.00 | 0.00 | 0.00 | 0.61 | 0.05 | ||
| PM2.1 | Avg | 12.56 | 0.50 | 0.41 | 0.53 | 0.12 | 0.06 | 0.01 | 0.01 | 0.02 | 0.06 | 1.68 | 0.22 | |
| Sd | 5.47 | 0.25 | 0.30 | 0.37 | 0.15 | 0.02 | 0.01 | 0.01 | 0.03 | 0.08 | 1.49 | 0.24 | ||
| Max | 19.33 | 0.84 | 0.71 | 0.87 | 0.34 | 0.09 | 0.02 | 0.02 | 0.06 | 0.16 | 3.89 | 0.58 | ||
| Min | 6.28 | 0.27 | 0.00 | 0.10 | 0.00 | 0.03 | 0.00 | 0.00 | 0.00 | 0.00 | 0.63 | 0.07 | ||
| PM2.1‒9 | Avg | 8.96 | 0.45 | 0.27 | 0.41 | 0.25 | 0.04 | 0.05 | 0.03 | 0.17 | 0.48 | 1.38 | 0.19 | |
| Sd | 12.87 | 0.47 | 0.34 | 0.50 | 0.33 | 0.05 | 0.04 | 0.03 | 0.22 | 0.37 | 1.33 | 0.12 | ||
| Max | 28.03 | 1.14 | 0.77 | 1.11 | 0.73 | 0.12 | 0.11 | 0.07 | 0.48 | 0.98 | 3.37 | 0.33 | ||
| Min | 0.00 | 0.13 | 0.00 | 0.00 | 0.00 | 0.00 | 0.00 | 0.01 | 0.00 | 0.14 | 0.58 | 0.04 | ||
| 轻度污染天 | PM1.1 | Avg | 10.16 | 0.91 | 0.95 | 0.97 | 0.18 | 0.12 | 0.01 | 0.01 | 0.01 | 0.03 | 1.89 | 0.26 |
| Sd | 6.52 | 0.51 | 0.72 | 0.60 | 0.07 | 0.11 | 0.01 | 0.01 | 0.01 | 0.04 | 0.72 | 0.12 | ||
| Max | 22.73 | 2.13 | 2.79 | 2.39 | 0.30 | 0.39 | 0.03 | 0.03 | 0.04 | 0.10 | 3.53 | 0.47 | ||
| Min | 4.51 | 0.43 | 0.41 | 0.46 | 0.08 | 0.05 | 0.00 | 0.00 | 0.00 | 0.00 | 1.17 | 0.12 | ||
| PM2.1 | Avg | 13.08 | 1.12 | 1.15 | 1.28 | 0.22 | 0.15 | 0.01 | 0.01 | 0.01 | 0.03 | 2.29 | 0.32 | |
| Sd | 7.96 | 0.61 | 0.83 | 0.77 | 0.08 | 0.12 | 0.01 | 0.01 | 0.01 | 0.04 | 0.81 | 0.14 | ||
| Max | 29.61 | 2.51 | 3.20 | 2.94 | 0.34 | 0.45 | 0.03 | 0.03 | 0.04 | 0.13 | 4.07 | 0.56 | ||
| Min | 6.43 | 0.49 | 0.50 | 0.58 | 0.10 | 0.07 | 0.00 | 0.01 | 0.00 | 0.00 | 1.42 | 0.18 | ||
| PM2.1‒9 | Avg | 13.14 | 0.28 | 0.34 | 0.42 | 0.16 | 0.05 | 0.05 | 0.04 | 0.11 | 0.34 | 0.95 | 0.10 | |
| Sd | 6.64 | 0.16 | 0.24 | 0.19 | 0.17 | 0.04 | 0.02 | 0.02 | 0.10 | 0.18 | 0.39 | 0.06 | ||
| Max | 24.44 | 0.58 | 0.67 | 0.71 | 0.54 | 0.15 | 0.09 | 0.10 | 0.35 | 0.67 | 1.67 | 0.21 | ||
| Min | 3.19 | 0.13 | 0.07 | 0.17 | 0.00 | 0.01 | 0.03 | 0.02 | 0.01 | 0.11 | 0.30 | 0.03 | ||
| 重度污染天 | PM1.1 | Avg | 16.30 | 1.48 | 1.65 | 1.63 | 0.26 | 0.16 | 0.01 | 0.01 | 0.04 | 0.20 | 2.73 | 0.42 |
| Sd | 7.88 | 1.10 | 1.24 | 1.25 | 0.13 | 0.16 | 0.02 | 0.01 | 0.02 | 0.30 | 2.29 | 0.29 | ||
| Max | 30.36 | 3.86 | 4.52 | 4.41 | 0.47 | 0.55 | 0.06 | 0.03 | 0.08 | 0.92 | 8.34 | 0.97 | ||
| Min | 7.44 | 0.55 | 0.71 | 0.52 | 0.11 | 0.03 | 0.00 | 0.00 | 0.01 | 0.00 | 1.14 | 0.14 | ||
| PM2.1 | Avg | 26.17 | 2.39 | 2.58 | 3.27 | 0.37 | 0.23 | 0.02 | 0.01 | 0.05 | 0.21 | 4.27 | 0.51 | |
| Sd | 17.43 | 1.97 | 2.10 | 2.97 | 0.18 | 0.20 | 0.02 | 0.01 | 0.03 | 0.32 | 4.18 | 0.32 | ||
| Max | 64.90 | 6.57 | 7.19 | 9.61 | 0.70 | 0.67 | 0.06 | 0.04 | 0.12 | 1.00 | 14.63 | 1.11 | ||
| Min | 9.68 | 0.70 | 0.89 | 0.73 | 0.13 | 0.05 | 0.00 | 0.00 | 0.01 | 0.00 | 1.34 | 0.22 | ||
| PM2.1-9 | Avg | 27.64 | 2.24 | 1.68 | 3.26 | 0.36 | 0.14 | 0.09 | 0.05 | 0.14 | 0.67 | 2.70 | 0.36 | |
| Sd | 16.04 | 2.91 | 1.40 | 3.58 | 0.13 | 0.13 | 0.04 | 0.02 | 0.08 | 0.46 | 1.79 | 0.24 | ||
| Max | 64.72 | 8.82 | 4.07 | 10.57 | 0.60 | 0.36 | 0.16 | 0.08 | 0.25 | 1.45 | 5.31 | 0.92 | ||
| Min | 13.17 | 0.27 | 0.52 | 0.56 | 0.22 | 0.01 | 0.03 | 0.02 | 0.02 | 0.18 | 0.89 | 0.13 |
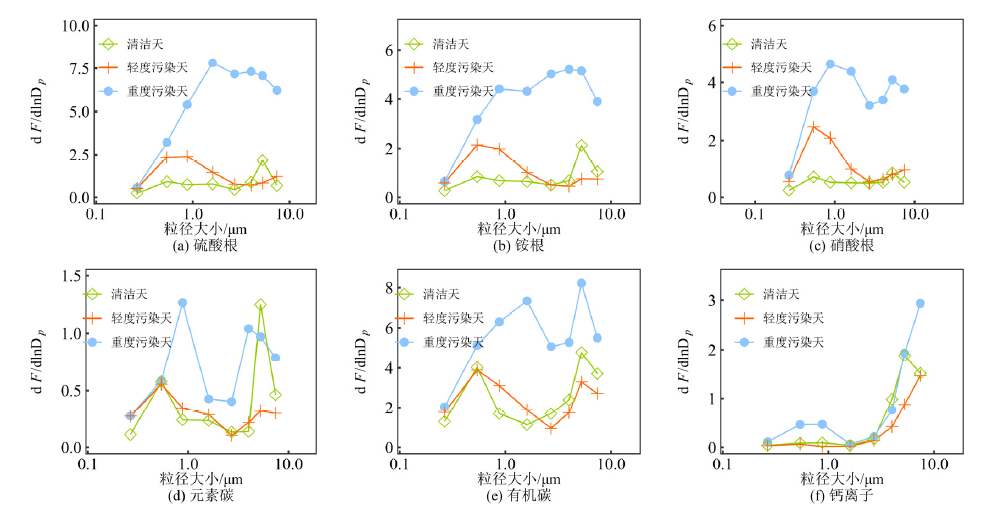
Figure 6 Size distribution of dry deposition flux for major components of particulate matter under different weather conditions (January 2013)
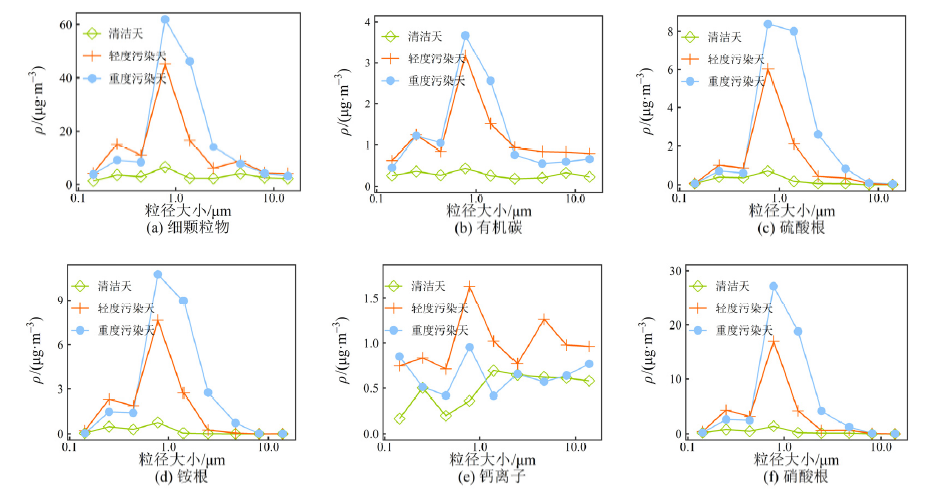
Figure 7 Size distribution of concentration for particulate matter and chemical components under different weather conditions (January 2022)
| [1] | AKIMOTO H, SATO K, SASE H, et al., 2022. Development of science and policy related to acid deposition in East Asia over 30 years[J]. Ambio, 51(8): 1800-1818. |
| [2] | CHANG M, CAO J C, MA M R, et al., 2020. Dry deposition of reactive nitrogen to different ecosystems across Eastern China: A comparison of three community models[J]. Science of the Total Environment, 720: 137548. |
| [3] | CONNAN O, PELLERIN G, MARO D, et al., 2018. Dry deposition velocities of particles on grass: Field experimental data and comparison with models[J]. Journal of Aerosol Science, 123(21): 58-67. |
| [4] | CONTINI D, DONATEO A, BELOSI F, et al., 2010. Deposition velocity of ultrafine particles measured with the Eddy‐Correlation Method over the Nansen Ice Sheet (Antarctica)[J]. Journal of Geophysical Research: Atmospheres, 115(D16): 013600. |
| [5] | DONG H Y, KANG X Y, DENG S X, et al., 2023. Dry and wet deposition fluxes and source of atmospheric Mercury in the forest in Southeast China[J]. Sustainability, 15(4): 3213. |
| [6] | EMERSON E W, KATICH J M, SCHWARZ J P, et al., 2018. Direct measurements of dry and wet deposition of black carbon over a grassland[J]. Journal of Geophysical Research: Atmospheres, 123(21): 12277-12290. |
| [7] | FAGERLI H, AAS W, 2008. Trends of nitrogen in air and precipitation: Model results and observations at EMEP sites in Europe, 1980-2003[J]. Environmental Pollution, 154(3): 448-461. |
| [8] | FARMER D K, BOEDICKER E K, DEBOLT H M, 2021. Dry deposition of atmospheric aerosols: Approaches, observations, and mechanisms[J]. Annual Review of Physical Chemistry, 72(1): 375-397. |
| [9] | JAVID M, BAHRAMIFAR N, YOUNESI H, et al., 2015. Dry deposition, seasonal variation and source interpretation of ionic species at Abali, Firouzkouh and Varamin, Tehran Province, Iran[J]. Atmospheric Research, 13(1): 74-90. |
| [10] | LAMB D, BOWERSOX V, 2000. The national atmospheric deposition program: An overview[J]. Atmospheric Environment, 34(11): 1661-1663. |
| [11] | LAVI A, FARMER D K, SEGRE E, et al., 2013. Fluxes of fine particles over a semi-arid pine forest: Possible effects of a complex terrain[J]. Aerosol Science and Technology, 47(8): 906-915. |
| [12] | LIU J K, ZHU L J, WANG H H, et al., 2016. Dry deposition of particulate matter at an urban forest, wetland and lake surface in Beijing[J]. Atmospheric Environment, 125(Part A): 178-187. |
| [13] | LÓPEZ-GARCÍA P, GELADO-CABALLERO M D, SANTANA- CASTELLANO D, et al., 2013. A three-year time-series of dust deposition flux measurements in Gran Canaria, Spain: A comparison of wet and dry surface deposition samplers[J]. Atmospheric Environment, 79: 689-694. |
| [14] | MACDONALD K M, SHARMA S, TOOM D, et al., 2017. Observations of atmospheric chemical deposition to high Arctic snow[J]. Atmospheric Chemistry and Physics, 17(9): 5775-5788. |
| [15] | MAMUN A A, CHENG I, ZHANG L, et al., 2019. Overview of size distribution, concentration, and dry deposition of airborne particulate elements measured worldwide[J]. Environmental Reviews, 28(1): 77-78. |
| [16] | MOHAN S, 2015. An overview of particulate dry deposition: measuring methods, deposition velocity and controlling factors[J]. International Journal of Environmental Science and Technology, 13(1): 387-402. |
| [17] | PAN Y, LIU B, CAO J, et al., 2021. Enhanced atmospheric phosphorus deposition in Asia and Europe in the past two decades[J]. Atmospheric and Oceanic Science Letters, 14(5): 10-14. |
| [18] | PAN Y, WANG Y, TANG G, et al., 2012. Wet and dry deposition of atmospheric nitrogen at ten sites in Northern China[J]. Atmospheric Chemistry and Physics, 12(14): 6515-6535. |
| [19] | PAN Y P, WANG Y S, TANG G Q, et al., 2013. Spatial distribution and temporal variations of atmospheric sulfur deposition in Northern China: Insights into the potential acidification risks[J]. Atmospheric Chemistry and Physics, 13(3): 1675-1688. |
| [20] | PETROFF A, ZHANG L, 2010. Development and validation of a size-resolved particle dry deposition scheme for application in aerosol transport models[J]. Geoscientific Model Development, 3(2): 753-769. |
| [21] | QI J H, YU Y, YAO X H, et al., 2020. Dry deposition fluxes of inorganic nitrogen and phosphorus in atmospheric aerosols over the Marginal Seas and Northwest Pacific[J]. Atmospheric Research, 245: 105076. |
| [22] | RUIJGROK W, TIEBEN H, EISINGA P, 1997. The dry deposition of particles to a forest canopy: A comparison of model and experimental results[J]. Atmospheric Environment, 31(3): 399-415. |
| [23] | SHEPPARD L J, LEITH I D, MIZUNUMA T, et al., 2011. Dry deposition of ammonia gas drives species change faster than wet deposition of ammonium ions: Evidence from a long-term field manipulation[J]. Global Change Biology, 17(12): 3589-3607. |
| [24] | SUN K, TAO L, MILLER D J, et al., 2017. Vehicle emissions as an important urban Ammonia source in the United States and China[J]. Environmental Science & Technology, 51(4): 2472-2481. |
| [25] | TEGEN I, HARRISON S P, KOHFELD K, et al., 2002. Impact of vegetation and preferential source areas on global dust aerosol: Results from a model study[J]. Journal of Geophysical Research-Atmospheres, 107(D21): 4576. |
| [26] |
TIAN S L, PAN Y P, LIU Z R, et al., 2014. Size-resolved aerosol chemical analysis of extreme haze pollution events during early 2013 in urban Beijing, China[J]. Journal of Hazardous Materials, 279: 452-460.
DOI PMID |
| [27] | WESELY M L, 1989. Parameterization of surface resistances to gaseous dry deposition in regional-scale numerical models[J]. Atmospheric Environment, 23(6): 1293-1304. |
| [28] | YI S M, TOTTEN L A, THOTA S, et al., 2006. Atmospheric dry deposition of trace elements measured around the urban and industrially impacted NY-NJ harbor[J]. Atmospheric Environment, 40(34): 6626-6637. |
| [29] | ZHANG J, SHAO Y, HUANG N, 2014. Measurements of dust deposition velocity in a wind-tunnel experiment[J]. Atmospheric Chemistry and Physics, 14(17): 8869-8882. |
| [30] | ZHANG L M, GONG S L, PADRO J, et al., 2001. A size-segregated particle dry deposition scheme for an atmospheric aerosol module[J]. Atmospheric Environment, 35(3): 549-560. |
| [31] | 顾梦娜, 潘月鹏, 宋琳琳, 等, 2021. 2019年国庆节前后北京气态氨和气溶胶铵盐浓度的同步观测[J]. 环境科学, 42(1): 1-8. |
| GU M N, PAN Y P, SONG L L, et al., 2021. Concurrent collection of ammonia gas and aerosol ammonium in urban Beijing during national celebration days utilizing an acid-coated honeycomb denuder in combination with a filter system[J]. Environmental Science, 42(1): 1-8. | |
| [32] | 姚利, 刘进, 潘月鹏, 等, 2017. 北京大气颗粒物和重金属铅干沉降通量及季节变化[J]. 环境科学, 38(2): 423-428. |
| YAO L, LIU J, PAN Y P, et al., 2017. Atmospheric dry deposition fluxes and seasonal variations of particulate matter and lead in urban Beijing[J]. Environmental Science, 38(2): 423-428. | |
| [33] |
苏泳松, 宋松, 陈叶, 等, 2022. 珠江三角洲人类活动净氮输入时空特征及其影响因素[J]. 生态环境学报, 31(8): 1599-1609.
DOI |
| SUN Y S, SONG S, CHEN Y, et al., 2022. Temporal and spatial characteristics of net anthropogenic nitrogen input and its influencing factors in the Pearl River Delta[J]. Ecology and Environmental Sciences, 31(8): 1599-1609. | |
| [34] | 张仁健, 浦一芬, 徐永福, 等, 2004. 青岛大气气溶胶的浓度分布和干沉降的观测研究[J]. 气候与环境研究, 9(2): 390-395. |
| ZHANG R J, PU Y F, XU Y F, et al., 2004. Observation on mass concentration and dry deposition of atmospheric aerosols in Qingdao[J]. Climatic and Environmental Research, 9(2): 390-395. |
| [1] | LU Ruilin, CAO Fang, LIN Yuqi, WU Changliu, ZHANG Yanlin. Size Distribution and Source Apportionment of Chemical Compositions in Nanjing Atmospheric Particulate Matter [J]. Ecology and Environment, 2024, 33(7): 1079-1088. |
| [2] | WEI Daixiao, MEN Yatai, LI Yaojie, XU Mingyi, CAI Wenxiu, SHEN Guofeng. Environmental Health Benefits and Cost Analysis of Using Biomass Pellets for Space Heating [J]. Ecology and Environment, 2024, 33(6): 927-934. |
| [3] | ZHANG Guiqin, WANG Yunbo, DU Qiyue, YAN Huaizhong, LI Siyuan, SHI Jinghua, LIU Shijie, ZHU Wenqi, SUN Youmin. Characteristics and Emission Estimates of Carbon Components in Particulate Matter Emitted from Diesel-type Mobile Sources in Ji’nan [J]. Ecology and Environment, 2024, 33(3): 408-417. |
| [4] | ZHANG Li, LI Cheng, TAN Haoze, WEI Jiayi, CHENG Jiong, PENG Guixiang. Reduction Effect and Influencing Factors of Typical Urban Woodlands on Atmospheric Particulate Matter in Guangzhou [J]. Ecology and Environment, 2023, 32(2): 341-350. |
| [5] | FU Mengqi, LIU Juan, LI Jin, ZHANG Fan, LI Xueyao, YANG Zhengjun, LI Penghui, JIN Taosheng. Study on Carbon Emission of Different Oil Products on China Ⅳ and China Ⅴ Diesel Buses [J]. Ecology and Environment, 2022, 31(9): 1849-1855. |
| [6] | WANG Zhanyong, CHEN Xin, HU Xisheng, HE Hongdi, CAI Ming, PENG Zhongren. Mechanism and Research Methods of Roadside Green Barriers Affecting the Distribution of Atmospheric Particulate Matter: A Review [J]. Ecology and Environment, 2022, 31(5): 1047-1058. |
| [7] | ZHU Xu, LI Haimei, LI Yanhua, SUN Yingkun, TIAN Yuan. Physiological Responses of Eight Shrubs to Atmospheric Particulate Matter Pollution [J]. Ecology and Environment, 2022, 31(3): 535-545. |
| [8] | ZHAO Xiaoliang, GUO Meng, LV Meiting, ZHAO Xueying, JIANG Guiguo, HUANG Yuanyuan, WANG Fan, JI Yaqin. Study on Retention Capacity of Green Tree Species to Atmospheric Particulate Matter and Heavy Metals in Fuxin [J]. Ecology and Environment, 2021, 30(8): 1662-1671. |
| [9] | WANG Wei, ZHANG Lei. Visual Analysis of Research Progress of Fine Particles in Urban Environment Based on CiteSpace [J]. Ecology and Environment, 2021, 30(6): 1321-1332. |
| [10] | HUANG Cheng, WU Yueying, JI Hengkuan, CHEN Liming, LI Beiying, FU Chuanliang, LI Jianhong, WU Weidong, WU Zhipeng. Response of Iron Reduction Characteristics to DOM Molecular Properties under Anaerobic Conditions in Typical Paddy Soils of Hainan Island [J]. Ecology and Environment, 2021, 30(5): 957-967. |
| [11] | SUI Yanghui, GAO Jiping, WANG Yanbo, XIAO Wanxin, LIU Jing, SHI Lei, ZHAO Haiyan, ZHANG Yang. Biochar and Nitrogen Fertilizer Effects on Soil Nutrient and Root Distribution in Dryland Maize [J]. Ecology and Environment, 2021, 30(10): 2026-2032. |
| Viewed | ||||||
|
Full text |
|
|||||
|
Abstract |
|
|||||
Copyright © 2021 Editorial Office of ACTA PETROLEI SINICA
Address:No. 6 Liupukang Street, Xicheng District, Beijing, P.R.China, 510650
Tel: 86-010-62067128, 86-010-62067137, 86-010-62067139
Fax: 86-10-62067130
Email: syxb@cnpc.com.cn
Support byBeijing Magtech Co.ltd, E-mail:support@magtech.com.cn