Ecology and Environment ›› 2024, Vol. 33 ›› Issue (1): 131-143.DOI: 10.16258/j.cnki.1674-5906.2024.01.014
• Research Article • Previous Articles Next Articles
FENG Zixian1( ), SHE Lu1,*(), WANGXiuhui 2, YANG Lu1, YANG Chen1
Received:2023-07-27
Online:2024-01-18
Published:2024-03-19
Contact:
SHE Lu
冯自贤1(), 佘璐1,*(), 王秀慧2, 杨璐1, 杨晨1
通讯作者:
佘璐
作者简介:冯自贤(2000年生),男,硕士,主要从事生态环境评价与沙尘遥感监测。E-mail: 12022130980@stu.nxu.edu.cn
基金资助:CLC Number:
FENG Zixian, SHE Lu, WANGXiuhui , YANG Lu, YANG Chen. Spatial and Temporal Variations of Ecological Environment Quality in Ningxia Based on Improved Remote Sensing Ecological Index[J]. Ecology and Environment, 2024, 33(1): 131-143.
冯自贤, 佘璐, 王秀慧, 杨璐, 杨晨. 基于改进遥感生态指数的宁夏生态环境质量时空变化[J]. 生态环境学报, 2024, 33(1): 131-143.
Add to citation manager EndNote|Ris|BibTeX
URL: https://www.jeesci.com/EN/10.16258/j.cnki.1674-5906.2024.01.014

Figure 1 Geographical location of the studied area
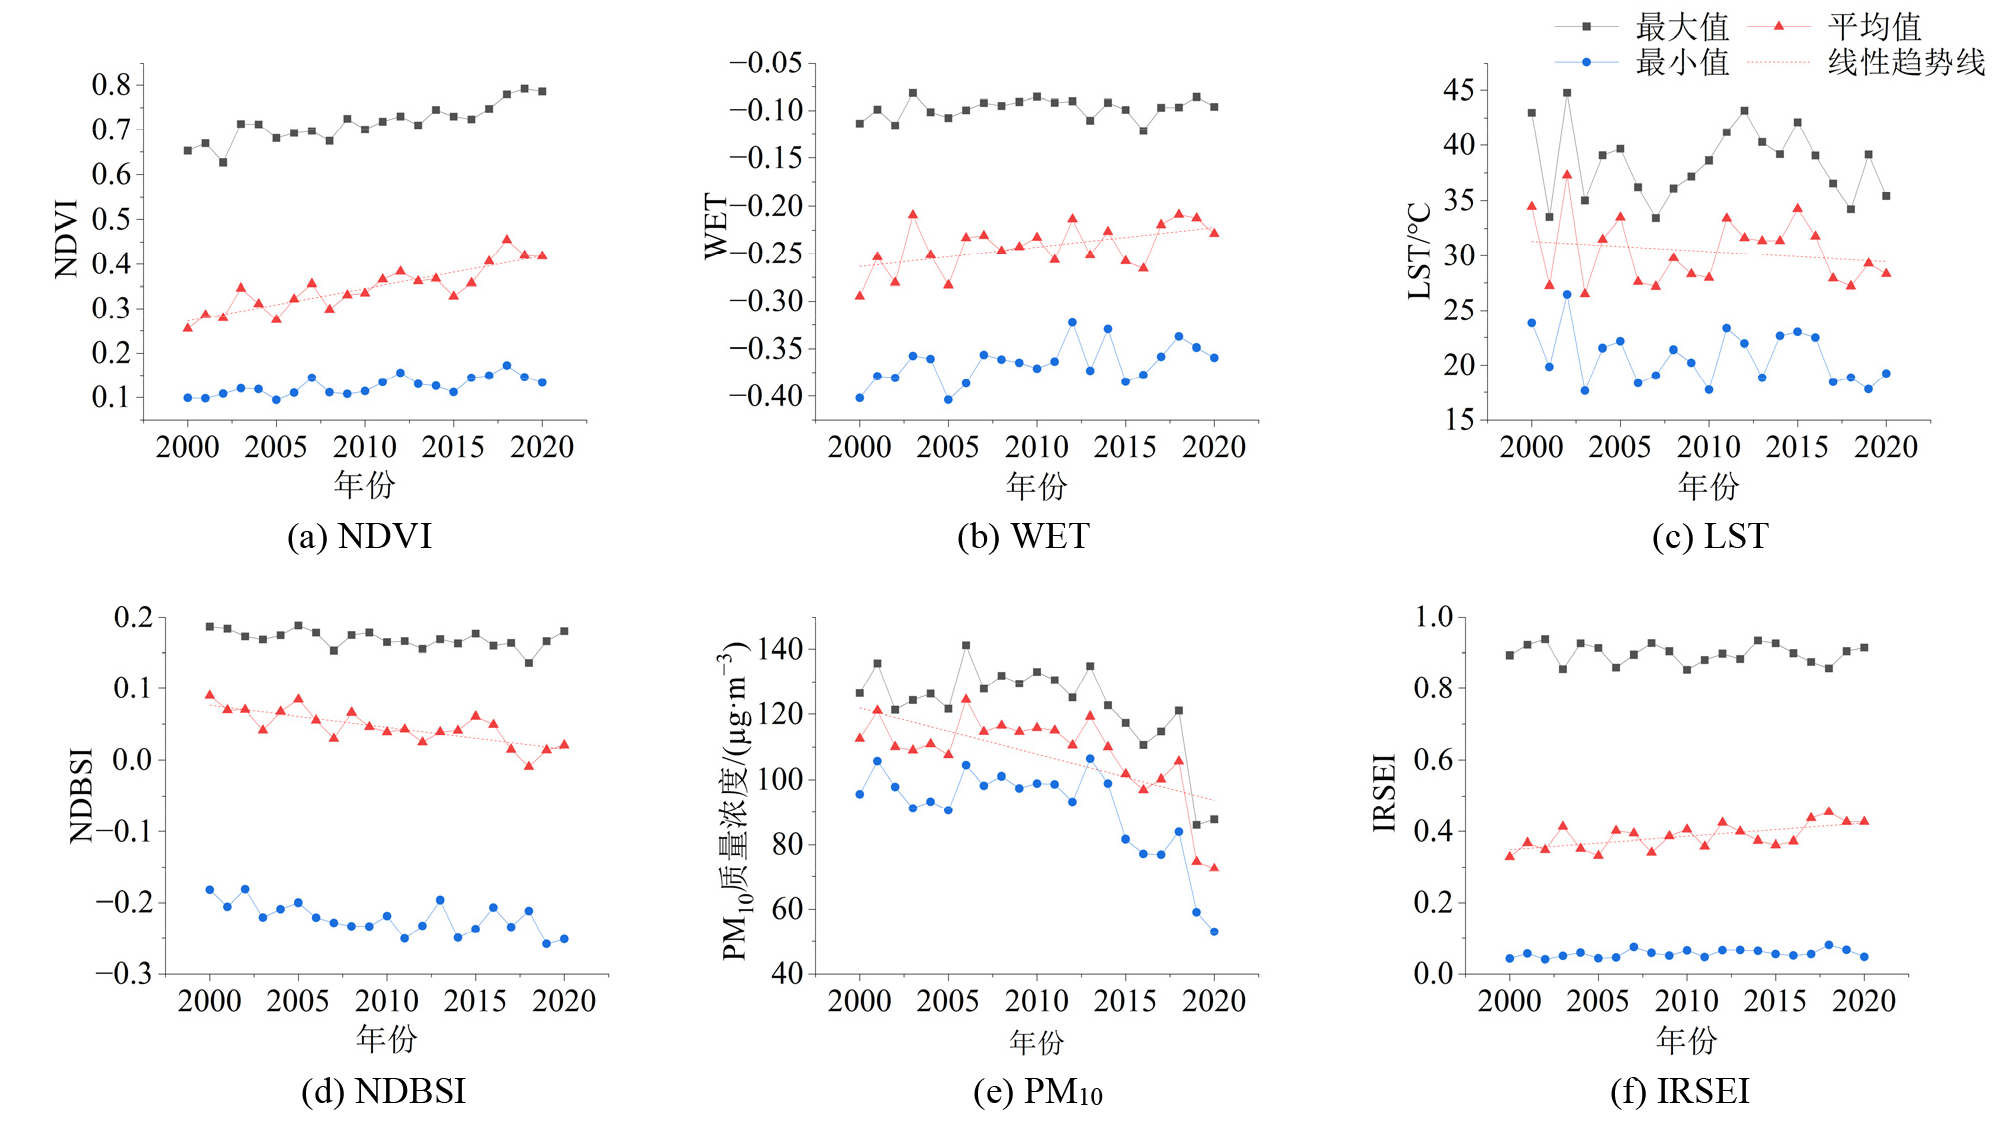
Figure 2 Annual variation of maximum, minimum and mean values of NDVI, WET, LST, NDBSI, PM10 and IRSEI in Ningxia from 2000 to 2020
| 年份 | 绿度 NDVI | 湿度 WET | 热度 LST | 干度 NDBSI | 大气环境质量 PM10/ (μg∙m−3) | 改进遥感生态指数 IRSEI |
|---|---|---|---|---|---|---|
| 2000 | 0.255 | −0.295 | 34.454 | 0.089 | 112.517 | 0.329 |
| 2005 | 0.274 | −0.283 | 33.468 | 0.084 | 107.566 | 0.333 |
| 2010 | 0.335 | −0.233 | 27.964 | 0.039 | 115.813 | 0.405 |
| 2015 | 0.328 | −0.258 | 34.235 | 0.060 | 101.697 | 0.362 |
| 2020 | 0.418 | −0.229 | 28.312 | 0.020 | 72.554 | 0.426 |
| 2000-2020变化百分比/% | 63.92 | 22.37 | −17.83 | −77.53 | −35.52 | 29.48 |
Table 1 Mean values of five indicators and IRSEI in Ningxia from 2000 to 2020
| 年份 | 绿度 NDVI | 湿度 WET | 热度 LST | 干度 NDBSI | 大气环境质量 PM10/ (μg∙m−3) | 改进遥感生态指数 IRSEI |
|---|---|---|---|---|---|---|
| 2000 | 0.255 | −0.295 | 34.454 | 0.089 | 112.517 | 0.329 |
| 2005 | 0.274 | −0.283 | 33.468 | 0.084 | 107.566 | 0.333 |
| 2010 | 0.335 | −0.233 | 27.964 | 0.039 | 115.813 | 0.405 |
| 2015 | 0.328 | −0.258 | 34.235 | 0.060 | 101.697 | 0.362 |
| 2020 | 0.418 | −0.229 | 28.312 | 0.020 | 72.554 | 0.426 |
| 2000-2020变化百分比/% | 63.92 | 22.37 | −17.83 | −77.53 | −35.52 | 29.48 |
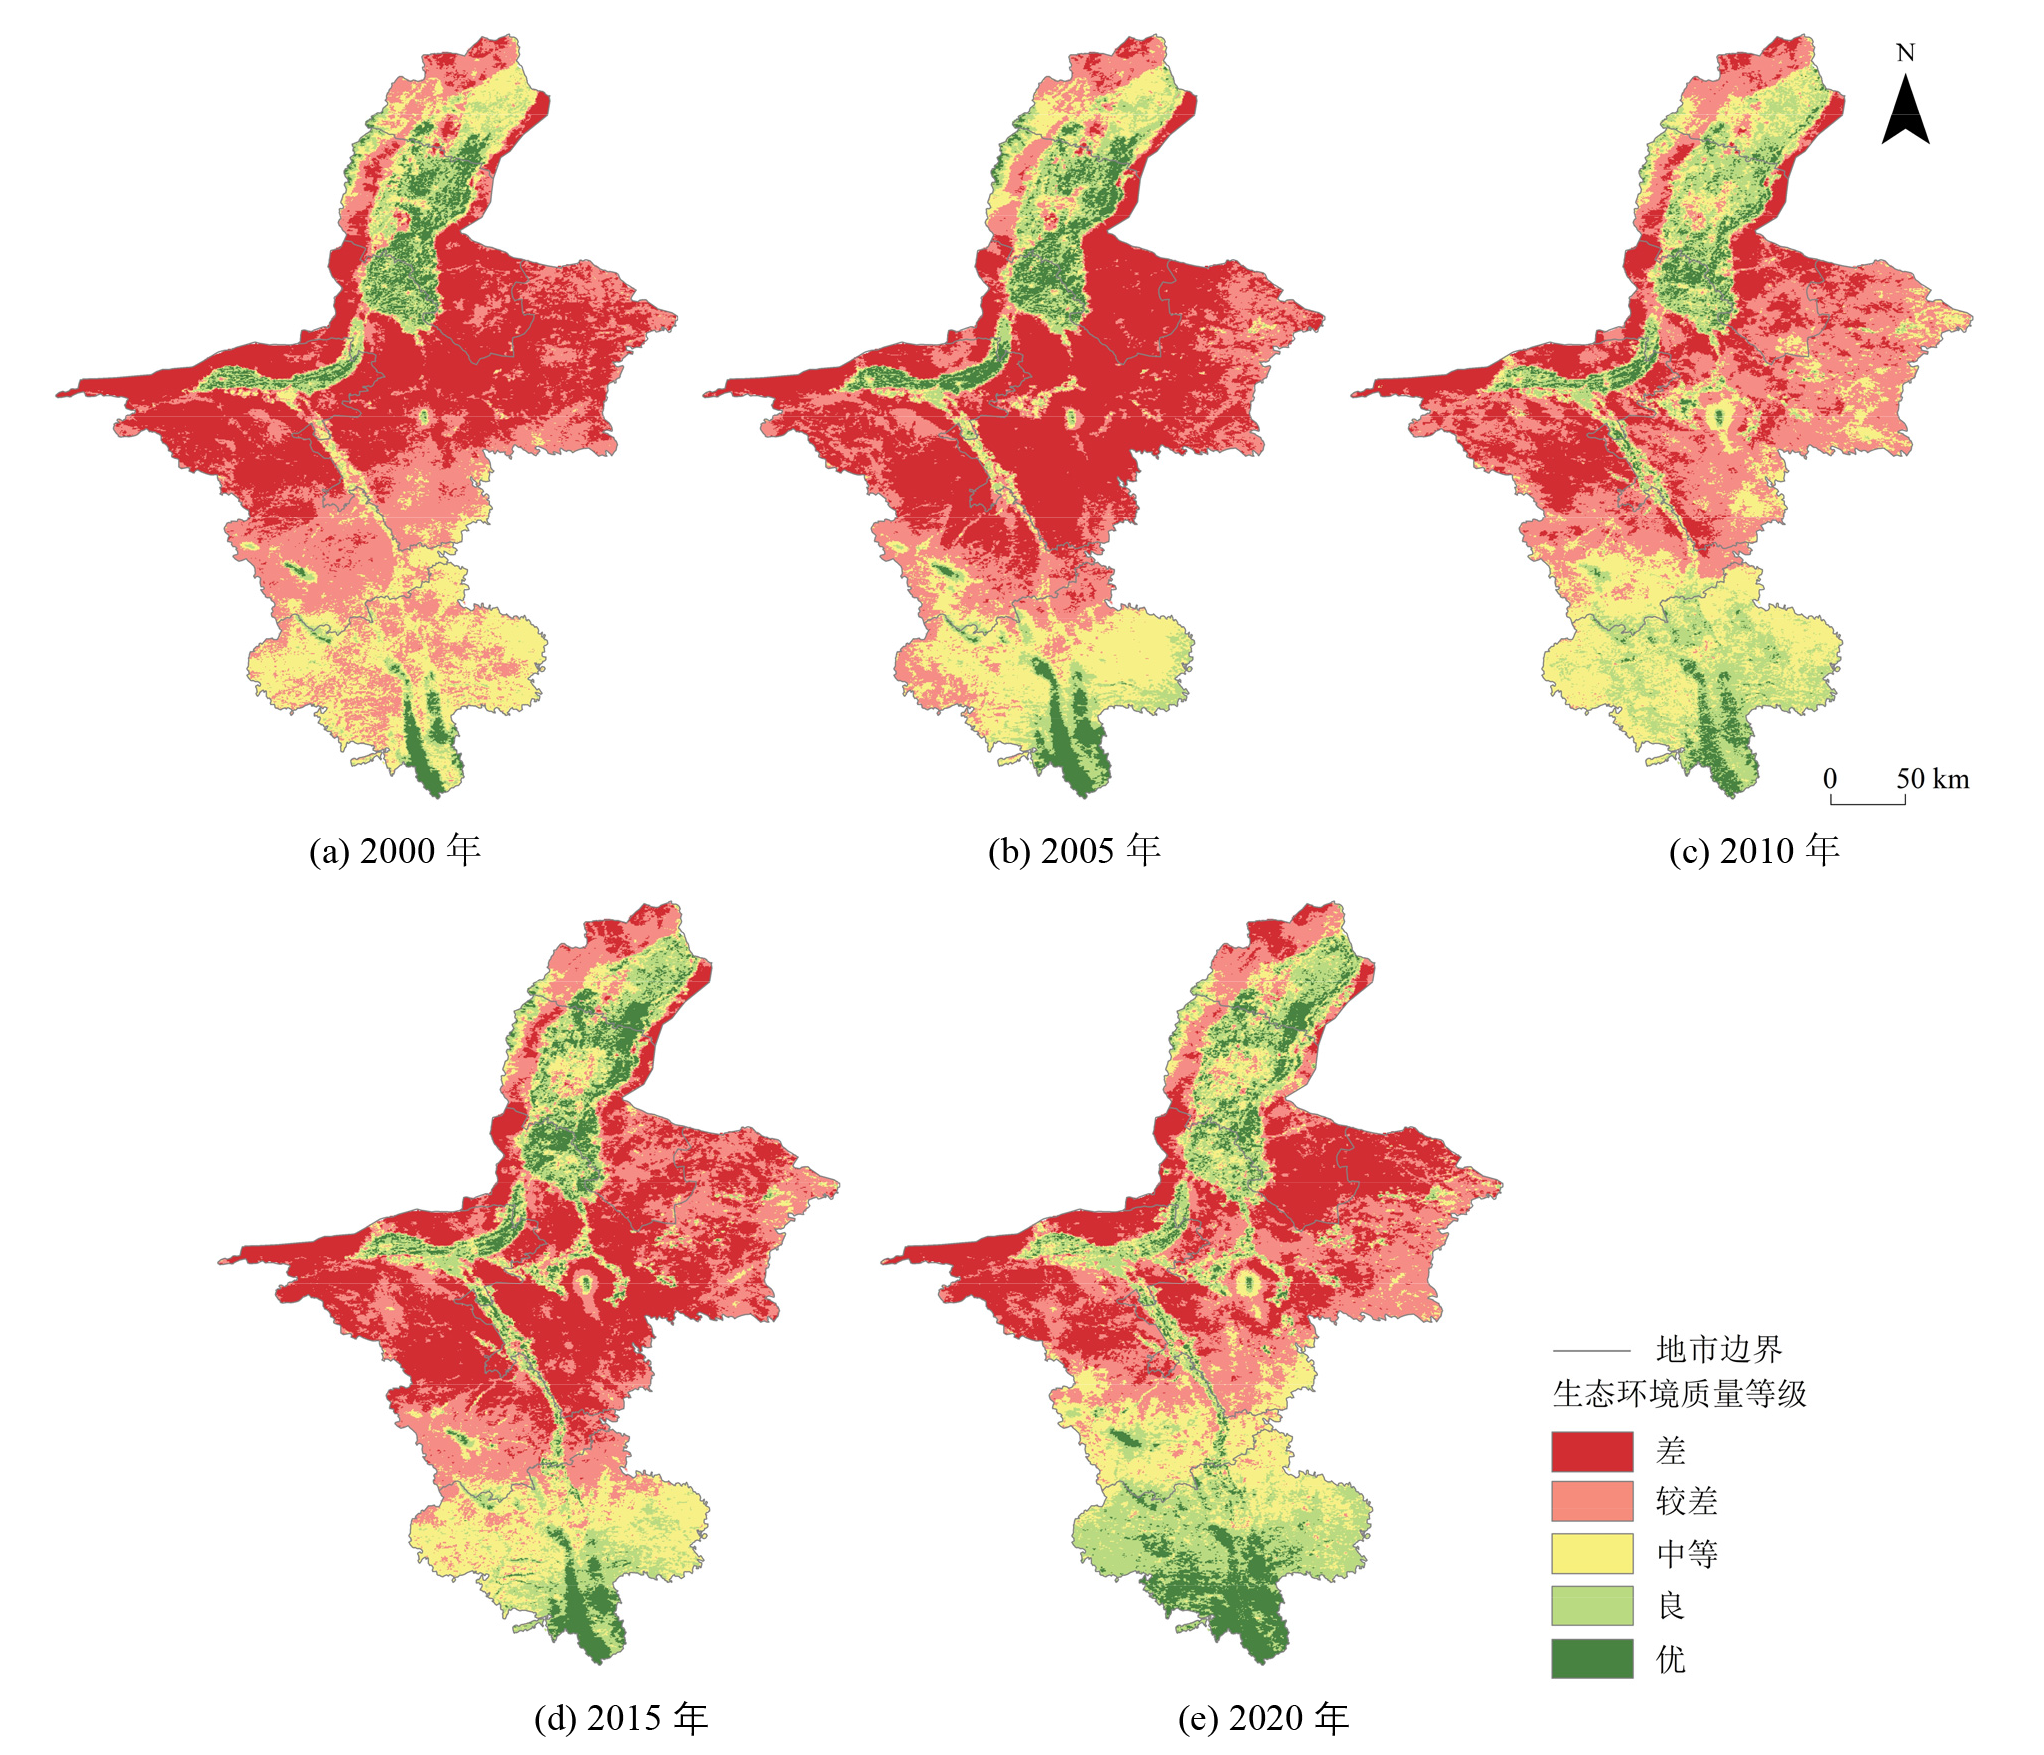
Figure 3 Ningxia’s IRSEI grade maps from 2000 to 2020
| 生态环境 质量等级 | 2000 | 2005 | 2010 | 2015 | 2020 | |||||||||
|---|---|---|---|---|---|---|---|---|---|---|---|---|---|---|
| 面积/103 km2 | 比例/% | 面积/103 km2 | 比例/% | 面积/103 km2 | 比例/% | 面积/103 km2 | 比例/% | 面积/103 km2 | 比例/% | |||||
| [0, 0.2)差 | 23.49 | 35.92 | 27.78 | 42.48 | 13.08 | 20.0 | 22.94 | 35.07 | 16.85 | 25.77 | ||||
| [0.2, 0.4)较差 | 20.64 | 31.56 | 15.26 | 23.33 | 22.26 | 34.04 | 18.11 | 27.69 | 16.96 | 25.93 | ||||
| [0.4, 0.6)中等 | 13.06 | 19.97 | 11.46 | 17.52 | 15.45 | 23.62 | 11.17 | 17.08 | 12.15 | 18.58 | ||||
| [0.6, 0.8)良 | 4.69 | 7.17 | 6.41 | 9.8 | 11.53 | 17.63 | 8.28 | 12.66 | 13.41 | 20.51 | ||||
| [0.8, 1.0]优 | 3.52 | 5.38 | 4.49 | 6.87 | 3.08 | 4.71 | 4.90 | 7.49 | 6.03 | 9.22 | ||||
| 合计 | 65.4 | 100.0 | 65.4 | 100.0 | 65.4 | 100.0 | 65.4 | 100.0 | 65.4 | 100.0 | ||||
Table 2 Area and percentage of Ningxia’s IRSEI grades from 2000 to 2020
| 生态环境 质量等级 | 2000 | 2005 | 2010 | 2015 | 2020 | |||||||||
|---|---|---|---|---|---|---|---|---|---|---|---|---|---|---|
| 面积/103 km2 | 比例/% | 面积/103 km2 | 比例/% | 面积/103 km2 | 比例/% | 面积/103 km2 | 比例/% | 面积/103 km2 | 比例/% | |||||
| [0, 0.2)差 | 23.49 | 35.92 | 27.78 | 42.48 | 13.08 | 20.0 | 22.94 | 35.07 | 16.85 | 25.77 | ||||
| [0.2, 0.4)较差 | 20.64 | 31.56 | 15.26 | 23.33 | 22.26 | 34.04 | 18.11 | 27.69 | 16.96 | 25.93 | ||||
| [0.4, 0.6)中等 | 13.06 | 19.97 | 11.46 | 17.52 | 15.45 | 23.62 | 11.17 | 17.08 | 12.15 | 18.58 | ||||
| [0.6, 0.8)良 | 4.69 | 7.17 | 6.41 | 9.8 | 11.53 | 17.63 | 8.28 | 12.66 | 13.41 | 20.51 | ||||
| [0.8, 1.0]优 | 3.52 | 5.38 | 4.49 | 6.87 | 3.08 | 4.71 | 4.90 | 7.49 | 6.03 | 9.22 | ||||
| 合计 | 65.4 | 100.0 | 65.4 | 100.0 | 65.4 | 100.0 | 65.4 | 100.0 | 65.4 | 100.0 | ||||
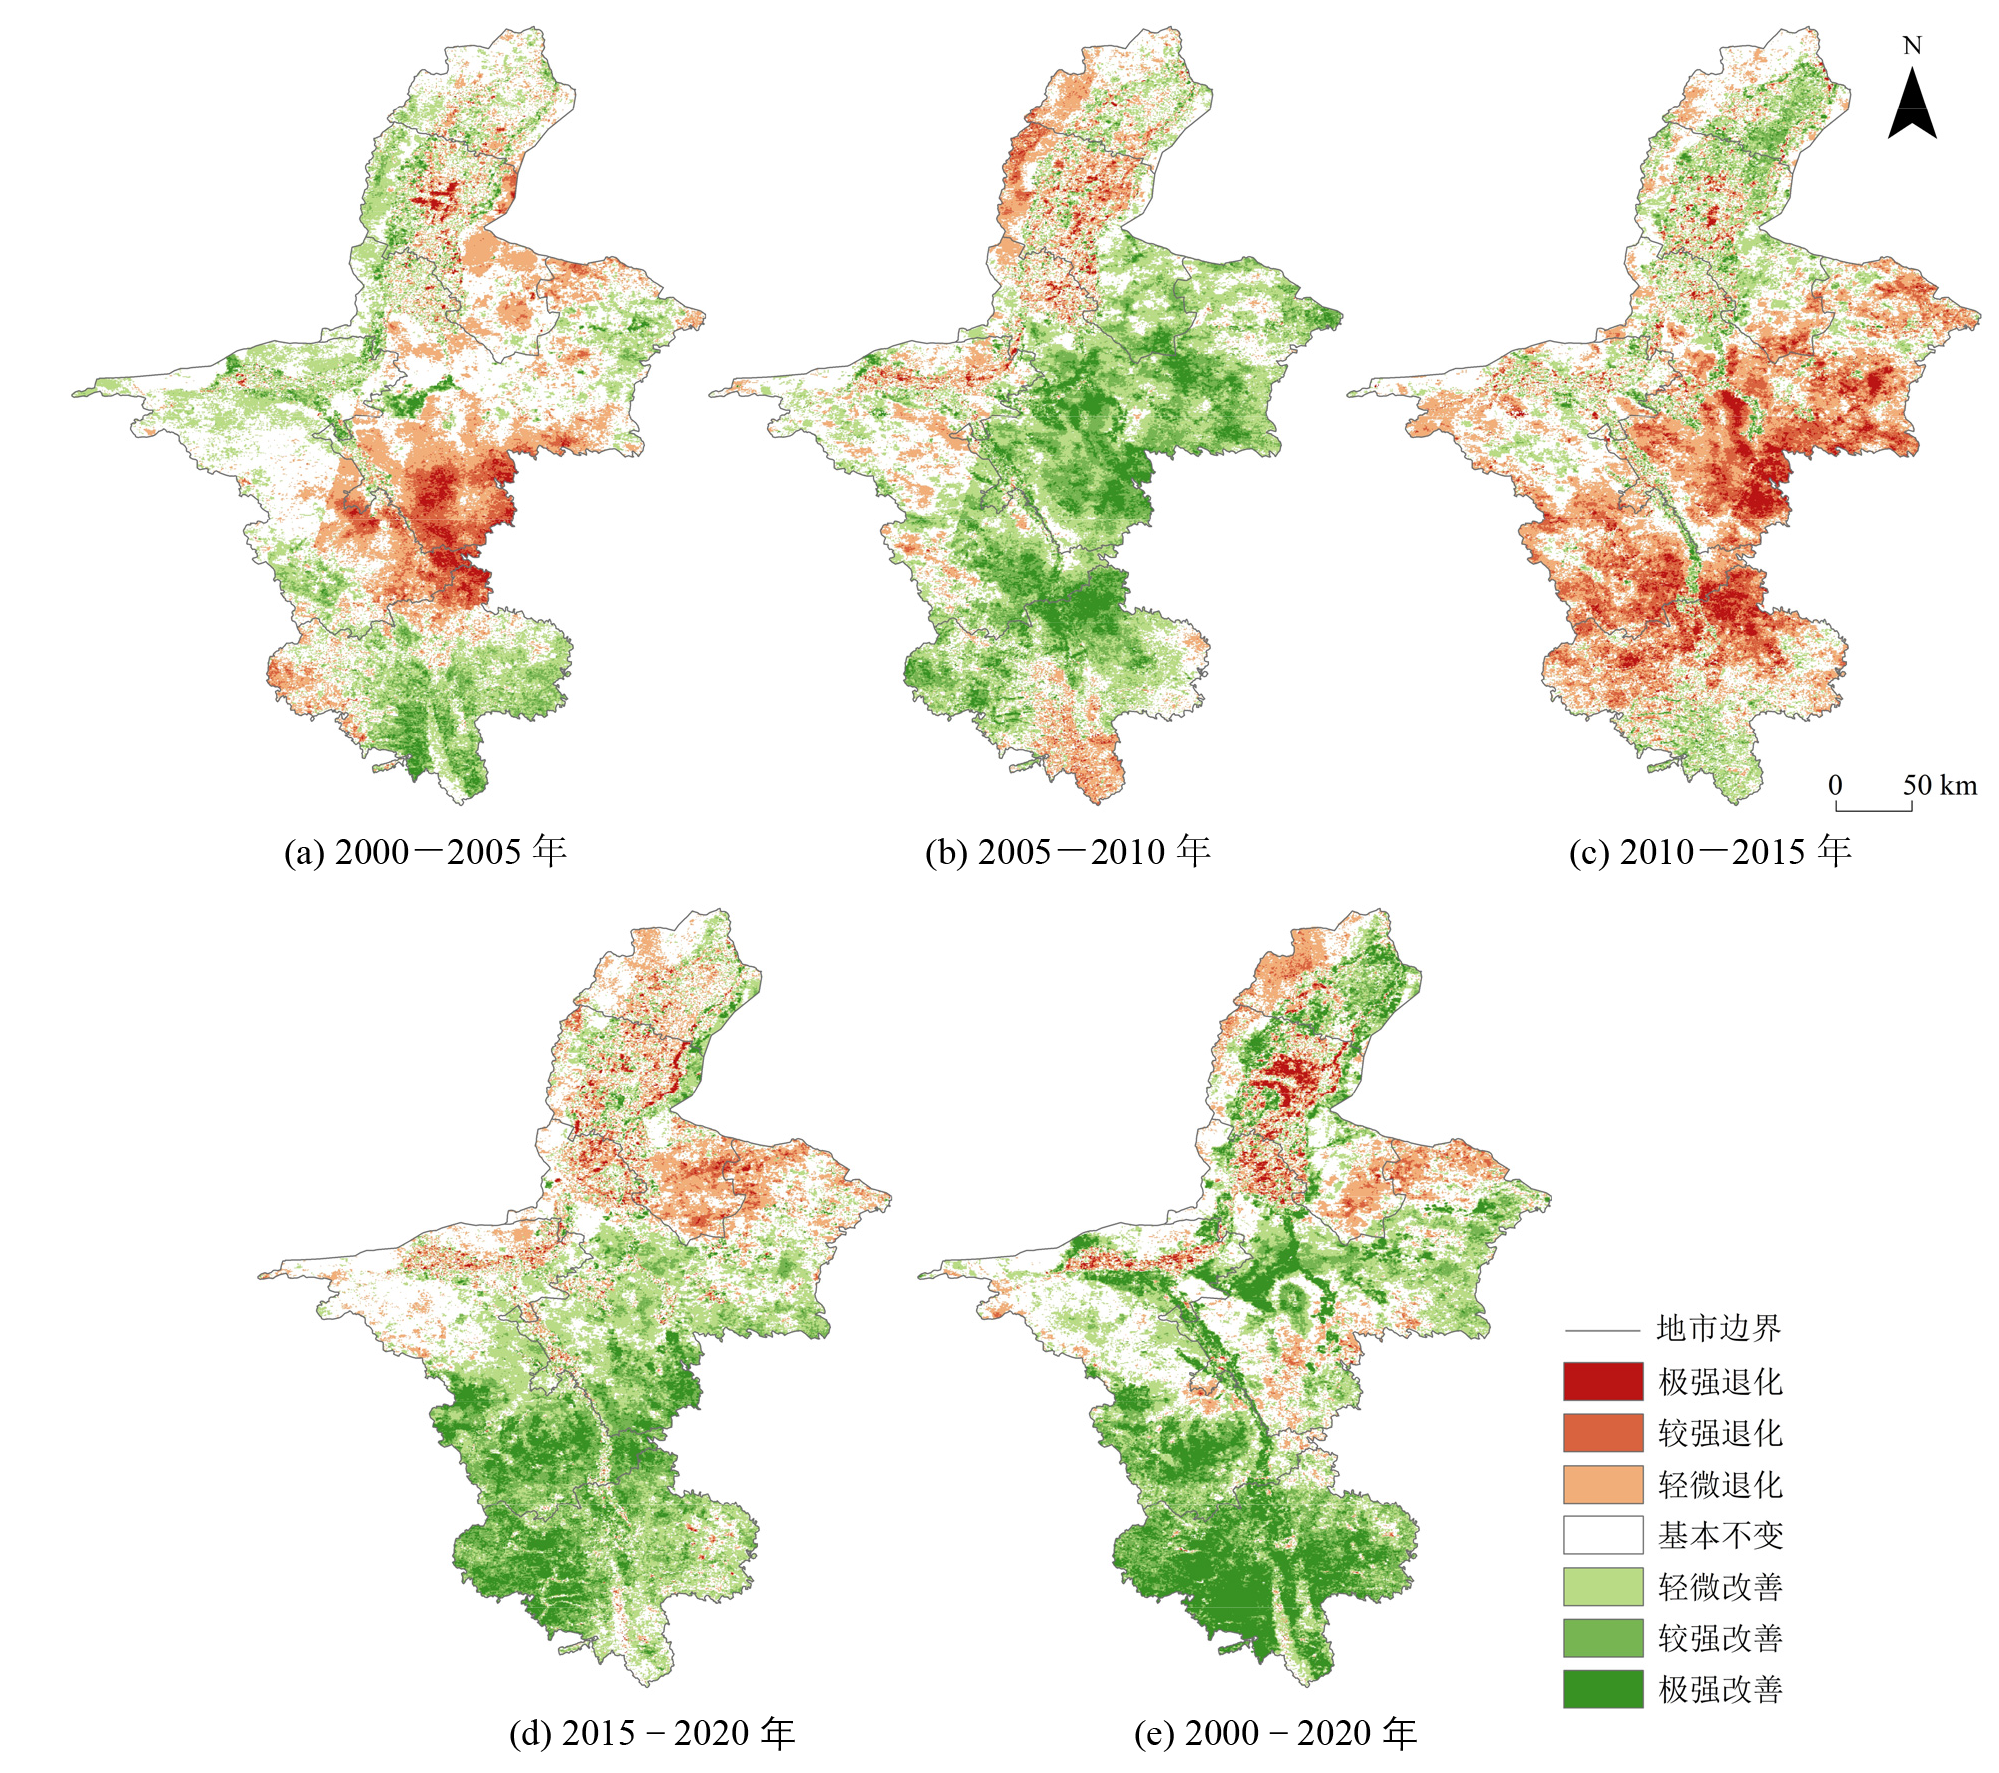
Figure 4 Spatial and temporal changes of IRSEI in Ningxia from 2000 to 2020
| 时段 | 面积 | 退化 | 基本不变 | 改善 | ||||
|---|---|---|---|---|---|---|---|---|
| 极强退化 | 较强退化 | 轻微退化 | 基本不变 | 轻微改善 | 较强改善 | 极强改善 | ||
| 2000‒2005年 | 类面积/103 km2 | 1.25 | 4.11 | 12.9 | 27.35 | 14.88 | 3.78 | 1.13 |
| 类比例/% | 1.91 | 6.29 | 19.73 | 41.82 | 22.76 | 5.77 | 1.73 | |
| 比例/% | 27.92 | 41.82 | 30.26 | |||||
| 2005‒2010年 | 类面积/103 km2 | 0.32 | 1.6 | 7.92 | 19.56 | 19.85 | 11.14 | 5.0 |
| 类比例/% | 0.49 | 2.45 | 12.11 | 29.91 | 30.36 | 17.04 | 7.65 | |
| 比例/% | 15.05 | 29.91 | 55.04 | |||||
| 2010‒2015年 | 类面积/103 km2 | 2.9 | 8.88 | 19.39 | 21.25 | 9.67 | 2.65 | 0.65 |
| 类比例/% | 4.44 | 13.58 | 29.65 | 32.5 | 14.78 | 4.06 | 1.0 | |
| 比例/% | 47.67 | 32.5 | 19.83 | |||||
| 2015‒2020年 | 类面积/103 km2 | 0.5 | 1.82 | 8.53 | 22.47 | 16.91 | 9.8 | 5.36 |
| 类比例/% | 0.77 | 2.79 | 13.04 | 34.36 | 25.86 | 14.99 | 8.2 | |
| 比例/% | 16.59 | 34.36 | 49.05 | |||||
| 2000‒2020年 | 类面积/103 km2 | 0.76 | 1.59 | 7.45 | 20.01 | 14.67 | 10.19 | 10.74 |
| 类比例/% | 1.17 | 2.43 | 11.38 | 30.6 | 22.42 | 15.58 | 16.42 | |
| 比例/% | 14.98 | 30.6 | 54.42 | |||||
Table 3 Statistics of IRSEI grade changes from 2000 to 2020 in the study area
| 时段 | 面积 | 退化 | 基本不变 | 改善 | ||||
|---|---|---|---|---|---|---|---|---|
| 极强退化 | 较强退化 | 轻微退化 | 基本不变 | 轻微改善 | 较强改善 | 极强改善 | ||
| 2000‒2005年 | 类面积/103 km2 | 1.25 | 4.11 | 12.9 | 27.35 | 14.88 | 3.78 | 1.13 |
| 类比例/% | 1.91 | 6.29 | 19.73 | 41.82 | 22.76 | 5.77 | 1.73 | |
| 比例/% | 27.92 | 41.82 | 30.26 | |||||
| 2005‒2010年 | 类面积/103 km2 | 0.32 | 1.6 | 7.92 | 19.56 | 19.85 | 11.14 | 5.0 |
| 类比例/% | 0.49 | 2.45 | 12.11 | 29.91 | 30.36 | 17.04 | 7.65 | |
| 比例/% | 15.05 | 29.91 | 55.04 | |||||
| 2010‒2015年 | 类面积/103 km2 | 2.9 | 8.88 | 19.39 | 21.25 | 9.67 | 2.65 | 0.65 |
| 类比例/% | 4.44 | 13.58 | 29.65 | 32.5 | 14.78 | 4.06 | 1.0 | |
| 比例/% | 47.67 | 32.5 | 19.83 | |||||
| 2015‒2020年 | 类面积/103 km2 | 0.5 | 1.82 | 8.53 | 22.47 | 16.91 | 9.8 | 5.36 |
| 类比例/% | 0.77 | 2.79 | 13.04 | 34.36 | 25.86 | 14.99 | 8.2 | |
| 比例/% | 16.59 | 34.36 | 49.05 | |||||
| 2000‒2020年 | 类面积/103 km2 | 0.76 | 1.59 | 7.45 | 20.01 | 14.67 | 10.19 | 10.74 |
| 类比例/% | 1.17 | 2.43 | 11.38 | 30.6 | 22.42 | 15.58 | 16.42 | |
| 比例/% | 14.98 | 30.6 | 54.42 | |||||

Figure 5 IRSEI trends in Ningxia from 2000 to 2020
| βIRSEI | Z值 | IRSEI变化 | 面积占比/% |
|---|---|---|---|
| ≥0.0005 | ≥1.96 | 明显改善 | 29.18 |
| ≥0.0005 | −1.96‒1.96 | 轻微改善 | 34.84 |
| −0.0005‒0.0005 | −1.96‒1.96 | 稳定不变 | 7.18 |
| ≤−0.0005 | −1.96‒1.96 | 轻微退化 | 21.3 |
| ≤−0.0005 | ≤−1.96 | 严重退化 | 7.51 |
Table 4 Statistics on the percentage of different IRSEI trends in Ningxia from 2000 to 2020
| βIRSEI | Z值 | IRSEI变化 | 面积占比/% |
|---|---|---|---|
| ≥0.0005 | ≥1.96 | 明显改善 | 29.18 |
| ≥0.0005 | −1.96‒1.96 | 轻微改善 | 34.84 |
| −0.0005‒0.0005 | −1.96‒1.96 | 稳定不变 | 7.18 |
| ≤−0.0005 | −1.96‒1.96 | 轻微退化 | 21.3 |
| ≤−0.0005 | ≤−1.96 | 严重退化 | 7.51 |

Figure 6 Spatial distributions of NDVI, NDVI? and NDVI? in Ningxia in 2000 and 2020 and the difference in NDVI, NDVI? and NDVI? between 2000 and 2020
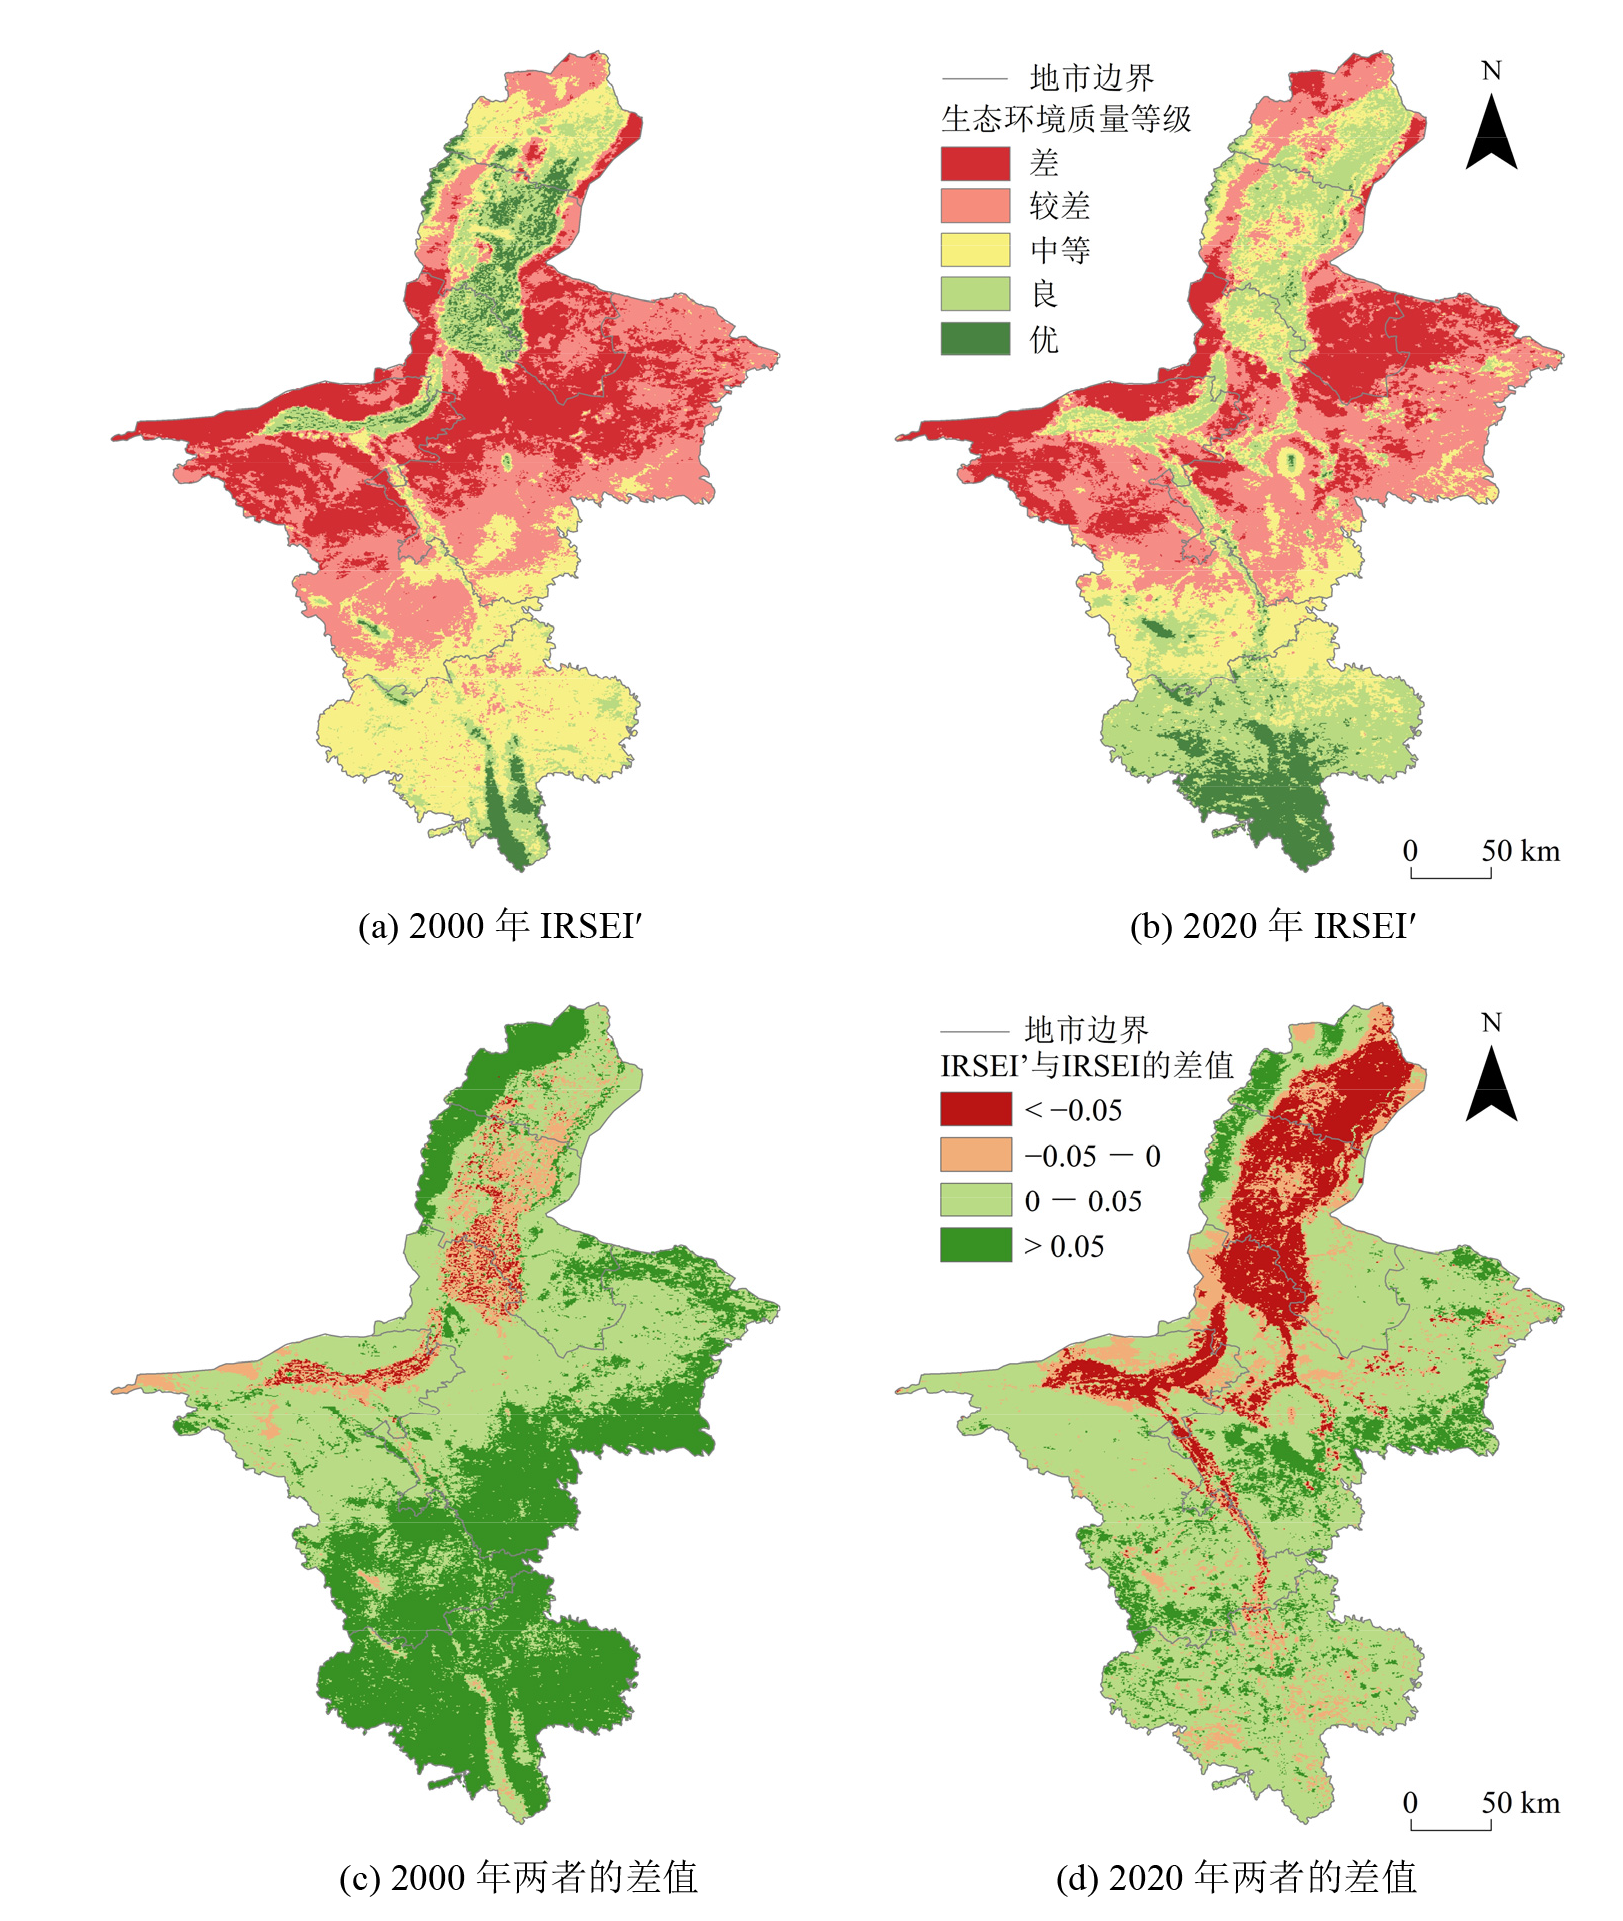
Figure 7 The IRSEI? of 2000 and 2020, and comparative analysis with IRSEI
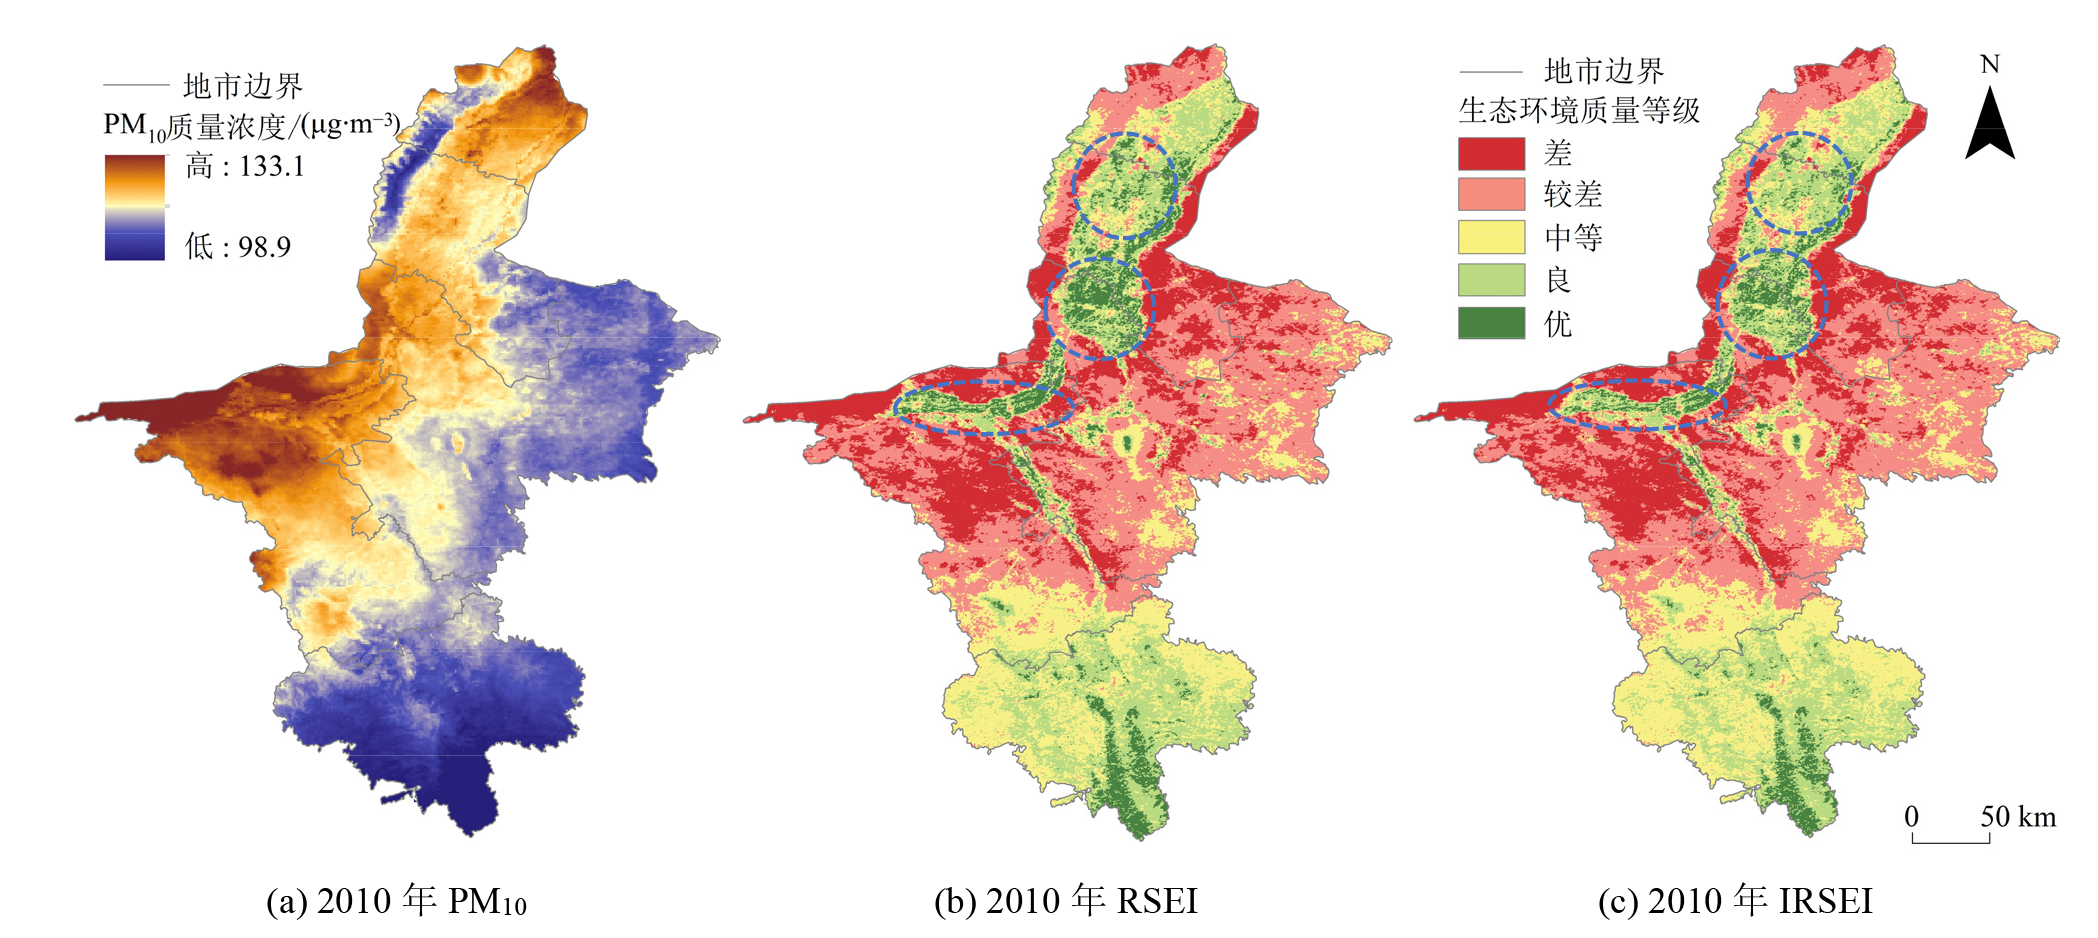
Figure 8 Spatial Distribution of PM10, RSEI, and IRSEI in the Study Area in 2010
| [1] | DIDAN K, 2021. MODIS/Terra vegetation indices 16-Day L3 global 500m SIN Grid V061[DB/OL]. Sioux Falls, South Dakota: NASA EOSDIS land processes distributed active archive center [2023-07-30]. https://doi.org/10.5067/MODIS/MOD13A1.061. |
| [2] |
DONG C Y, QIAO R R, YANG Z C, et al., 2023. Eco-environmental quality assessment of the artificial oasis of Ningxia section of the Yellow River with the MRSEI approach[J]. Frontiers in Environmental Science, 10: 1071631.
DOI URL |
| [3] |
JIA H W, YAN C Z, XING X G, 2021. Evaluation of eco-environmental quality in Qaidam Basin based on the ecological index (MRSEI) and GEE[J]. Remote Sensing, 13(22): 4543.
DOI URL |
| [4] |
LIAO W H, JIANG W G, 2020. Evaluation of the spatiotemporal variations in the eco-environmental quality in China based on the remote sensing ecological index[J]. Remote Sensing, 12(15): 2462.
DOI URL |
| [5] |
LUAN Q Z, YANG M C, FENG T Q, et al., 2023. Analysis of the urban turbidity island effect: A case study in Beijing City, China[J]. Environmental Research Letters, 18(2): 024010.
DOI |
| [6] |
SONG Y S, DU C, YANG C, et al., 2012. Ecological environmental quality evaluation of Yellow River basin[J]. Procedia Engineering, 28: 754-758.
DOI URL |
| [7] |
XU H Q, DUAN W F, DENG W H, et al., 2022. RSEI or MRSEI? Comment on Jia et al. Evaluation of eco-environmental quality in Qaidam Basin based on the ecological index (MRSEI) and GEE[J]. Remote Sensing, 14(21): 5307.
DOI URL |
| [8] |
XU H Q, WANG Y F, GUAN H D, et al., 2019. Detecting ecological changes with a remote sensing based ecological index (RSEI) produced time series and change vector analysis[J]. Remote Sensing, 11(20): 2345.
DOI URL |
| [9] | VERMOTE E, 2021. MODIS/Terra surface reflectance 8-Day L3 global 500m SIN Grid V061[DB/OL]. Sioux Falls, South Dakota: NASA EOSDIS land processes distributed active archive center [2023-07-30]. https://doi.org/10.5067/MODIS/MOD09A1.061. |
| [10] | WAN Z, HOOK S, HULLEY G, 2021. MODIS/Terra land surface temperature/emissivity daily L3 global 1 km SIN Grid V061[DB/OL]. Sioux Falls, South Dakota: NASA EOSDIS land processes distributed active archive center, [2023-07-30]. https://doi.org/10.5067/MODIS/MOD11A1.061. |
| [11] |
WANG S, WANG P, QI Q, et al., 2023. Improved estimation of particulate matter in China based on multisource data fusion[J]. Science of The Total Environment, 869: 161552.
DOI URL |
| [12] |
WEI J, LI Z Q, XUE W H, et al., 2021. The ChinaHigh PM10 dataset: Generation, validation, and spatiotemporal variations from 2013 to 2019 across China[J]. Environment International, 146: 106290.
DOI URL |
| [13] |
WEI L, ZHOU L, SUN D Q, et al., 2022. Evaluating the impact of urban expansion on the habitat quality and constructing ecological security patterns: A case study of Jiziwan in the Yellow River Basin, China[J]. Ecological Indicators, 145(1): 109544.
DOI URL |
| [14] |
ZHENG Z H, WU Z F, CHEN Y B, et al., 2022. Instability of remote sensing based ecological index (RSEI) and its improvement for time series analysis[J]. Science of The Total Environment, 814: 152595.
DOI URL |
| [15] | 奥勇, 蒋嶺峰, 白召弟, 等, 2022. 基于格网GIS的黄河流域土地生态质量综合评价[J]. 干旱区地理, 45(1): 164-175. |
| AO Y, JIANG L F, BAI Z D, et al., 2022. Comprehensive evaluation of land ecological quality in the Yellow River Basin based on Grid-GIS[J]. Arid Land Geography, 45(1): 164-175. | |
| [16] | 曹云, 孙应龙, 陈紫璇, 等, 2022. 2000-2020年黄河流域植被生态质量变化及其对极端气候的响应[J]. 生态学报, 42(11): 4524-4535. |
| CAO Y, SUN Y L, CHEN Z X, et al., 2022. Dynamic changes of vegetation ecological quality in the Yellow River Basin and its response to extreme climate during 2000-2020[J]. Acta Ecologica Sinica, 42(11): 4524-4535. | |
| [17] | 程琳琳, 王振威, 田素锋, 等, 2021. 基于改进的遥感生态指数的北京市门头沟区生态环境质量评价[J]. 生态学杂志, 40(4): 1177-1185. |
|
CHENG L L, WANG Z W, TIAN S F, et al., 2021. Evaluation of eco-environmental quality in Mentougou District of Beijing based on improved remote sensing ecological index[J]. Chinese Journal of Ecology, 40(4): 1177-1185.
DOI |
|
| [18] |
陈芳淼, 黄慧萍, 杨光, 等, 2023. 基于遥感生态指数的黄河流域生态环境质量变化及影响因素分析[J]. 中国沙漠, 43(4): 252-262.
DOI |
|
CHEN F M, HUANG H P, YANG G, et al., 2023. Research on the dynamic change of the ecological environment and its influencing factors in the Yellow River Basin based on Remote Sensing Ecological Index[J]. Journal of Desert Research, 43(4): 252-262.
DOI |
|
| [19] | 杜高奇, 李自强, 赵勇, 等, 2022. 基于RSEI的黄河流域生态环境质量监测与驱动因素分析[J]. 水利水电技术(中英文), 53(12): 81-93. |
| DU G Q, LI Z Q, ZHAO Y, et al., 2022. RSEI-based analysis on eco-environment quality monitoring and driving factors of Yellow River Basin[J]. Water Resources and Hydropower Engineering, 53(12): 81-93. | |
| [20] | 李冠稳, 高晓奇, 肖能文, 2021. 基于关键指标的黄河流域近20年生态系统质量的时空变化[J]. 环境科学研究, 34(12): 2945-2953. |
| LI G W, GAO X Q, XIAO N W, 2021. Spatial and temporal changes of ecosystem quality on key indicators in the Yellow River Basin from 2000 to 2018[J]. Research of Environmental Sciences, 34(12): 2945-2953. | |
| [21] | 梁齐云, 苏涛, 张灿, 等, 2022. 基于改进遥感生态指数的黄山市生态质量评价研究[J]. 地球物理学展, 37(4): 1448-1456. |
| LIANG Q Y, SU T, ZHANG C, et al., 2022. Research on ecological quality evaluation of Huangshan city based on improved remote sensing ecological index[J]. Progress in Geophysics, 37(4): 1448-1456. | |
| [22] | 林妍敏, 南雄雄, 胡志瑞, 等, 2022. 西北典型生态脆弱区植被覆盖度时空变化及其生态安全评价: 以宁夏贺兰山为例[J]. 生态与农村环境学报, 38(5): 599-608. |
| LIN Y M, NAN X X, HU Z R, et al., 2022. Fractional vegetation cover change and its evaluation of ecological security in the typical vulnerable ecological region of northwest China: Helan Mountains in Ningxia[J]. Journal of Ecology and Rural Environment, 38(5): 599-608 | |
| [23] | 刘美, 2022. 黄河流域生态质量气象评价研究[D]. 郑州: 郑州大学: 46-55. |
| LIU M, 2022. Meteorological evaluation of ecological quality in the Yellow River Basin[D]. Zhengzhou: Zhengzhou University: 46-55. | |
| [24] | 刘英, 党超亚, 岳辉, 等, 2022. 改进型遥感生态指数与RSEI的对比分析[J]. 遥感学报, 26(4): 683-697. |
|
LIU Y, DANG C Y, YUE H, et al., 2022. Comparison between modified remote sensing ecological index and RSEI[J]. National Remote Sensing Bulletin, 26(4): 683-697.
DOI URL |
|
| [25] | 农兰萍, 王金亮, 2020. 基于RSEI模型的昆明市生态环境质量动态监测[J]. 生态学杂志, 39(6): 2042-2050. |
| NONG L P, WANG J L, 2022. Dynamic monitoring of ecological environment quality in Kunming based on RSEI model[J]. Chinese Journal of Ecology, 39(6): 2042-2050. | |
| [26] | 农兰萍, 王金亮, 玉院和, 2021. 基于改进型遥感生态指数 (MRSEI) 模型的滇中地区生态环境质量研究[J]. 生态与农村环境学报, 37(8): 972-982. |
| NONG L P, WANG J L, YU Y H, 2021. Research on ecological environment quality in central Yunnan based on MRSEI model[J]. Journal of Ecology and Rural Environment, 37(8): 972-982. | |
| [27] | 宋美杰, 罗艳云, 段利民, 2019. 基于改进遥感生态指数模型的锡林郭勒草原生态环境评价[J]. 干旱区研究, 36(6): 1521-1527. |
| SONG M J, LUO Y Y, DUAN L M, 2019. Evaluation of ecological environment in the Xilin Gol Steppe based on modified remote sensing ecological index model[J]. Arid Zone Research, 36(6): 1521-1527. | |
| [28] | 田智慧, 任祖光, 魏海涛, 2022. 2000-2020年黄河流域植被时空演化驱动机制[J]. 环境科学, 43(2): 743-751. |
|
TIAN Z Z, REN Z G, WEI H T, 2022. Driving mechanism of spatiotemporal evolution of vegetation in the Yellow River Basin from 2000 to 2020[J]. Environmental Science, 43(2): 743-751.
DOI URL |
|
| [29] |
王杰, 马佳丽, 解斐斐, 等, 2020. 干旱地区遥感生态指数的改进——以乌兰布和沙漠为例[J]. 应用生态学报, 31(11): 3795-3804.
DOI |
| WANG J, MA J L, XIE F F, et al., 2020. Improvement of remote sensing ecological index in arid areas: Taking the Ulan Buh desert as an example[J]. Journal of Applied Ecology, 31(11): 3795-3804. | |
| [30] | 王苗, 刘普幸, 乔雪梅, 等, 2021. 基于RSEDI的宁夏生态环境质量时空演变及其驱动力贡献率分析[J]. 生态学杂志, 40(10): 3278-3289. |
|
WANG M, LIU P X, QIAO X M, et al., 2021. Analysis of the spatiotemporal evolution of ecological environmental quality in Ningxia and its driving force contribution based on RSEDI[J]. Chinese Journal of Ecology, 40(10): 3278-3289.
DOI |
|
| [31] | 王夏冰, 马超, 陈登魁, 等, 2018. 宁夏罗山地区2004-2015年NPP时空变化及气候响应[J]. 水土保持通报, 38(6): 358-364, 385. |
| WANG X B, MA C, CHEN D K, et al., 2018. Spatiotemporal change of NPP and its response to climate over Luoshan region in Ningxia Hui Autonomous Region from 2004 to 2015[J]. Bulletin of Soil and Water Conservation, 38(6): 358-364, 385. | |
| [32] | 徐涵秋, 2005. 利用改进的归一化差异水体指数 (MNDWI) 提取水体信息的研究[J]. 遥感学报, 9(5): 589-595. |
| XU H Q, 2005. A study on information extraction of water body with the modified nomalized difference water index (MNDWI)[J]. Journal of Remote Sensing, 9(5): 589-595. | |
| [33] | 徐涵秋, 2013a. 城市遥感生态指数的创建及其应用[J]. 生态学报, 33(24): 7853-7862. |
| XU H Q, 2013a. A remote sensing urban ecological index and its application[J]. Acta Ecologica Sinica, 33(24): 7853-7862. | |
| [34] | 徐涵秋, 2013b. 区域生态环境变化的遥感评价指数[J]. 中国环境科学, 33(5): 889-897. |
| XU H Q, 2013b. A remote sensing index for assessment of regional ecological changes[J]. China Environmental Science, 33(5): 889-897. | |
| [35] | 杨慧芳, 张合林, 2022. 黄河流域生态保护与经济高质量发展耦合协调关系评价[J]. 统计与决策, 38(11): 114-119. |
| YANG H F, ZHANG H L, 2022. Evaluation of the coupling and coordination relationship between ecological protection and high-quality economic development in the Yellow River Basin[J]. Statistics and Decision Making, 38(11): 114-119. | |
| [36] | 杨泽康, 田佳, 李万源, 等, 2021. 黄河流域生态环境质量时空格局与演变趋势[J]. 生态学报, 41(19): 7627-7636. |
| YANG Z K, TIAN J, LI W Y, et al., 2021. Spatial-temporal pattern and evolution trend of ecological environment quality in the Yellow River Basin[J]. Acta Ecologica Sinica, 41(19): 7627-7636. | |
| [37] | 尹传鑫, 2022. 基于MODIS的黄河流域生态环境质量演变及驱动力分析[D]. 郑州: 郑州大学: 22-44. |
| YIN C X, 2022. Evolution and driving force analysis of ecological environment quality based on MODIS data in the Yellow River Basin[D]. Zhengzhou: Zhengzhou University: 22-44. | |
| [38] | 张静, 杨丽萍, 贡恩军, 等, 2023. 基于谷歌地球引擎和改进型遥感生态指数的西安市生态环境质量动态监测[J]. 生态学报, 43(5): 2114-2127. |
| ZHANG J, YANG L P, GONG E J, et al., 2023. Dynamic monitoring of eco-environment quality in Xi'an based on GEE and adjusted RSEI[J]. Acta Ecologica Sinica, 43(5): 2114-2127. | |
| [39] | 左其亭, 2019. 黄河流域生态保护和高质量发展研究框架[J]. 人民黄河, 41(11): 1-6. |
| ZUO Q T, 2019. Research framework for ecological protection and high-quality development of the Yellow River basin[J]. Yellow River, 41(11): 1-6. | |
| [40] | 张伟, 杜培军, 郭山川, 等, 2023. 改进型遥感生态指数及干旱区生态环境评价[J]. 遥感学报, 27(2): 299-317. |
|
ZHANG W, DU P J, GUO S C, et al., 2023. Enhanced remote sensing ecological index and ecological environment evaluation in arid area[J]. National Remote Sensing Bulletin, 27(2): 299-317.
DOI URL |
|
| [41] | 张晓东, 刘湘南, 赵志鹏, 等, 2017. 农牧交错区生态环境质量遥感动态监测——以宁夏盐池为例[J]. 干旱区地理, 40(5): 1070-1078. |
| ZHANG X D, LIU X N, ZHAO Z P, et al., 2017. Dynamic monitoring of ecology and environment in the agro-pastral ecotone based on remote sensing: A case of Yanchi County in Ningxia Hui Autonomous Region[J]. Arid Land Geography, 40(5): 1070-1078. | |
| [42] | 张泽瑾, 张一星, 高莹云, 等, 2022. 2019年5月11日宁夏大风沙尘天气过程分析[J]. 农业科技与信息 (6): 40-44, 48. |
| ZHANG Z J, ZHANG Y X, GAO Y Y, et al., 2022. Analysis of the sandstorm weather process in Ningxia on May 11, 2019[J]. Agricultural Science and Information (6): 40-44, 48. |
| Viewed | ||||||
|
Full text |
|
|||||
|
Abstract |
|
|||||
Copyright © 2021 Editorial Office of ACTA PETROLEI SINICA
Address:No. 6 Liupukang Street, Xicheng District, Beijing, P.R.China, 510650
Tel: 86-010-62067128, 86-010-62067137, 86-010-62067139
Fax: 86-10-62067130
Email: syxb@cnpc.com.cn
Support byBeijing Magtech Co.ltd, E-mail:support@magtech.com.cn