Ecology and Environment ›› 2022, Vol. 31 ›› Issue (8): 1510-1520.DOI: 10.16258/j.cnki.1674-5906.2022.08.002
• Research Articles • Previous Articles Next Articles
RUAN Huihua1( ), XU Jianhui2,*(), ZHANG Feifei3
Received:2022-04-06
Online:2022-08-18
Published:2022-10-10
Contact:
XU Jianhui
阮惠华1(), 许剑辉2,*(), 张菲菲3
通讯作者:
许剑辉
作者简介:阮惠华(1979年生),女,高级工程师,主要从事3S技术及气象应用研究。E-mail: ruanhuihua@163.com
基金资助:CLC Number:
RUAN Huihua, XU Jianhui, ZHANG Feifei. Spatiotemporal Changes of Vegetation and Land Surface Temperature during 2001 and 2020 in the Guangdong-Hong Kong-Macao Greater Bay Area of China[J]. Ecology and Environment, 2022, 31(8): 1510-1520.
阮惠华, 许剑辉, 张菲菲. 2001—2020年粤港澳大湾区植被和地表温度时空变化研究[J]. 生态环境学报, 2022, 31(8): 1510-1520.
Add to citation manager EndNote|Ris|BibTeX
URL: https://www.jeesci.com/EN/10.16258/j.cnki.1674-5906.2022.08.002

Figure 1 Study area
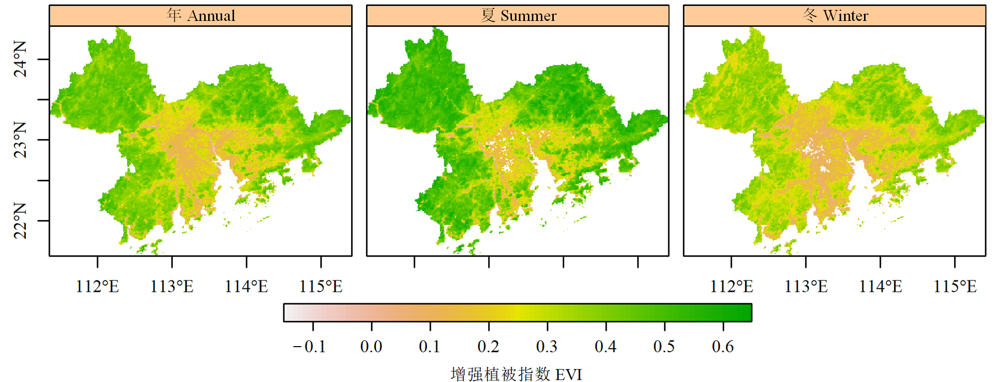
Figure 2 Spatial distribution of annual, summer and winter averaged EVI for GBA, China in 2001-2020
| 区域Region | 增强植被指数 EVI | ||
|---|---|---|---|
| 年平均 Annual | 夏 Summer | 冬 Winter | |
| 大湾区 GBA | 0.358 | 0.435 | 0.297 |
| 东莞 Dongguan | 0.231 | 0.304 | 0.195 |
| 佛山 Foshan | 0.245 | 0.324 | 0.208 |
| 广州 Guangzhou | 0.328 | 0.402 | 0.277 |
| 香港 Hongkong | 0.337 | 0.409 | 0.289 |
| 惠州 Huizhou | 0.402 | 0.473 | 0.337 |
| 江门 Jiangmen | 0.366 | 0.439 | 0.293 |
| 澳门 Macao | 0.146 | 0.216 | 0.121 |
| 深圳 Shenzhen | 0.277 | 0.348 | 0.232 |
| 肇庆 Zhaoqing | 0.414 | 0.492 | 0.340 |
| 中山 Zhongshan | 0.228 | 0.295 | 0.191 |
| 珠海 Zhuhai | 0.252 | 0.319 | 0.203 |
Table 1 Statistical results of the averaged enhanced vegetation index (EVI) from 2001 to 2020 in Guangdong-Hong Kong-Macao Greater Bay Area (GBA), China
| 区域Region | 增强植被指数 EVI | ||
|---|---|---|---|
| 年平均 Annual | 夏 Summer | 冬 Winter | |
| 大湾区 GBA | 0.358 | 0.435 | 0.297 |
| 东莞 Dongguan | 0.231 | 0.304 | 0.195 |
| 佛山 Foshan | 0.245 | 0.324 | 0.208 |
| 广州 Guangzhou | 0.328 | 0.402 | 0.277 |
| 香港 Hongkong | 0.337 | 0.409 | 0.289 |
| 惠州 Huizhou | 0.402 | 0.473 | 0.337 |
| 江门 Jiangmen | 0.366 | 0.439 | 0.293 |
| 澳门 Macao | 0.146 | 0.216 | 0.121 |
| 深圳 Shenzhen | 0.277 | 0.348 | 0.232 |
| 肇庆 Zhaoqing | 0.414 | 0.492 | 0.340 |
| 中山 Zhongshan | 0.228 | 0.295 | 0.191 |
| 珠海 Zhuhai | 0.252 | 0.319 | 0.203 |
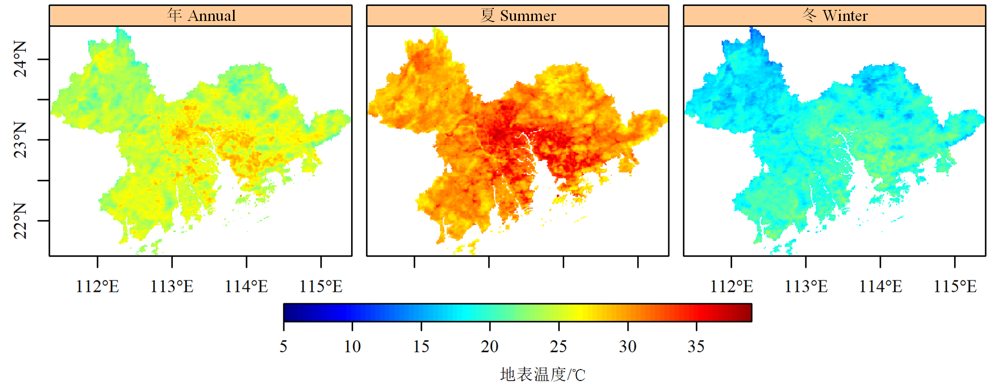
Figure 3 Spatial distribution of annual, summer and winter daytime averaged LST for GBA, China in 2001-2020
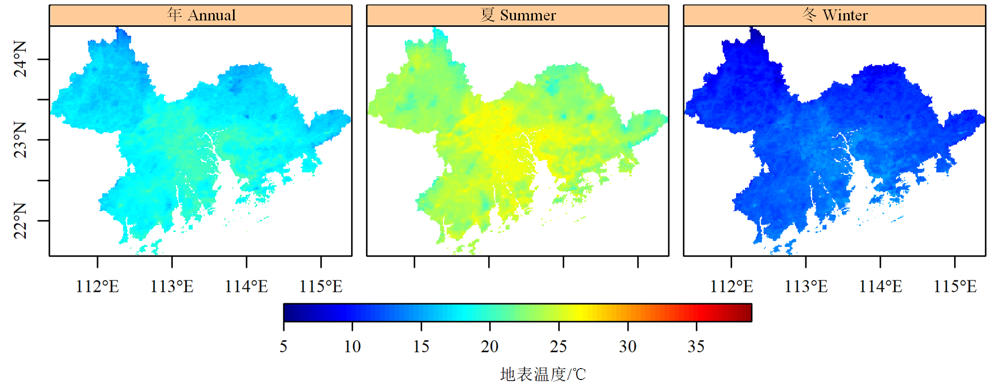
Figure 4 Spatial distribution of annual, summer and winter nighttime averaged LST for GBA, China in 2001-2020
| 地区 Region | 地表温度 LST/℃ | |||||
|---|---|---|---|---|---|---|
| 年平均(白天) Annual (daytime) | 夏(白天) Summer (daytime) | 冬(白天) Winter (daytime) | 年平均(夜间) Annual (nighttime) | 夏(夜间) Summer (nighttime) | 冬(夜间) Winter (nighttime) | |
| 大湾区 GBA | 24.980 | 30.432 | 18.891 | 17.948 | 23.866 | 11.833 |
| 东莞 Dongguan | 27.119 | 33.537 | 20.895 | 19.426 | 25.344 | 13.331 |
| 佛山 Foshan | 25.863 | 32.565 | 19.049 | 19.234 | 25.607 | 12.782 |
| 广州 Guangzhou | 25.206 | 31.283 | 19.007 | 18.006 | 24.300 | 11.724 |
| 香港 Hongkong | 25.000 | 29.048 | 19.994 | 18.815 | 23.582 | 13.697 |
| 惠州 Huizhou | 24.801 | 29.761 | 19.064 | 17.379 | 23.158 | 11.448 |
| 江门 Jiangmen | 25.179 | 29.955 | 19.736 | 18.375 | 23.958 | 12.606 |
| 澳门 Macao | 25.657 | 30.804 | 19.703 | 19.819 | 25.155 | 14.078 |
| 深圳 Shenzhen | 26.644 | 32.137 | 20.804 | 19.104 | 24.597 | 13.337 |
| 肇庆 Zhaoqing | 23.961 | 29.524 | 17.324 | 17.039 | 23.167 | 10.604 |
| 中山 Zhongshan | 26.212 | 32.212 | 20.159 | 19.650 | 25.386 | 13.543 |
| 珠海 Zhuhai | 25.406 | 30.253 | 19.811 | 19.431 | 24.892 | 13.601 |
Table 2 Statistical results of the averaged land surface temperature (LST) from 2001 to 2020 in GBA, China
| 地区 Region | 地表温度 LST/℃ | |||||
|---|---|---|---|---|---|---|
| 年平均(白天) Annual (daytime) | 夏(白天) Summer (daytime) | 冬(白天) Winter (daytime) | 年平均(夜间) Annual (nighttime) | 夏(夜间) Summer (nighttime) | 冬(夜间) Winter (nighttime) | |
| 大湾区 GBA | 24.980 | 30.432 | 18.891 | 17.948 | 23.866 | 11.833 |
| 东莞 Dongguan | 27.119 | 33.537 | 20.895 | 19.426 | 25.344 | 13.331 |
| 佛山 Foshan | 25.863 | 32.565 | 19.049 | 19.234 | 25.607 | 12.782 |
| 广州 Guangzhou | 25.206 | 31.283 | 19.007 | 18.006 | 24.300 | 11.724 |
| 香港 Hongkong | 25.000 | 29.048 | 19.994 | 18.815 | 23.582 | 13.697 |
| 惠州 Huizhou | 24.801 | 29.761 | 19.064 | 17.379 | 23.158 | 11.448 |
| 江门 Jiangmen | 25.179 | 29.955 | 19.736 | 18.375 | 23.958 | 12.606 |
| 澳门 Macao | 25.657 | 30.804 | 19.703 | 19.819 | 25.155 | 14.078 |
| 深圳 Shenzhen | 26.644 | 32.137 | 20.804 | 19.104 | 24.597 | 13.337 |
| 肇庆 Zhaoqing | 23.961 | 29.524 | 17.324 | 17.039 | 23.167 | 10.604 |
| 中山 Zhongshan | 26.212 | 32.212 | 20.159 | 19.650 | 25.386 | 13.543 |
| 珠海 Zhuhai | 25.406 | 30.253 | 19.811 | 19.431 | 24.892 | 13.601 |
| 时段 Period | 相关系数 Correlation coefficient | ||
|---|---|---|---|
| 年平均 Annual | 夏 Summer | 冬 Winter | |
| EVI.VS.白天地表温度 EVI.VS. Daytime LST | -0.718 | -0.606 | -0.571 |
| EVI.VS.夜间地表温度 EVI.VS. Nighttime LST | -0.933 | -0.898 | -0.812 |
Table 3 Correlation coefficients between EVI and land surface temperature
| 时段 Period | 相关系数 Correlation coefficient | ||
|---|---|---|---|
| 年平均 Annual | 夏 Summer | 冬 Winter | |
| EVI.VS.白天地表温度 EVI.VS. Daytime LST | -0.718 | -0.606 | -0.571 |
| EVI.VS.夜间地表温度 EVI.VS. Nighttime LST | -0.933 | -0.898 | -0.812 |
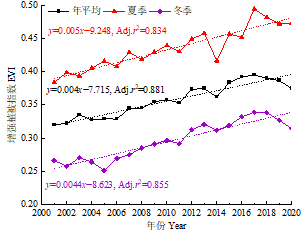
Figure 5 Temporal trends of averaged EVI for GBA,China in 2001-2020
| 地区 Region | 增强植被指数 EVI | ||
|---|---|---|---|
| 年平均 Annual | 夏 Summer | 冬 Winter | |
| 东莞 Dongguan | 0.002 (Adj.r2=0.500) | 0.004 (Adj. r2=0.483) | 0.002 (Adj. r2=0.536) |
| 佛山 Foshan | 0.003 (Adj.r2=0.717) | 0.005 (Adj. r2=0.678) | 0.003 (Adj. r2=0.718) |
| 广州 Guangzhou | 0.003 (Adj. r2=0.761) | 0.005 (Adj. r2=0.652) | 0.004 (Adj. r2=0.779) |
| 香港 Hongkong | 0.003 (Adj. r2=0.835) | 0.003 (Adj. r2=0.680) | 0.004 (Adj. r2=0.791) |
| 惠州 Huizhou | 0.004 (Adj. r2=0.838) | 0.004 (Adj. r2=0.855) | 0.004 (Adj. r2=0.810) |
| 江门 Jiangmen | 0.004 (Adj. r2=0.850) | 0.005 (Adj. r2=0.802) | 0.005 (Adj. r2=0.859) |
| 澳门 Macao | 0.002 (Adj. r2=0.598) | 0.003* (Adj. r2=0.198) | 0.002 (Adj. r2=0.646) |
| 深圳 Shenzhen | 0.003 (Adj. r2=0.803) | 0.004 (Adj. r2=0.659) | 0.003 (Adj. r2=0.748) |
| 肇庆 Zhaoqing | 0.005 (Adj. r2=0.900) | 0.006 (Adj. r2=0.836) | 0.006 (Adj. r2=0.833) |
| 中山 Z hongshan | 0.001 (Adj. r2=0.405) | 0.003 (Adj. r2=0.574) | 0.002 (Adj. r2=0.567) |
| 珠海 Zhuhai | 0.002 (Adj. r2=0.683) | 0.002 (Adj. r2=0.586) | 0.003 (Adj. r2=0.790) |
Table 4 Temporal trends of EVI for 11 cities in GBA, China in 2001-2020
| 地区 Region | 增强植被指数 EVI | ||
|---|---|---|---|
| 年平均 Annual | 夏 Summer | 冬 Winter | |
| 东莞 Dongguan | 0.002 (Adj.r2=0.500) | 0.004 (Adj. r2=0.483) | 0.002 (Adj. r2=0.536) |
| 佛山 Foshan | 0.003 (Adj.r2=0.717) | 0.005 (Adj. r2=0.678) | 0.003 (Adj. r2=0.718) |
| 广州 Guangzhou | 0.003 (Adj. r2=0.761) | 0.005 (Adj. r2=0.652) | 0.004 (Adj. r2=0.779) |
| 香港 Hongkong | 0.003 (Adj. r2=0.835) | 0.003 (Adj. r2=0.680) | 0.004 (Adj. r2=0.791) |
| 惠州 Huizhou | 0.004 (Adj. r2=0.838) | 0.004 (Adj. r2=0.855) | 0.004 (Adj. r2=0.810) |
| 江门 Jiangmen | 0.004 (Adj. r2=0.850) | 0.005 (Adj. r2=0.802) | 0.005 (Adj. r2=0.859) |
| 澳门 Macao | 0.002 (Adj. r2=0.598) | 0.003* (Adj. r2=0.198) | 0.002 (Adj. r2=0.646) |
| 深圳 Shenzhen | 0.003 (Adj. r2=0.803) | 0.004 (Adj. r2=0.659) | 0.003 (Adj. r2=0.748) |
| 肇庆 Zhaoqing | 0.005 (Adj. r2=0.900) | 0.006 (Adj. r2=0.836) | 0.006 (Adj. r2=0.833) |
| 中山 Z hongshan | 0.001 (Adj. r2=0.405) | 0.003 (Adj. r2=0.574) | 0.002 (Adj. r2=0.567) |
| 珠海 Zhuhai | 0.002 (Adj. r2=0.683) | 0.002 (Adj. r2=0.586) | 0.003 (Adj. r2=0.790) |
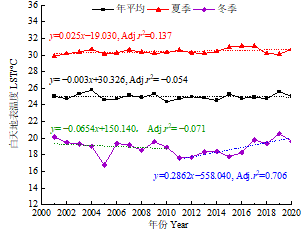
Figure 6 The temporal trends of averaged daytime land surface temperature for GBA, China in 2001-2020
| 地区 Region | 白天地表温度 Daytime LST/℃ | ||
|---|---|---|---|
| 年平均 Annual | 夏 Summer | 冬 Winter | |
| 东莞 Dongguan | 0.063** (Adj.r2=0.358) | 0.113* (Adj.r2=0.581) | 0.030 (Adj.r2=-0.117), 0.359* (Adj.r2=0.714) |
| 佛山 Foshan | 0.066** (Adj.r2=0.271) | 0.116* (Adj.r2=0.686) | -0.082 (Adj.r2=-0.046), 0.337* (Adj.r2=0.764) |
| 广州 Guangzhou | -0.005 (Adj.r2=-0.050) | 0.030 (Adj.r2=0.151) | -0.092 (Adj.r2=-0.007), 0.313* (Adj.r2=0.638) |
| 香港 Hongkong | -0.011 (Adj.r2=-0.023) | -0.012 (Adj.r2=-0.029) | -0.047 (Adj.r2=-0.093), 0.205* (Adj.r2=0.458) |
| 惠州 Huizhou | -0.026 (Adj.r2=0.154) | -0.005 (Adj.r2=-0.050) | -0.042 (Adj.r2=-0.010), 0.238* (Adj.r2=0.546) |
| 江门 Jiangmen | -0.028 (Adj.r2=0.070) | 0.007 (Adj.r2=-0.040) | -0.078 (Adj.r2=-0.071), 0.270 (Adj.r2=0.530) |
| 澳门 Macao | 0.009 (Adj.r2=-0.040) | 0.006 (Adj.r2=-0.052) | -0.007 (Adj.r2=-0.125), 0.316* (Adj.r2=0.547) |
| 深圳 Shenzhen | 0.019 (Adj.r2=0.004) | 0.052** (Adj.r2=0.282) | 0.012 (Adj.r2=-0.124), 0.278* (Adj.r2=0.573) |
| 肇庆 Zhaoqing | -0.007 (Adj.r2=-0.045) | 0.006 (Adj.r2=-0.045) | -0.097 (Adj.r2=-0.023), 0.295* (Adj.r2=0.833) |
| 中山 Zhongshan | 0.061** (Adj.r2=0.308) | 0.121* (Adj.r2=0.663) | 0.0210 (Adj.r2=-0.121), 0.3386* (Adj.r2=0.635) |
| 珠海 Zhuhai | 0.020 (Adj.r2=0.025) | 0.039** (Adj.r2=0.230) | -0.034 (Adj.r2=-0.115), 0.314* (Adj.r2=0.627) |
Table 5 Temporal trends of daytime LST for 11 cities in GBA, China in 2001-2020
| 地区 Region | 白天地表温度 Daytime LST/℃ | ||
|---|---|---|---|
| 年平均 Annual | 夏 Summer | 冬 Winter | |
| 东莞 Dongguan | 0.063** (Adj.r2=0.358) | 0.113* (Adj.r2=0.581) | 0.030 (Adj.r2=-0.117), 0.359* (Adj.r2=0.714) |
| 佛山 Foshan | 0.066** (Adj.r2=0.271) | 0.116* (Adj.r2=0.686) | -0.082 (Adj.r2=-0.046), 0.337* (Adj.r2=0.764) |
| 广州 Guangzhou | -0.005 (Adj.r2=-0.050) | 0.030 (Adj.r2=0.151) | -0.092 (Adj.r2=-0.007), 0.313* (Adj.r2=0.638) |
| 香港 Hongkong | -0.011 (Adj.r2=-0.023) | -0.012 (Adj.r2=-0.029) | -0.047 (Adj.r2=-0.093), 0.205* (Adj.r2=0.458) |
| 惠州 Huizhou | -0.026 (Adj.r2=0.154) | -0.005 (Adj.r2=-0.050) | -0.042 (Adj.r2=-0.010), 0.238* (Adj.r2=0.546) |
| 江门 Jiangmen | -0.028 (Adj.r2=0.070) | 0.007 (Adj.r2=-0.040) | -0.078 (Adj.r2=-0.071), 0.270 (Adj.r2=0.530) |
| 澳门 Macao | 0.009 (Adj.r2=-0.040) | 0.006 (Adj.r2=-0.052) | -0.007 (Adj.r2=-0.125), 0.316* (Adj.r2=0.547) |
| 深圳 Shenzhen | 0.019 (Adj.r2=0.004) | 0.052** (Adj.r2=0.282) | 0.012 (Adj.r2=-0.124), 0.278* (Adj.r2=0.573) |
| 肇庆 Zhaoqing | -0.007 (Adj.r2=-0.045) | 0.006 (Adj.r2=-0.045) | -0.097 (Adj.r2=-0.023), 0.295* (Adj.r2=0.833) |
| 中山 Zhongshan | 0.061** (Adj.r2=0.308) | 0.121* (Adj.r2=0.663) | 0.0210 (Adj.r2=-0.121), 0.3386* (Adj.r2=0.635) |
| 珠海 Zhuhai | 0.020 (Adj.r2=0.025) | 0.039** (Adj.r2=0.230) | -0.034 (Adj.r2=-0.115), 0.314* (Adj.r2=0.627) |
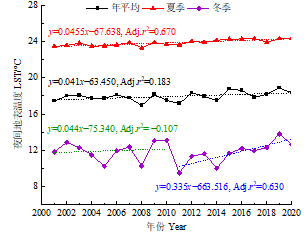
Figure 7 The temporal trends of averaged nighttime land surface temperature for GBA, China in 2001-2020
| 地区Region | 夜间地表温度 Nighttime LST/℃ | ||
|---|---|---|---|
| 年平均 Annual | 夏 Summer | 冬 Winter | |
| 东莞 Dongguan | 0.067* (Adj.r2=0.496) | 0.069* (Adj.r2=0.637) | 0.081 (Adj.r2=-0.051), 0.370* (Adj.r2=0.735) |
| 佛山 Foshan | 0.037 (Adj.r2=0.133) | 0.045* (Adj.r2=0.507) | 0.028 (Adj.r2=-0.119), 0.358* (Adj.r2=0.691) |
| 广州 Guangzhou | 0.046** (Adj.r2=0.233) | 0.044* (Adj.r2=0.524) | 0.008 (Adj.r2=-0.124), 0.376* (Adj.r2=0.734) |
| 香港 Hongkong | 0.034 (Adj.r2=0.158) | 0.046** (Adj.r2=0.218) | 0.040 (Adj.r2=-0.099), 0.246* (Adj.r2=0.520) |
| 惠州 Huizhou | 0.058* (Adj.r2=0.444) | 0.053* (Adj.r2=0.648) | 0.066 (Adj.r2=-0.075), 0.315* (Adj.r2=0.656) |
| 江门 Jiangmen | 0.044 (Adj.r2=0.158) | 0.049* (Adj.r2=0.566) | 0.037 (Adj.r2=-0.114), 0.341* (Adj.r2=0.640) |
| 澳门 Macao | 0.019 (Adj.r2=-0.010) | 0.029 (Adj.r2=0.058) | -0.021 (Adj.r2=-0.120), 0.296* (Adj.r2=0.647) |
| 深圳 Shenzhen | 0.066* (Adj.r2=0.467) | 0.065* (Adj.r2=0.502) | 0.081 (Adj.r2=-0.041), 0.333* (Adj.r2=0.670) |
| 肇庆 Zhaoqing | 0.014 (Adj.r2=-0.033) | 0.032* (Adj.r2=0.551) | 0.042 (Adj.r2=-0.113), 0.321** (Adj.r2=0.404) |
| 中山 Zhongshan | 0.056** (Adj.r2=0.312) | 0.047* (Adj.r2=0.416) | 0.027 (Adj.r2=-0.118), 0.350* (Adj.r2=0.675) |
| 珠海 Zhuhai | 0.049 (Adj.r2=0.199) | 0.046** (Adj.r2=0.384) | 0.054 (Adj.r2=-0.088), 0.334* (Adj.r2=0.703) |
Table 6 Temporal trends of nighttime LST for 11 cities in GBA, China in 2001-2020
| 地区Region | 夜间地表温度 Nighttime LST/℃ | ||
|---|---|---|---|
| 年平均 Annual | 夏 Summer | 冬 Winter | |
| 东莞 Dongguan | 0.067* (Adj.r2=0.496) | 0.069* (Adj.r2=0.637) | 0.081 (Adj.r2=-0.051), 0.370* (Adj.r2=0.735) |
| 佛山 Foshan | 0.037 (Adj.r2=0.133) | 0.045* (Adj.r2=0.507) | 0.028 (Adj.r2=-0.119), 0.358* (Adj.r2=0.691) |
| 广州 Guangzhou | 0.046** (Adj.r2=0.233) | 0.044* (Adj.r2=0.524) | 0.008 (Adj.r2=-0.124), 0.376* (Adj.r2=0.734) |
| 香港 Hongkong | 0.034 (Adj.r2=0.158) | 0.046** (Adj.r2=0.218) | 0.040 (Adj.r2=-0.099), 0.246* (Adj.r2=0.520) |
| 惠州 Huizhou | 0.058* (Adj.r2=0.444) | 0.053* (Adj.r2=0.648) | 0.066 (Adj.r2=-0.075), 0.315* (Adj.r2=0.656) |
| 江门 Jiangmen | 0.044 (Adj.r2=0.158) | 0.049* (Adj.r2=0.566) | 0.037 (Adj.r2=-0.114), 0.341* (Adj.r2=0.640) |
| 澳门 Macao | 0.019 (Adj.r2=-0.010) | 0.029 (Adj.r2=0.058) | -0.021 (Adj.r2=-0.120), 0.296* (Adj.r2=0.647) |
| 深圳 Shenzhen | 0.066* (Adj.r2=0.467) | 0.065* (Adj.r2=0.502) | 0.081 (Adj.r2=-0.041), 0.333* (Adj.r2=0.670) |
| 肇庆 Zhaoqing | 0.014 (Adj.r2=-0.033) | 0.032* (Adj.r2=0.551) | 0.042 (Adj.r2=-0.113), 0.321** (Adj.r2=0.404) |
| 中山 Zhongshan | 0.056** (Adj.r2=0.312) | 0.047* (Adj.r2=0.416) | 0.027 (Adj.r2=-0.118), 0.350* (Adj.r2=0.675) |
| 珠海 Zhuhai | 0.049 (Adj.r2=0.199) | 0.046** (Adj.r2=0.384) | 0.054 (Adj.r2=-0.088), 0.334* (Adj.r2=0.703) |

Figure 8 The temporal trends of averaged air temperature and land surface temperature for GBA, China in 2001-2020
| [1] |
BREN D’AMOUR C, REITSMA F, BAIOCCHI G, et al., 2017. Future urban land expansion and implications for global croplands[J]. Proceedings of the National Academy of Sciences of the United States of America, 114(34): 8939-8944.
DOI PMID |
| [2] |
CHAPLIN-KRAMER R, SHARP R P, WEIL C, et al., 2019. Global modeling of nature's contributions to people[J]. Science, 366(6462): 255-258.
DOI URL |
| [3] |
CHEN J K, ZHAN W F, DU P J, et al., 2022. Seasonally disparate responses of surface thermal environment to 2D/3D urban morphology[J]. Building and Environment, 214: 108928.
DOI URL |
| [4] |
FU P, XIE Y H, WENG Q H, et al., 2019. A physical model-based method for retrieving urban land surface temperatures under cloudy conditions[J]. Remote Sensing of Environment, 230(1): 111191.
DOI URL |
| [5] |
LIU Q, PIAO S, FU Y H, et al., 2019b. Climatic warming increases spatial synchrony in spring vegetation phenology across the northern hemisphere[J]. Geophysical Research Letters, 46(3): 1641-1650.
DOI URL |
| [6] |
LIU S Q, YU Q, WEI C, 2019a. Spatial-temporal dynamic analysis of land use and landscape pattern in Guangzhou, China: Exploring the driving forces from an urban sustainability perspective[J]. Sustainability, 11(23): 6675.
DOI URL |
| [7] |
LIU Y X, WANG Y L, PENG J, et al., 2015. Correlations between urbanization and vegetation degradation across the world’s metropolises using DMSP/OLS nighttime light data[J]. Remote Sensing, 7(2): 2067-2088.
DOI URL |
| [8] |
MAHMOUD S H, GAN T Y, 2018. Impact of anthropogenic climate change and human activities on environment and ecosystem services in arid regions[J]. Science of the Total Environment, 633: 1329-1344.
DOI URL |
| [9] |
PENG J, JIA J L, LIU Y X, et al., 2018. Seasonal contrast of the dominant factors for spatial distribution of land surface temperature in urban areas[J]. Remote Sensing of Environment, 215: 255-267.
DOI URL |
| [10] |
QIU B W, YE Z Y, CHEN C C, et al., 2022. Dense canopies browning overshadowed by global greening dominant in sparse canopies[J]. Science of the Total Environment, 826(20): 154222.
DOI URL |
| [11] |
QUAN J L, ZHAN W F, CHEN Y H, et al., 2016. Time series decomposition of remotely sensed land surface temperature and investigation of trends and seasonal variations in surface urban heat islands[J]. Journal of Geophysical Research: Atmospheres, 121(6): 2638-2657.
DOI URL |
| [12] |
WU P H, YIN Z X, YANG H, et al., 2019. Reconstructing geostationary satellite land surface temperature imagery based on a multiscale feature connected convolutional neural network[J]. Remote Sensing, 11(3): 300.
DOI URL |
| [13] |
XU J H, ZHAO Y, SUN C G, et al., 2021. Exploring the variation trend of urban expansion, land surface temperature, and ecological quality and their interrelationships in Guangzhou, China, from 1987 to 2019 [J]. Remote Sensing, 13(5): 1019.
DOI URL |
| [14] |
XU J H, ZHAO Y, ZHONG K W, et al., 2018. Measuring spatio-temporal dynamics of impervious surface in Guangzhou, China, from 1988 to 2015, using time-series Landsat imagery[J]. Science of The Total Environment, 627: 264-281.
DOI URL |
| [15] |
YAO R, WANG L C, GUI X, et al., 2017b. Urbanization effects on vegetation and surface urban heat islands in China’s Yangtze River Basin[J]. Remote Sensing, 9(6): 540.
DOI URL |
| [16] |
YAO R, WANG L C, HUANG X, et al., 2017a. Investigation of urbanization effects on land surface phenology in northeast China during 2001-2015 [J]. Remote Sensing, 9(1): 66.
DOI URL |
| [17] |
YUAN W P, PIAO S L, QIN D H, et al., 2017. Influence of vegetation growth on the enhanced seasonality of atmospheric CO2[J]. Global Biogeochemical Cycles, 32(1): 32-41.
DOI URL |
| [18] | ZHOU D C, ZHAO S Q, LIU S G, et al., 2014. Spatiotemporal trends of terrestrial vegetation activity along the urban development intensity gradient in China's 32 major cities[J]. Science of the Total Environnment, 488-489(1): 136-145. |
| [19] |
ZULLO F, FAZIO G, ROMANO B, et al., 2019. Effects of urban growth spatial pattern (UGSP) on the land surface temperature (LST): A study in the Po Valley (Italy)[J]. Science of The Total Environment, 650(Part 2): 1740-1751.
DOI URL |
| [20] | 陈丹, 钱峻屏, 张虹鸥, 等, 2006. 基于遥感数据的广东植被指数时空变化研究[J]. 生态科学, 25(5): 412-416. |
| CHEN D, QIAN J P, ZHANG H O, et al., 2006. The spatio-temporal patterns of VI in Guangdong based RS data[J]. Ecologic Science, 25(5): 412-416. | |
| [21] | 邓玉娇, 王捷纯, 徐杰, 等, 2021. 广东省NDVI时空变化特征及其对气候因子的响应[J]. 生态环境学报, 30(1): 37-43. |
| DENG Y J, WANG J C, XU J, et al., 2021. Spatiotemporal variation of NDVI and its response to climatic factors in Guangdong Province[J]. Ecology and Environmental Science, 30(01): 37-43. | |
| [22] | 冯娴慧, 曾芝琳, 张德顺, 2022. 基于MODIS NDVI数据的粤港澳大湾区植被覆盖时空演变[J]. 中国城市林业, 20(1): 1-6, 28. |
| FENG X H, ZENG Z L, ZHAND D S, 2022. Temporal-spatial evolution of vegetation coverage in Guangdong-HongKong-Macao Greater Bay Area based on MODIS NDVI data[J]. Journal of Chinese Urban Forestry, 20(1): 1-6, 28. | |
| [23] | 何全军, 2019. 基于MODIS数据的珠三角地区NDVI时空变化特征及对气象因素的响应[J]. 生态环境学报, 28(9): 1722-1730. |
| HE Q J, 2019. Spatio-temporal variation of NDVI and its response to meteorological factors in Pearl River Delta based on MODIS data[J]. Ecology and Environmental Science, 28(9): 1722-1730. | |
| [24] |
刘恒孜, 吕宁, 姜侯, 等, 2022. 基于DCT-PLS算法的MODIS LST缺值填补方法研究[J]. 地球信息科学学报, 24(2): 378-390.
DOI |
| LIU H Z, LÜ N, JIANG H, et al., 2022. Research on gaps filling of MODIS LST based on DCT-PLS[J]. Journal of Geo-information Science, 24(2): 378-390. | |
| [25] | 马玉翎, 2020. 粤港澳大湾区城市群不透水面空间结构时空变化对地表热环境影响的研究[M]. 昆明: 云南师范大学. |
| MA Y L, 2020. Impact of spatio-temporal changes of impervious surfaces spatial structure on land surface thermal environment in urban agglomeration of Guangdong-Hong Kong-Macao Greater Bay Area[M]. Kunming: Yunnan Normal University. | |
| [26] | 阮柱, 2021. 基于NDVI重构的广东省NDVI变化及其驱动因素分析[M]. 广州: 中国科学院大学 (中国科学院广州地球化学研究所). |
| RUAN Z, 2021. Analysis of vegetation changes and driving factors in guangdong province based on the reconstructed NDVI[M]. Guangzhou: Guangzhou Institute of Geochemistry, Chinese Academy of Science. | |
| [27] | 孙喆, 2020. 高密度城区形态要素对热环境的影响作用--以北京市五环内区域为例[J]. 生态环境学报, 29(10): 2020-2027. |
| SUN Z, 2020. Impact of urban morphology factors on thermal environment in high density urban areas: A case of Beijing within 5th ring road[J]. Ecology and Environmental Sciences, 29(10): 2020-2027. | |
| [28] | 王思, 张路路, 林伟彪, 等, 2022. 基于MODIS-NDVI的广东省植被覆盖与土地利用变化研究[J]. 生态学报, 42(6): 2149-2163. |
| WANG S, ZHANG L L, LIN W B, et al., 2022. Study on vegetation coverage and land-use change of Guangdong Province based on MODIS-NDVI[J]. Acta Ecologica Sinica, 42(6): 2149-2163. | |
| [29] | 王雪, 于德永, 曹茜, 等, 2017. 城市景观格局与地表温度的定量关系分析[J]. 北京师范大学学报(自然科学版), 53(3): 329-336. |
| WANG X, YU D Y, CAO Q, et al., 2017. Quantitative relationship between urban landscape pattern and surface temperature[J]. Journal of Beijing Normal University (Natural Science), 53(3): 329-336. | |
| [30] | 王一帆, 徐涵秋, 2020. 利用MODIS EVI时间序列数据分析福建省植被变化 (2000-2017年)[J]. 遥感技术与应用, 35(1): 245-254. |
| WANG Y F, XU H Q, 2020. Analysis of vegetation changes in Fujian Province using MODIS EVI time series data (2000-2017)[J]. Remote Sensing Technology and Application, 35(1): 245-254. | |
| [31] | 王渊, 赵宇豪, 吴健生, 2020. 基于Google Earth Engine云计算的城市群生态质量长时序动态监测--以粤港澳大湾区为例[J]. 生态学报, 40(23): 8461-8473. |
| WANG Y, ZHAO Y H, WU J S, 2020. Dynamic monitoring of long time series of ecological quality in urban agglomerations using Google Earth Engine cloud computing: A case study of the Guangdong-Hong Kong-Macao Greater Bay Area, China[J]. Acta Ecologica Sinica, 40(23): 8461-8473. | |
| [32] | 吴波, 颜东明, 2021. 粤港澳大湾区地表温度变化影响因素分析[J]. 惠州学院学报, 41(6): 56-63. |
| WU B, YAN D M, 2021. Analysis of influencing factors of surface temperature change in Guangdong-Hong Kong-Macao Greater Bay Area[J]. Journal of Huizhou University, 41(6): 56-63. | |
| [33] | 闫章美, 周德成, 张良侠, 2021. 我国三大城市群地区城市和农业用地地表热环境效应对比研究[J]. 生态学报, 41(22): 8870-8881. |
| YAN Z M, ZHOU D C, ZHANG L X, 2021. Contrasting surface thermal environmental effects of urban and agricultural lands in three major urban agglomerations in China[J]. Acta Ecologica Sinica, 41(22): 8870-8881. | |
| [34] |
杨智威, 陈颖彪, 吴志峰, 等, 2018. 粤港澳大湾区建设用地扩张与城市热岛扩张耦合态势研究[J]. 地球信息科学学报, 20(11): 1592-1603.
DOI |
| YANG Z W, CHEN Y B, WU Z F, et al., 2018 The coupling between construction land expansion and urban heat island expansion in Guangdong-Hong Kong-Macao Greater Bay[J]. Journal of Geo-information Science, 20(11): 1592-1603. |
| Viewed | ||||||
|
Full text |
|
|||||
|
Abstract |
|
|||||
Copyright © 2021 Editorial Office of ACTA PETROLEI SINICA
Address:No. 6 Liupukang Street, Xicheng District, Beijing, P.R.China, 510650
Tel: 86-010-62067128, 86-010-62067137, 86-010-62067139
Fax: 86-10-62067130
Email: syxb@cnpc.com.cn
Support byBeijing Magtech Co.ltd, E-mail:support@magtech.com.cn