Ecology and Environment ›› 2022, Vol. 31 ›› Issue (3): 572-582.DOI: 10.16258/j.cnki.1674-5906.2022.03.016
• Research Articles • Previous Articles Next Articles
CHEN Bishan( ), ZHENG Kanghui, WANG Jing, YE Linhai, SONG Junxia*()
Received:2020-09-15
Online:2022-03-18
Published:2022-05-25
Contact:
SONG Junxia
陈碧珊(), 郑康慧, 王璟, 叶林海, 宋军霞*()
通讯作者:
宋军霞
作者简介:陈碧珊(1982年生),女,副教授,博士,主要从事土壤地理学、环境演变与对策研究。E-mail: chenbishan2008@126.com
基金资助:CLC Number:
CHEN Bishan, ZHENG Kanghui, WANG Jing, YE Linhai, SONG Junxia. Content Characteristics and Health Risk Analysis of Mercury in Soil-crop System in Leizhou Peninsula[J]. Ecology and Environment, 2022, 31(3): 572-582.
陈碧珊, 郑康慧, 王璟, 叶林海, 宋军霞. 雷州半岛土壤-农作物汞元素含量特征与健康风险分析[J]. 生态环境学报, 2022, 31(3): 572-582.
Add to citation manager EndNote|Ris|BibTeX
URL: https://www.jeesci.com/EN/10.16258/j.cnki.1674-5906.2022.03.016

Figure 1 Location of study area and distribution of sampling points (a) Shows the location of Leizhou Peninsula in Guangdong Province; (b) Shows the distribution of soil sampling points; (c) Shows the distribution of crop sampling points
| 参数 Parameter | 定义 Definition | 单位 Unit | 参考值 Reference value | 文献来源 Literature sources | |
|---|---|---|---|---|---|
| 儿童 Children | 成人 Adult | ||||
| Csoil | 土壤汞质量分数 | mg∙kg-1 | 本研究 | ||
| IngR | 经口摄入量 | mg∙d-1 | 200 | 100 | 中华人民共和国环保部, |
| EF | 暴露频率 | d∙a-1 | 350 | 350 | 中华人民共和国环保部, |
| ED | 持续暴露 时间 | a | 6 | 24 | 中华人民共和国环保部, |
| BW | 体重 | kg | 15.9 | 56.8 | 中华人民共和国环保部, |
| AT | 平均暴露 时间 | d | 365ED | 365ED | 赵秀阁等, |
| InhR | 土壤吸入量 | m3∙d-1 | 7.5 | 14.5 | 中华人民共和国环保部, |
| PEF | 颗粒物排放因子 | m3∙kg-1 | 1.36×10⁹ | 1.36×10⁹ | 中华人民共和国环保部, |
| SA | 皮肤接触表面积 | cm2 | 2800 | 5700 | 赵秀阁等, |
| AF | 皮肤对土壤粘附系数 | mg∙cm-2 | 0.2 | 0.07 | 赵秀阁等, |
| ABS | 皮肤对汞吸收系数 | 无量纲 | 0.001 | 0.001 | 中华人民共和国环保部, |
Table 1 Exposure parameters of health risk assessment model
| 参数 Parameter | 定义 Definition | 单位 Unit | 参考值 Reference value | 文献来源 Literature sources | |
|---|---|---|---|---|---|
| 儿童 Children | 成人 Adult | ||||
| Csoil | 土壤汞质量分数 | mg∙kg-1 | 本研究 | ||
| IngR | 经口摄入量 | mg∙d-1 | 200 | 100 | 中华人民共和国环保部, |
| EF | 暴露频率 | d∙a-1 | 350 | 350 | 中华人民共和国环保部, |
| ED | 持续暴露 时间 | a | 6 | 24 | 中华人民共和国环保部, |
| BW | 体重 | kg | 15.9 | 56.8 | 中华人民共和国环保部, |
| AT | 平均暴露 时间 | d | 365ED | 365ED | 赵秀阁等, |
| InhR | 土壤吸入量 | m3∙d-1 | 7.5 | 14.5 | 中华人民共和国环保部, |
| PEF | 颗粒物排放因子 | m3∙kg-1 | 1.36×10⁹ | 1.36×10⁹ | 中华人民共和国环保部, |
| SA | 皮肤接触表面积 | cm2 | 2800 | 5700 | 赵秀阁等, |
| AF | 皮肤对土壤粘附系数 | mg∙cm-2 | 0.2 | 0.07 | 赵秀阁等, |
| ABS | 皮肤对汞吸收系数 | 无量纲 | 0.001 | 0.001 | 中华人民共和国环保部, |
| 参数 Parameter | 单位 Unit | 参考值 Reference value | 文献来源 Literature sources | |||||||||||||
|---|---|---|---|---|---|---|---|---|---|---|---|---|---|---|---|---|
| 2-5岁 | 6-17岁 | 18-44岁 | 45-59岁 | ≥60岁 | ||||||||||||
| 男 | 女 | 男 | 女 | 男 | 女 | 男 | 女 | 男 | 女 | |||||||
| RIR | g∙d-1 | 87.5 | 110 | 242 | 194 | 261 | 197 | 219 | 198 | 228 | 208 | 唐洪磊等, | ||||
| Crice | μg∙g-1 | 本研究 | ||||||||||||||
| VIR | g∙d-1 | 163 | 110 | 132 | 176 | 224 | 234 | 245 | 239 | 416 | 319 | 唐洪磊等, | ||||
| Cveg | μg∙g-1 | 本研究 | ||||||||||||||
| FIR | g∙d-1 | 93.8 | 75.5 | 127 | 109 | 94 | 114 | 84.4 | 131 | 118 | 130 | 唐洪磊等, | ||||
| Cfruit | μg∙g-1 | 本研究 | ||||||||||||||
Table 2 Parameters of health risk assessment model for mercury in crops
| 参数 Parameter | 单位 Unit | 参考值 Reference value | 文献来源 Literature sources | |||||||||||||
|---|---|---|---|---|---|---|---|---|---|---|---|---|---|---|---|---|
| 2-5岁 | 6-17岁 | 18-44岁 | 45-59岁 | ≥60岁 | ||||||||||||
| 男 | 女 | 男 | 女 | 男 | 女 | 男 | 女 | 男 | 女 | |||||||
| RIR | g∙d-1 | 87.5 | 110 | 242 | 194 | 261 | 197 | 219 | 198 | 228 | 208 | 唐洪磊等, | ||||
| Crice | μg∙g-1 | 本研究 | ||||||||||||||
| VIR | g∙d-1 | 163 | 110 | 132 | 176 | 224 | 234 | 245 | 239 | 416 | 319 | 唐洪磊等, | ||||
| Cveg | μg∙g-1 | 本研究 | ||||||||||||||
| FIR | g∙d-1 | 93.8 | 75.5 | 127 | 109 | 94 | 114 | 84.4 | 131 | 118 | 130 | 唐洪磊等, | ||||
| Cfruit | μg∙g-1 | 本研究 | ||||||||||||||
| 土壤类型 Soil type | 样本数 Number of samples | 指标 Index/(mg∙kg-1) | 高于背景值 Above background value | 偏度系数 Skewness coefficient | 峰度系数 Kurtosis coefficient | 变异系数 Coefficient of variation | ||||
|---|---|---|---|---|---|---|---|---|---|---|
| 范围 Range | 平均值 Average value | 标准差 Standard deviation | 样本数 Number of samples | 百分率 Percentage/% | ||||||
| 全部 Total | 128 | 0.022-0.947 | 0.121 | 0.117 | 126 | 98.4 | 7.787 | 20.510 | 0.967 | |
| 水稻田土壤 Paddy soil | 35 | 0.038-0.947 | 0.140 | 0.157 | 35 | 100 | 4.318 | 21.381 | 1.121 | |
| 蔬菜地土壤 Vegetable soil | 38 | 0.030-0.523 | 0.161 | 0.131 | 37 | 97.4 | 1.270 | 0.744 | 0.814 | |
| 果园地土壤 Orchard soil | 55 | 0.022-0.230 | 0.083 | 0.043 | 54 | 98.2 | 1.400 | 2.177 | 0.518 | |
Table 3 Characteristics of mercury content in agricultural topsoil of Leizhou Peninsula
| 土壤类型 Soil type | 样本数 Number of samples | 指标 Index/(mg∙kg-1) | 高于背景值 Above background value | 偏度系数 Skewness coefficient | 峰度系数 Kurtosis coefficient | 变异系数 Coefficient of variation | ||||
|---|---|---|---|---|---|---|---|---|---|---|
| 范围 Range | 平均值 Average value | 标准差 Standard deviation | 样本数 Number of samples | 百分率 Percentage/% | ||||||
| 全部 Total | 128 | 0.022-0.947 | 0.121 | 0.117 | 126 | 98.4 | 7.787 | 20.510 | 0.967 | |
| 水稻田土壤 Paddy soil | 35 | 0.038-0.947 | 0.140 | 0.157 | 35 | 100 | 4.318 | 21.381 | 1.121 | |
| 蔬菜地土壤 Vegetable soil | 38 | 0.030-0.523 | 0.161 | 0.131 | 37 | 97.4 | 1.270 | 0.744 | 0.814 | |
| 果园地土壤 Orchard soil | 55 | 0.022-0.230 | 0.083 | 0.043 | 54 | 98.2 | 1.400 | 2.177 | 0.518 | |
| 研究区 Study area | 雷州半岛 Leizhou Peninsula | 南宁市 Nanning City | 成都平原西部 Western Chengdu Plain | 开封市 Kaifeng City | 朝阳市 Chaoyang City | 日照市 Rizhao City |
|---|---|---|---|---|---|---|
| w(Hg)/(mg∙kg-1) | 0.121 | 0.1 | 0.153 | 0.37 | 0.04 | 0.03 |
| 样本数 Number of samples | 128 | 367 | 75 | 259 | 402 | 1089 |
| 数据来源 Data source | 本研究 | 罗启清等, | 王英英等, | 王小莉等, | 王中阳, | 段友春等, |
Table 4 Comparison of mercury content in agricultural soil between Leizhou Peninsula and other areas
| 研究区 Study area | 雷州半岛 Leizhou Peninsula | 南宁市 Nanning City | 成都平原西部 Western Chengdu Plain | 开封市 Kaifeng City | 朝阳市 Chaoyang City | 日照市 Rizhao City |
|---|---|---|---|---|---|---|
| w(Hg)/(mg∙kg-1) | 0.121 | 0.1 | 0.153 | 0.37 | 0.04 | 0.03 |
| 样本数 Number of samples | 128 | 367 | 75 | 259 | 402 | 1089 |
| 数据来源 Data source | 本研究 | 罗启清等, | 王英英等, | 王小莉等, | 王中阳, | 段友春等, |
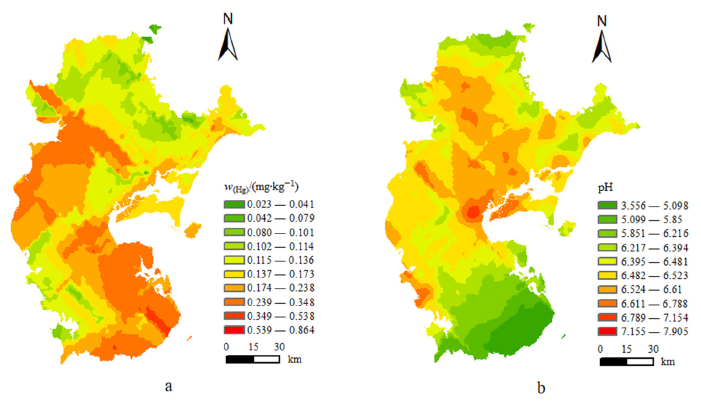
Figure 2 Mercury mass fraction (a) and pH (b) distribution of agricultural soil in Leizhou Peninsula
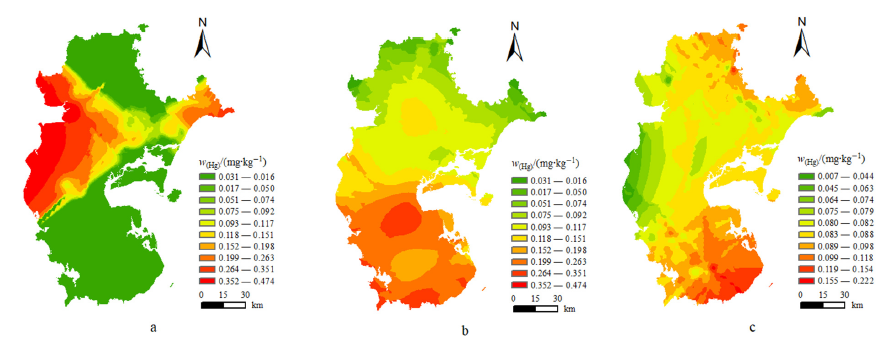
Figure 3 Distribution of mercury in different types of agricultural soils in Leizhou Peninsula (a) Paddy soil; (b) Vegetable soil; (c) Orchard soil
| 土壤类型 Soil type | 潜在生态风险指数 Potential ecological risk index (Ei) | 污染分布比例 Proportion of pollution distribution/% | |||||
|---|---|---|---|---|---|---|---|
| 范围 Range | 平均值 Average | 轻微 Slight | 中等 Medium | 强 Strong | 很强 Very strong | 极强 Pole-strength | |
| Ei<40 | 40≤Ei<80 | 80≤Ei<160 | 160≤Ei<320 | Ei≥320 | |||
| 全部 Total | 29.333-1262.667 | 161.927 | 0.78 | 25.78 | 43.75 | 20.31 | 9.38 |
| 水稻田土壤 Paddy soil | 50.667-1262.667 | 186.286 | 0 | 14.29 | 51.43 | 25.71 | 8.57 |
| 蔬菜地土壤 Vegetable soil | 40-697.333 | 214.140 | 0 | 26.32 | 26.32 | 23.68 | 23.68 |
| 果园地土壤 Orchard soil | 29.333-306.667 | 110.352 | 1.82 | 32.73 | 50.91 | 14.55 | 0 |
Table 5 Potential ecological risk index of mercury in agricultural soils of Leizhou Peninsula
| 土壤类型 Soil type | 潜在生态风险指数 Potential ecological risk index (Ei) | 污染分布比例 Proportion of pollution distribution/% | |||||
|---|---|---|---|---|---|---|---|
| 范围 Range | 平均值 Average | 轻微 Slight | 中等 Medium | 强 Strong | 很强 Very strong | 极强 Pole-strength | |
| Ei<40 | 40≤Ei<80 | 80≤Ei<160 | 160≤Ei<320 | Ei≥320 | |||
| 全部 Total | 29.333-1262.667 | 161.927 | 0.78 | 25.78 | 43.75 | 20.31 | 9.38 |
| 水稻田土壤 Paddy soil | 50.667-1262.667 | 186.286 | 0 | 14.29 | 51.43 | 25.71 | 8.57 |
| 蔬菜地土壤 Vegetable soil | 40-697.333 | 214.140 | 0 | 26.32 | 26.32 | 23.68 | 23.68 |
| 果园地土壤 Orchard soil | 29.333-306.667 | 110.352 | 1.82 | 32.73 | 50.91 | 14.55 | 0 |
| 作物品种 Crop varieties | 样品数 Number of samples | 指标 Index/(mg∙kg-1) | 偏度系数 Skewness coefficient | 峰度系数 Kurtosis coefficient | 变异系数 Coefficient of variation | |||
|---|---|---|---|---|---|---|---|---|
| 范围 Range | 标准差 Standard deviation | 中值 Median | 平均值 Average value | |||||
| 全部 Total | 65 | 0.001-0.172 | 0.029 | 0.005 | 0.015 | 3.819 | 15.806 | 1.933 |
| 稻谷 Paddy | 30 | 0.001-0.014 | 0.003 | 0.004 | 0.005 | 1.335 | 1.809 | 0.600 |
| 蔬菜 Vegetable | 21 | 0.002-0.172 | 0.045 | 0.016 | 0.033 | 2.133 | 4.053 | 1.364 |
| 水果 Fruit | 14 | 0.002-0.062 | 0.016 | 0.005 | 0.010 | 3.038 | 9.525 | 1.600 |
Table 6 Accumulation characteristics of mercury in crops in Leizhou Peninsula
| 作物品种 Crop varieties | 样品数 Number of samples | 指标 Index/(mg∙kg-1) | 偏度系数 Skewness coefficient | 峰度系数 Kurtosis coefficient | 变异系数 Coefficient of variation | |||
|---|---|---|---|---|---|---|---|---|
| 范围 Range | 标准差 Standard deviation | 中值 Median | 平均值 Average value | |||||
| 全部 Total | 65 | 0.001-0.172 | 0.029 | 0.005 | 0.015 | 3.819 | 15.806 | 1.933 |
| 稻谷 Paddy | 30 | 0.001-0.014 | 0.003 | 0.004 | 0.005 | 1.335 | 1.809 | 0.600 |
| 蔬菜 Vegetable | 21 | 0.002-0.172 | 0.045 | 0.016 | 0.033 | 2.133 | 4.053 | 1.364 |
| 水果 Fruit | 14 | 0.002-0.062 | 0.016 | 0.005 | 0.010 | 3.038 | 9.525 | 1.600 |
| 作物品种 Crop varieties | 样品数 Number of samples | 富集系数 Bioconcentration factor | |||
|---|---|---|---|---|---|
| 范围 Range | 中值 Median | 平均值 Average value | 标准差 Standard deviation | ||
| 全部 Total | 65 | 0.004-0.880 | 0.063 | 0.130 | 0.187 |
| 稻谷 Paddy | 30 | 0.004-0.197 | 0.045 | 0.054 | 0.042 |
| 叶菜类蔬菜 Leafy vegetables | 15 | 0.052-0.880 | 0.140 | 0.291 | 0.283 |
| 根茎类蔬菜 Root vegetables | 2 | 0.013-0.207 | 0.110 | 0.110 | 0.137 |
| 瓜果类蔬菜 Melon and fruit vegetables | 3 | 0.036-0.467 | 0.095 | 0.199 | 0.234 |
| 豆类蔬菜 Legume vege | 1 | — | — | 0.123 | — |
| 番石榴 Guava | 2 | 0.011-0.044 | 0.027 | 0.027 | 0.023 |
| 红橙 Blood orange | 3 | 0.029-0.060 | 0.033 | 0.041 | 0.017 |
| 草莓 Strawberry | 2 | 0.060-0.087 | 0.073 | 0.073 | 0.019 |
| 菠萝 Pineapple | 2 | 0.193-0.653 | 0.423 | 0.423 | 0.325 |
| 香蕉 Banana | 3 | 0.031-0.129 | 0.068 | 0.076 | 0.050 |
| 芒果 Mango | 2 | 0.063-0.070 | 0.066 | 0.066 | 0.005 |
Table 7 Characteristics of mercury bioconcentration factors of different crops in Leizhou Peninsula
| 作物品种 Crop varieties | 样品数 Number of samples | 富集系数 Bioconcentration factor | |||
|---|---|---|---|---|---|
| 范围 Range | 中值 Median | 平均值 Average value | 标准差 Standard deviation | ||
| 全部 Total | 65 | 0.004-0.880 | 0.063 | 0.130 | 0.187 |
| 稻谷 Paddy | 30 | 0.004-0.197 | 0.045 | 0.054 | 0.042 |
| 叶菜类蔬菜 Leafy vegetables | 15 | 0.052-0.880 | 0.140 | 0.291 | 0.283 |
| 根茎类蔬菜 Root vegetables | 2 | 0.013-0.207 | 0.110 | 0.110 | 0.137 |
| 瓜果类蔬菜 Melon and fruit vegetables | 3 | 0.036-0.467 | 0.095 | 0.199 | 0.234 |
| 豆类蔬菜 Legume vege | 1 | — | — | 0.123 | — |
| 番石榴 Guava | 2 | 0.011-0.044 | 0.027 | 0.027 | 0.023 |
| 红橙 Blood orange | 3 | 0.029-0.060 | 0.033 | 0.041 | 0.017 |
| 草莓 Strawberry | 2 | 0.060-0.087 | 0.073 | 0.073 | 0.019 |
| 菠萝 Pineapple | 2 | 0.193-0.653 | 0.423 | 0.423 | 0.325 |
| 香蕉 Banana | 3 | 0.031-0.129 | 0.068 | 0.076 | 0.050 |
| 芒果 Mango | 2 | 0.063-0.070 | 0.066 | 0.066 | 0.005 |
| 土壤类型 Soil type | 统计指标Index | HQing | HQinh | HQder | HI | ||||||||
|---|---|---|---|---|---|---|---|---|---|---|---|---|---|
| 儿童 Children | 成人 Adult | 儿童 Children | 成人 Adult | 儿童 Children | 成人 Adult | 儿童 Children | 成人 Adult | ||||||
| 水稻田土壤 Paddy soil | 最小值 | 1.53×10⁻³ | 2.14×10⁻⁴ | 1.47×10⁻¹³ | 7.98×10⁻¹⁴ | 6.11×10⁻⁵ | 3.05×10⁻⁶ | 1.59×10⁻³ | 2.17×10⁻⁴ | ||||
| 最大值 | 3.81×10⁻² | 5.33×10⁻³ | 3.68×10⁻¹² | 1.99×10⁻¹² | 1.52×10⁻³ | 7.59×10⁻⁶ | 3.96×10⁻² | 5.41×10⁻³ | |||||
| 平均值 | 5.62×10⁻³ | 7.86×10⁻⁴ | 5.42×10⁻¹³ | 2.93×10⁻¹³ | 2.25×10⁻⁴ | 1.12×10⁻⁵ | 5.84×10⁻³ | 7.97×10⁻⁴ | |||||
| 标准差 | 6.32×10⁻³ | 8.85×10⁻⁴ | 6.10×10⁻¹³ | 3.30×10⁻¹³ | 2.53×10⁻⁴ | 1.26×10⁻⁵ | 6.58×10⁻³ | 8.98×10⁻⁴ | |||||
| 蔬菜地土壤 Vegetable soil | 最小值 | 1.21×10⁻³ | 1.69×10⁻⁴ | 1.16×10⁻¹³ | 6.30×10⁻¹⁴ | 4.82×10⁻⁵ | 2.41×10⁻⁶ | 1.25×10⁻³ | 1.71×10⁻⁴ | ||||
| 最大值 | 2.10×10⁻² | 2.94×10⁻³ | 2.03×10⁻¹² | 1.10×10⁻¹² | 8.41×10⁻⁴ | 4.19×10⁻⁵ | 2.19×10⁻² | 2.99×10⁻³ | |||||
| 平均值 | 6.46×10⁻³ | 9.04×10⁻⁴ | 6.13×10⁻¹³ | 3.37×10⁻¹³ | 2.58×10⁻⁴ | 1.29×10⁻⁵ | 6.72×10⁻³ | 9.17×10⁻⁴ | |||||
| 标准差 | 5.28×10⁻³ | 7.39×10⁻⁴ | 5.10×10⁻¹³ | 2.76×10⁻¹³ | 2.11×10⁻⁴ | 1.05×10⁻⁵ | 5.49×10⁻³ | 7.5×10⁻⁴ | |||||
| 果园地土壤 Orchard soil | 最小值 | 8.85×10⁻⁴ | 1.24×10⁻⁴ | 8.54×10⁻¹⁴ | 4.62×10⁻¹⁴ | 3.54×10⁻⁵ | 1.76×10⁻⁶ | 9.20×10⁻⁴ | 1.26×10⁻⁴ | ||||
| 最大值 | 9.25×10⁻³ | 1.29×10⁻³ | 8.93×10⁻¹³ | 4.83×10⁻¹³ | 3.7×10⁻⁴ | 1.84×10⁻⁵ | 9.62×10⁻³ | 1.31×10⁻³ | |||||
| 平均值 | 3.33×10⁻³ | 4.66×10⁻⁴ | 3.21×10⁻¹³ | 1.74×10⁻¹³ | 1.33×10⁻⁴ | 6.64×10⁻⁶ | 3.46×10⁻³ | 4.72×10⁻⁴ | |||||
| 标准差 | 1.73×10⁻³ | 2.43×10⁻⁴ | 1.67×10⁻¹³ | 9.06×10⁻¹⁴ | 6.94×10⁻⁵ | 3.46×10⁻⁶ | 1.80×10⁻³ | 2.46×10⁻⁴ | |||||
Table 8 Hazard quotient of daily exposure under different exposure routes in Leizhou Peninsula
| 土壤类型 Soil type | 统计指标Index | HQing | HQinh | HQder | HI | ||||||||
|---|---|---|---|---|---|---|---|---|---|---|---|---|---|
| 儿童 Children | 成人 Adult | 儿童 Children | 成人 Adult | 儿童 Children | 成人 Adult | 儿童 Children | 成人 Adult | ||||||
| 水稻田土壤 Paddy soil | 最小值 | 1.53×10⁻³ | 2.14×10⁻⁴ | 1.47×10⁻¹³ | 7.98×10⁻¹⁴ | 6.11×10⁻⁵ | 3.05×10⁻⁶ | 1.59×10⁻³ | 2.17×10⁻⁴ | ||||
| 最大值 | 3.81×10⁻² | 5.33×10⁻³ | 3.68×10⁻¹² | 1.99×10⁻¹² | 1.52×10⁻³ | 7.59×10⁻⁶ | 3.96×10⁻² | 5.41×10⁻³ | |||||
| 平均值 | 5.62×10⁻³ | 7.86×10⁻⁴ | 5.42×10⁻¹³ | 2.93×10⁻¹³ | 2.25×10⁻⁴ | 1.12×10⁻⁵ | 5.84×10⁻³ | 7.97×10⁻⁴ | |||||
| 标准差 | 6.32×10⁻³ | 8.85×10⁻⁴ | 6.10×10⁻¹³ | 3.30×10⁻¹³ | 2.53×10⁻⁴ | 1.26×10⁻⁵ | 6.58×10⁻³ | 8.98×10⁻⁴ | |||||
| 蔬菜地土壤 Vegetable soil | 最小值 | 1.21×10⁻³ | 1.69×10⁻⁴ | 1.16×10⁻¹³ | 6.30×10⁻¹⁴ | 4.82×10⁻⁵ | 2.41×10⁻⁶ | 1.25×10⁻³ | 1.71×10⁻⁴ | ||||
| 最大值 | 2.10×10⁻² | 2.94×10⁻³ | 2.03×10⁻¹² | 1.10×10⁻¹² | 8.41×10⁻⁴ | 4.19×10⁻⁵ | 2.19×10⁻² | 2.99×10⁻³ | |||||
| 平均值 | 6.46×10⁻³ | 9.04×10⁻⁴ | 6.13×10⁻¹³ | 3.37×10⁻¹³ | 2.58×10⁻⁴ | 1.29×10⁻⁵ | 6.72×10⁻³ | 9.17×10⁻⁴ | |||||
| 标准差 | 5.28×10⁻³ | 7.39×10⁻⁴ | 5.10×10⁻¹³ | 2.76×10⁻¹³ | 2.11×10⁻⁴ | 1.05×10⁻⁵ | 5.49×10⁻³ | 7.5×10⁻⁴ | |||||
| 果园地土壤 Orchard soil | 最小值 | 8.85×10⁻⁴ | 1.24×10⁻⁴ | 8.54×10⁻¹⁴ | 4.62×10⁻¹⁴ | 3.54×10⁻⁵ | 1.76×10⁻⁶ | 9.20×10⁻⁴ | 1.26×10⁻⁴ | ||||
| 最大值 | 9.25×10⁻³ | 1.29×10⁻³ | 8.93×10⁻¹³ | 4.83×10⁻¹³ | 3.7×10⁻⁴ | 1.84×10⁻⁵ | 9.62×10⁻³ | 1.31×10⁻³ | |||||
| 平均值 | 3.33×10⁻³ | 4.66×10⁻⁴ | 3.21×10⁻¹³ | 1.74×10⁻¹³ | 1.33×10⁻⁴ | 6.64×10⁻⁶ | 3.46×10⁻³ | 4.72×10⁻⁴ | |||||
| 标准差 | 1.73×10⁻³ | 2.43×10⁻⁴ | 1.67×10⁻¹³ | 9.06×10⁻¹⁴ | 6.94×10⁻⁵ | 3.46×10⁻⁶ | 1.80×10⁻³ | 2.46×10⁻⁴ | |||||
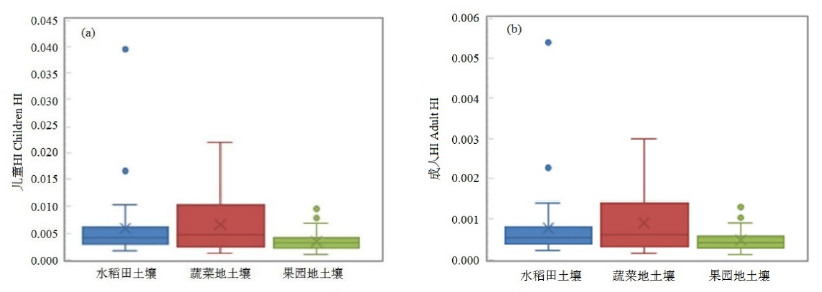
Figure 4 HI value of non carcinogenic risk of mercury in different types of agricultural soils
| 日摄入量 Daily intake | 单位 Unit | 2—5岁 2-5 aged | 6—17岁 6-17 aged | 18—44岁 18-44 aged | 45—49岁 45-49 aged | ≥60岁 ≥60 aged | |||||||||
|---|---|---|---|---|---|---|---|---|---|---|---|---|---|---|---|
| 男 | 女 | 男 | 女 | 男 | 女 | 男 | 女 | 男 | 女 | ||||||
| DIrice | μg∙d-1 | 0.44 | 0.55 | 1.21 | 0.97 | 1.31 | 0.99 | 1.10 | 0.99 | 1.14 | 1.04 | ||||
| DIveg | μg∙d-1 | 5.38 | 3.63 | 4.36 | 5.81 | 7.39 | 7.72 | 8.09 | 7.89 | 13.73 | 10.53 | ||||
| DIfruit | μg∙d-1 | 0.94 | 0.76 | 1.27 | 1.09 | 0.94 | 1.14 | 0.84 | 1.31 | 1.18 | 1.30 | ||||
| 合计Total | μg∙d-1 | 6.76 | 4.94 | 6.84 | 7.87 | 9.64 | 9.85 | 10.03 | 10.19 | 16.05 | 12.87 | ||||
Table 9 Daily intake of mercury in edible parts of crops in different populations
| 日摄入量 Daily intake | 单位 Unit | 2—5岁 2-5 aged | 6—17岁 6-17 aged | 18—44岁 18-44 aged | 45—49岁 45-49 aged | ≥60岁 ≥60 aged | |||||||||
|---|---|---|---|---|---|---|---|---|---|---|---|---|---|---|---|
| 男 | 女 | 男 | 女 | 男 | 女 | 男 | 女 | 男 | 女 | ||||||
| DIrice | μg∙d-1 | 0.44 | 0.55 | 1.21 | 0.97 | 1.31 | 0.99 | 1.10 | 0.99 | 1.14 | 1.04 | ||||
| DIveg | μg∙d-1 | 5.38 | 3.63 | 4.36 | 5.81 | 7.39 | 7.72 | 8.09 | 7.89 | 13.73 | 10.53 | ||||
| DIfruit | μg∙d-1 | 0.94 | 0.76 | 1.27 | 1.09 | 0.94 | 1.14 | 0.84 | 1.31 | 1.18 | 1.30 | ||||
| 合计Total | μg∙d-1 | 6.76 | 4.94 | 6.84 | 7.87 | 9.64 | 9.85 | 10.03 | 10.19 | 16.05 | 12.87 | ||||
| [1] |
AO M, MENG B, SAPKOTA A, et al., 2017. The influence of atmospheric Hg on Hg contaminations in rice and paddy soil in the Xunyang Hg mining district, China[J]. Acta Geochimica, 36(2): 181-189.
DOI URL |
| [2] |
BIESTER H, MÜLLER G, SCHÖLER H F, 2002a. Binding and mobility of mercury in soils contaminated by emissions from chlor-alkali plants[J]. Science of the Total Environment, 284(1): 191-203.
DOI URL |
| [3] |
BIESTER H, MÜLLER G, SCHÖLER H F, 2002b. Estimating distribution and retention of mercury in three different soils contaminated by emissions from chlor-alkali plants: Part I[J]. Science of the Total Environment, 284(1): 177-189.
DOI URL |
| [4] |
DONALD G B, MICHAEL D, PETER P, et al., 1988. Reference dose (RfD): Description and use in health risk assessments[J]. Regulatory Toxicology and Pharmacology, 8(4): 471-486.
DOI URL |
| [5] |
HAKANSON L, 1980. An ecological risk index for aquatic pollution control a sedimentological approach[J]. Water Research, 14(8): 975-1001.
DOI URL |
| [6] | JERZY F, MAŁGORZATA D, 2015. Distribution of mercury in Amanita fulva (Schaeff.) Secr. mushrooms: Accumulation, loss in cooking and dietary intake[J]. Ecotoxicology and Environmental Safety, 115C: 49-54. |
| [7] |
JESSIE S, CRIS R G, ALEXANDRIA T, et al., 2020. Total mercury in soils and sediments in the vicinity of abandoned mercury mine area in Puerto Princesa City, Philippines[J]. Applied Sciences, 10(13): 4599.
DOI URL |
| [8] |
LI Y, WANG Y B, GOU X, et al., 2006. Risk assessment of heavy metals in soils and vegetables around non-ferrous metals mining and smelting sites, Baiyin, China[J]. Journal of Environmental Sciences, 18(6): 1124-1134.
DOI URL |
| [9] |
OBRIST D, AGNAN Y, JISKRA M, et al., 2017. Tundra uptake of atmospheric elemental mercury drives Arctic mercury pollution[J]. Nature, 547(7662): 201-204.
DOI URL |
| [10] |
TAKASHI T, CHRISTINE B, YURIKO K H, et al., 2020. Distribution of total and organic mercury in soils around an artisanal and small-scale gold mining area in West Java, Indonesia[J]. SN Applied Sciences, DOI: 10.1007/s42452-020-3008-5.
DOI |
| [11] | US EPA S, 1996. Soil screening guidance: Technical background document[M]. Beijing: China Standard Press. |
| [12] |
XIAO Q, ZONG Y T, LU S G, 2015. Assessment of heavy metal pollution and human health risk in urban soils of steel industrial city (Anshan), Liaoning, Northeast China[J]. Ecotoxicology and Environmental Safety, 120: 377-385.
DOI URL |
| [13] | ZHANG Q, SHENGLI W, ZHONGREN N, et al., 2018. Accumulation, fractionation, and risk assessment of mercury and arsenic in the soil-wheat system from the wastewater-irrigated soil in Baiyin, northwest China[J]. Environmental Science & Pollution Research International, 25(1): 14856-14867. |
| [14] | 柴磊, 王新, 马良, 等, 2020. 基于PMF模型的兰州耕地土壤重金属来源解析[J]. 中国环境科学, 40(9): 3919-3929. |
| CHAI L, WANG X, MA L, et al., 2020. Source analysis of heavy metals in cultivated soil of Lanzhou Based on PMF model[J]. China Environmental Science, 40(9): 3919-3929. | |
| [15] | 陈晨, 陈小华, 沈根祥, 等, 2021. 水稻对5种重金属累积特征及食用安全研究[J]. 生态毒理学报, 16(5): 347-357. |
| CHEN C, CHEN X H, SHEN G X, et al., 2021 Study on the accumulation characteristics of five heavy metals in rice and its edible safety[J]. Journal of Ecotoxicology, 16(5): 347-357. | |
| [16] | 代杰瑞, 庞绪贵, 宋建华, 等, 2018. 山东淄博城市和近郊土壤元素地球化学特征及生态风险研究[J]. 中国地质, 45(3): 617-627. |
| DAI J R, PANG X G, SONG J H, et al., 2018. Study on geochemical characteristics and ecological risk of soil elements in urban and suburban Zibo, Shandong[J]. Geology of China, 45(3): 617-627. | |
| [17] | 窦韦强, 安毅, 秦莉, 等, 2019. 土壤pH对汞迁移转化的影响研究进展[J]. 农业资源与环境学报, 36(1): 1-8. |
| DOU W Q, AN Y, QIN L, et al., 2019. Research progress on effects of soil pH on migration and transformation of mercury[J]. Journal of agricultural resources and environment, 36(1): 1-8. | |
| [18] | 段雯娟, 2014. 中国人群暴露参数[J]. 地球 (6): 80-83. |
| DUAN W J, 2014. Exposure factors of Chinese population[J]. Earth (6): 80-83. | |
| [19] | 段友春, 梁兴光, 臧浩, 等, 2020. 日照市典型农用地土壤重金属来源分析及环境质量评价[J]. 环境污染与防治, 42(11): 1410-1414, 1429. |
| DUAN Y C, LIANG X G, ZANG H, et al., 2020. Source analysis and environmental quality assessment of heavy metals in farmland soil in a typical area of Rizhao city[J]. Environmental Pollution & Control, 42(11): 1410-1414, 1429. | |
| [20] | 符靖茹, 沈碧辉, 于洲, 等, 2020. 雷州半岛热带气旋降水的时空分布及变化特征[J]. 热带农业科学, 40(6): 71-76. |
| FU J R, SHEN B H, YU Z, et al., 2020. Spatial and temporal distribution and variation characteristics of tropical cyclone precipitation in Leizhou Peninsula[J]. Chinese Journal of Tropical Agriculture, 40(6): 71-76. | |
| [21] | 荆延德, 赵石萍, 何振立, 2010. 土壤中汞的吸附-解吸行为研究进展[J]. 土壤通报, 41(5): 1270-1274. |
| JING Y D, ZHAO S P, HE Z L, 2010. Research progress on adsorption desorption behavior of mercury in soil[J]. Chinese Journal of Soil Science, 41(5): 1270-1274. | |
| [22] | 李如忠, 潘成荣, 徐晶晶, 等, 2013. 典型有色金属矿业城市零星菜地蔬菜重金属污染及健康风险评估[J]. 环境科学, 34(3): 1076-1085. |
| LI R Z, PAN C R, XU J J, et al., 2013. Contamination and healty risk for heavy metals via consumtion of vegetables grown in fragmentary vegetable plots from a typical nonferrous metals mine city[J]. Environmental Science, 34(3): 1076-1085. | |
| [23] | 李永华, 王五一, 杨林生, 等, 2004. 汞的环境生物地球化学研究进展[J]. 地理科学进展, 23(6): 33-40. |
| LI Y H, WANG W Y, YANG L S, et al., 2004. Advances in environmental biogeochemistry of mercury[J]. Advances in Geographical Sciences, 23(6): 33-40. | |
| [24] | 李宇庆, 陈玲, 仇雁翎, 等, 2004. 上海化学工业区土壤重金属元素形态分析[J]. 生态环境, 13(2): 154-155. |
| LI Y Q, CHEN L, QIU Y L, et al., 2004. Speciation of heavy metals in soil from Shanghai chemical industry park[J]. Ecology and Environment, 13(2): 154-155. | |
| [25] | 刘品祯, 2018. 都匀废弃铅锌矿区土壤-作物重金属污染调查及健康风险分析[D]. 贵州: 贵州师范大学: 4-16. |
| LIU P Z, 2018. Characteristics and human health risk assessment of heavy metals in agriculturalsoil-crops in abandoned lead-zinc mining area in Duyun City[D]. Guizhou: Guizhou Normal University: 4-16. | |
| [26] | 罗启清, 王少鹏, 王英辉, 等, 2018. 南宁市市郊农业土壤中重金属元素含量的多元统计分析[J]. 安全与环境工程, 25(2): 81-87, 106. |
| LUO Q Q, WANG S P, WANG Y H, et al., 2018. Multivariate statistical analysis of heavy metal concentration in suburb agricultural soils of Nanning City[J]. Safety and Environmental Engineering, 25(2): 81-87, 106. | |
| [27] | 聂超甲, 刘慧琳, 杨雪玲, 等, 2019. 土壤汞含量分布特征与影响因素研究[J]. 安徽工程大学学报, 34(1): 1-7, 20. |
| NIE C J, LIU H L, YANG X L, et al., 2019. Distribution characteristics and affecting factors of Hg content in soil[J]. Journal of Anhui Polytechnic University, 34(1): 1-7, 20. | |
| [28] | 史明易, 王祖伟, 王嘉宝, 等, 2020. 基于富集系数对蔬菜地土壤重金属的安全阈值研究[J]. 干旱区资源与环境, 34(2): 130-134. |
| SHI M Y, WANG Z W, WANG J B, et al., 2020. Study on safety threshold of heavy metals in vegetable soil based on enrichment coefficient[J]. Resources and Environment in Arid Areas, 34(2): 130-134. | |
| [29] | 宋绵, 龚磊, 王艳, 等, 2022. 河北阜平县表层土壤重金属对人体健康的风险评估[J]. 岩矿测试, 41(1): 133-144. |
| SONG M, GONG L, WANG Y, et al., 2022. Risk assessment of heavymetals in topsoil on human health in Fuping County, Hebei Province[J]. Rock Test, 41(1): 133-144. | |
| [30] | 孙诚志, 2010. 湛江农业种植业结构优化探讨[J]. 广东农业科学, 37(8): 329-331. |
| SUN C Z, 2010. Discussion on the optimization of agricultural planting structure in Zhanjiang[J]. Guangdong Agricultural Sciences, 37(8): 329-331. | |
| [31] | 唐洪磊, 郭英, 孟祥周, 等, 2009. 广东省沿海城市居民膳食结构及食物污染状况的调研--对持久性卤代烃和重金属的人体暴露水平评价[J]. 农业环境科学学报, 28(2): 329-336. |
| TANG H L, GUO Y, MENG X Z, et al., 2009. A preliminary survey on the nutritional structures for coastal residentsof Guangdong province, China and food pollution: Assessment of human exposure to persistent halogenated hydrocarbons and heavy metals[J]. Journal of Agro-Environment Science, 28(2): 329-336. | |
| [32] | 王娟恒, 胡国成, 温汉辉, 等, 2021. 揭西不同土地利用类型土壤重金属污染特征及风险评价[J]. 环境监控与预警, 13(5): 100-108. |
| WANG J H, HU G C, WEN H H, et al., 2021. Pollution characteristics and risk assessment of heavy metals in soils of different land use types in Jiexi[J]. Environmental Monitoring and Early Warning, 13(5): 100-108. | |
| [33] | 王小莉, 陈志凡, 魏张东, 等, 2018. 开封市城乡交错区农田土壤重金属污染及潜在生态风险评价[J]. 环境化学, 37(3): 513-522. |
| WANG X L, CHEN Z F, WEI Z D, et al., 2018. Heavy metal pollution and potential ecological risk assessment inagricultural soils located in the peri-urban area of Kaifeng City[J]. Environmental Chemistry, 37(3): 513-522. | |
| [34] | 王英英, 钱蜀, 邓星亮, 2012. 成都平原西部农业土壤中金属元素分布特征研究[J]. 三峡环境与生态, 34(5): 11-14, 18. |
| WANG Y Y, QIAN S, DENG X L, 2012. Investigation into heavy metals distribution in the farmland soils in the western of Chengdu Plain[J]. Environment and Ecology in the Three Gorges, 34(5): 11-14, 18. | |
| [35] | 王中阳, 2018. 朝阳地区耕地土壤重金属污染风险评价与来源解析研究[D]. 沈阳: 沈阳农业大学: 6-25. |
| WANG Z Y, 2018. Risk assessment and source apportionment of heavy metal pollution in cultivated soil in Chaoyang Area[D]. Shenyang: Shenyang Agricultural University: 6-25. | |
| [36] | 许炼烽, 刘腾辉, 1996. 广东土壤环境背景值和临界含量的地带性分异[J]. 华南农业大学学报, 17(4): 61-65. |
| XU L F, LIU T H, 1996. The zonal differentiation of soil environmental background values and critical contents in Guangdong[J]. Journal of South China Agricultural University, 17(4): 61-65. | |
| [37] | 杨剑洲, 王振亮, 高健翁, 等, 2021. 海南省集约化种植园中谷物、蔬菜和水果中重金属累积程度及健康风险[J]. 环境科学, 42(10): 4916-4924. |
| YANG J Z, WANG Z L, GAO J W, et al., 2021 Accumulation degree and health risk of heavy metals in grains, vegetables and fruits in intensive plantations in Hainan Province[J]. Environmental Science, 42(10): 4916-4924. | |
| [38] | 喻子恒, 黄国培, 张华, 等, 2017. 贵州丹寨金汞矿区稻田土壤重金属分布特征及其污染评估[J]. 生态学杂志, 36(8): 2296-2301. |
| YU Z H, HUANG G P, ZHANG H, et al., 2017. Distribution and pollution assessment of heavy metals in paddy soil in Danzhai Au-Hg mining area, Guizhou, China[J]. Chinese Journal of Ecology, 36(8): 2296-2301. | |
| [39] | 袁知洋, 谭文专, 项剑桥, 等, 2019. 江汉平原不同土地利用方式下土壤汞元素的含量特征--以沙洋镇为例[J]. 资源环境与工程, 33(Z1): 32-35. |
| YUAN Z Y, TAN W Z, XIANG J Q, et al., 2019. Content characteristics of mercury elements in soil under different land use patterns in Jianghan Plain[J]. Resources Environment & Engineering, 33(Z1): 32-35. | |
| [40] | 张爱国, 魏兴萍, 2020. 西南典型岩溶槽谷土壤重金属污染与来源解析[J]. 环境科学与技术, 43(12): 166-176. |
| ZHANG A G, WEI X P, 2020. Heavy metal pollution and source analysis of typical karst valley soil in Southwest China[J]. Environmental Science and Technology, 43(12): 166-176. | |
| [41] | 张倩, 2018. 白银农田土壤和作物中汞和砷的污染特征及风险评价[D]. 兰州: 兰州大学. |
| ZHANG Q, 2018. Pollution characteristics and risk assessment of mercury and arsenic in the farmland soil and crop from Baiyin[D]. Lanzhou: Lanzhou University. | |
| [42] | 张燕萍, 颜崇淮, 沈晓明, 2004. 环境中汞污染来源、人体暴露途径及其检测方法[J]. 广东微量元素科学, 11(6): 11-15. |
| ZHANG Y P, YAN C H, SHEN X M, 2004. Sources, pathways of human exporure and the measuring methods of environmental mercury exposure[J]. Guangdong Trace Elements Science, 11(6): 11-15. | |
| [43] | 张泽锦, 唐丽, 李跃建, 等, 2016. 四川地区低镉富集蔬菜品种分析及安全性评估[J]. 西南农业学报, 29(10): 2483-2487. |
| ZHANG Z J, TANG L, LI Y J, et al., 2016. Analysis and safety evaluation of low cadmium enriched vegetable varieties in Sichuan[J]. Southwest Agricultural Journal, 29(10): 2483-2487. | |
| [44] | 张争胜, 2018. 广东地理[M]. 北京: 北京师范大学出版社: 130-132. |
| ZHANG Z S, 2018. Guangdong geography[M]. Beijing: Beijing Normal University Publishing House: 130-132. | |
| [45] | 赵秀阁, 段小丽, 2014. 中国人群暴露参数手册 (成人卷)[M]. 北京: 中国环境出版社. |
| ZHAO X G, DUAN X L, 2014. Highlights of the Chinese exposure factors handbook (adults)[M]. Beijing: China Environmental Press. | |
| [46] | 中华人民共和国环境保护部, 2014. 污染场地风险评估技术导则: HJ 25.3-2014[S]. 北京: 中国环境科学出版社. |
| Ministry of Environmental Protection of the People's Republic of China, 2014. Technical guidelines for risk assessment of contaminated sites (HJ 25.3-2014)[S]. Beijing: China Environmental Press. | |
| [47] | 中华人民共和国生态环境部, 2018. 土壤环境质量农用地土壤污染风险管控标准 (试行): GB 15618-2018[S]. 北京: 中国环境出版社. |
| Ministry of Ecology and Environmet of the People's Republic of Chin, 2018. Soil environmental quality standards for agricultural land soil pollution risk control (Trial): GB 15618-2018[S]. Beijing: China Environmental Publishing House. | |
| [48] | 中华人民共和国国家卫生和计划生育委员会, 国家食品药品监督管理总局, 2018. GB 2762-2017《食品安全国家标准食品中污染物限量》[J]. 中国食品卫生杂志, 30(3): 329-340. |
| State Food and Drug Administration, National Health and Family Planning Commission, 2018. PRC GB 2762-2017, “national food safety standard limits of pollutants in food”[J]. Chinese Journal of Food Hygiene, 30(3): 329-340. | |
| [49] | 钟嶷, 周金华, 毕华, 等, 2019. 广州市农村蔬菜地土壤汞水平及其生态、人体健康风险评价[J]. 中国公共卫生, 35(7): 904-906. |
| ZHONG Y, ZHOU J H, BI B, et al., 2019. Assessment on mercury pollution in vegetable soil in rural Guangzhou andits ecological and human health risk[J]. Chinese Journal of Public Health, 35(7): 904-906. |
| [1] | HUANG Yingmei, ZHONG Songxiong, ZHU Yiwen, WANG Xiangqin, LI Fangbai. Effects and Mechanism of Element Sulfur Inhibiting Methylmercury Accumulation in Rice Plants [J]. Ecology and Environment, 2023, 32(6): 1115-1122. |
| [2] | YANG Yaodong, CHEN Yumei, TU Pengfei, ZENG Qingru. Phytoremediation Potential of Economic Crop Rotation Patterns for Cadmium-polluted Farmland [J]. Ecology and Environment, 2023, 32(3): 627-634. |
| [3] | TONG Yindong, HUANG Lanlan, YANG Ning, ZHANG Yiyan, LI Zipeng, SHAO Bo. Distribution Characteristics and Potential Environmental Risk Analysis of Microcystins in Global Water Bodies [J]. Ecology and Environment, 2023, 32(1): 129-138. |
| [4] | WANG Zhao, ZHANG Manyin, HU Yukun, LIU Weiwei, ZHANG Miaomiao. Effect of Salinity on Mercury Methylation in Sediments of A Typical Coastal Wetland [J]. Ecology and Environment, 2022, 31(9): 1876-1884. |
| [5] | LI Xiuhua, ZHAO Ling, TENG Ying, LUO Yongming, HUANG Biao, LIU Chong, LIU Benle, ZHAO Qiguo. Characteristics, Spatial Distribution and Risk Assessment of Combined Mercury and Cadmium Pollution in Farmland Soils Surrounding Mercury Mining Areas in Guizhou [J]. Ecology and Environment, 2022, 31(8): 1629-1636. |
| [6] | GONG Lingxuan, WANG Lili, ZHAO Jianning, LIU Hongmei, YANG Dianlin, ZHANG Guilong. Effects of Different Cover Crop Patterns on Soil Physicochemical Properties and Organic Carbon Mineralization in Tea Gardens [J]. Ecology and Environment, 2022, 31(6): 1141-1150. |
| [7] | CHEN Fuqiuxue, TANG Siqi, YUAN Hao, MA Zixuan, CHEN Tan, YANG Ting, ZHANG Bing, LIU Ying. Impacts of Polystyrene Microplastics on Seed Germination and Seedling Growth of Typical Crops [J]. Ecology and Environment, 2022, 31(12): 2382-2392. |
| [8] | LEI Yajie, LI Xue, CHANG Chunyan, MAO Xuefei. Adsorption of Mercury Ions in Water by Polystyrene Microplastics [J]. Ecology and Environment, 2022, 31(10): 2048-2057. |
| [9] | WANG Biling, CHEN Bishan, LIU Fayao, SU Weiwei, KE Liucong, HUANG Xinxin. Potential Risk Assessment and Enrichment Characteristics of Heavy Metals in Soil Fruit Crop System of Leizhou Peninsula [J]. Ecology and Environment, 2021, 30(5): 1076-1083. |
| [10] | WANG Jing, FANG Feng, WANG Ying. Temporal Variation Characteristics and Influencing Factors of Sown Area Variation of Grain Crops in Southwest and South China [J]. Ecology and Environment, 2021, 30(10): 2010-2025. |
| Viewed | ||||||
|
Full text |
|
|||||
|
Abstract |
|
|||||
Copyright © 2021 Editorial Office of ACTA PETROLEI SINICA
Address:No. 6 Liupukang Street, Xicheng District, Beijing, P.R.China, 510650
Tel: 86-010-62067128, 86-010-62067137, 86-010-62067139
Fax: 86-10-62067130
Email: syxb@cnpc.com.cn
Support byBeijing Magtech Co.ltd, E-mail:support@magtech.com.cn