生态环境学报 ›› 2025, Vol. 34 ›› Issue (4): 499-510.DOI: 10.16258/j.cnki.1674-5906.2025.04.001
• 研究论文【生态学】 •
下一篇
陈鹏1( ), 马育军1,*(), 张梦雅1, 陈婉婷1, 江晓鹏2
收稿日期:2024-09-23
出版日期:2025-04-18
发布日期:2025-04-24
通讯作者:
*马育军。E-mail: mayujun3@mail.sysu.edu.cn作者简介:陈鹏(2000年生),女,硕士研究生,研究方向为森林碳循环。E-mail: chenp278@mail2.sysu.edu.cn
基金资助:
CHEN Peng1(), MA Yujun1,*(), ZHANG Mengya1, CHEN Wanting1, JIANG Xiaopeng2
Received:2024-09-23
Online:2025-04-18
Published:2025-04-24
摘要:
广东省经济发展迅速,植被资源丰富,研究其植被动态变化对于实现社会经济发展与生态环境保护之间的平衡具有重要意义。基于2000-2022年的核标准化植被指数(kNDVI),探讨了广东省植被的时空变化特征,通过SHAP方法探究了影响kNDVI变化的主导因子,并利用LSTM模型与Hurst指数预测了未来植被变化趋势。结果表明,1)广东省kNDVI整体呈现“中间低、四周高”的格局,粤北地区年平均kNDVI最高,反映了区域较高的植被覆盖率;珠三角地区年平均kNDVI最低,这可能是由于快速的城市化进程导致了自然植被减少。2)研究时段内,广东省仅0.04%的区域植被状况保持稳定;约84.6%的区域植被状况改善,这可能得益于一系列生态保护政策与城市化积极效应的共同作用;15.4%的区域出现植被退化,主要集中在珠三角及粤东地区,这与当地频繁的土地利用变化和城市扩张紧密相关。相较于自然因素(如气温和降水),人为因素(如GDP增长和人口增加)对广东省植被变化的影响更显著。3)未来,广东省植被呈现反持续性像元占比为66.6%,持续性像元占比为33.4%,表明大部分地区植被覆盖的变化趋势可能发生逆转。
中图分类号:
陈鹏, 马育军, 张梦雅, 陈婉婷, 江晓鹏. 基于kNDVI的广东省植被动态变化分析[J]. 生态环境学报, 2025, 34(4): 499-510.
CHEN Peng, MA Yujun, ZHANG Mengya, CHEN Wanting, JIANG Xiaopeng. Analysis of Vegetation Dynamic in Guangdong Province Based on kNDVI[J]. Ecology and Environmental Sciences, 2025, 34(4): 499-510.

图1 广东省区域概况 该图基于国家地理信息公共服务平台(天地图)(https://cloudcenter.tianditu.gov)网站下载的审图号GS(2024)0650号的标准地图制作,底图无修改(发布时间:2024年4月)
Figure 1 Overview of Guangdong Province
| 类别 | β | |Z| | 类型 |
|---|---|---|---|
| 1 | <0 | |Z|>2.58 | 极显著退化 |
| 2 | <0 | 1.96<|Z|≤2.58 | 显著退化 |
| 3 | <0 | |Z|≤1.96 | 不显著退化 |
| 4 | =0 | ‒ | 稳定 |
| 5 | >0 | |Z|≤1.96 | 不显著改善 |
| 6 | >0 | 1.96<|Z|≤2.58 | 显著改善 |
| 7 | >0 | |Z|>2.58 | 极显著改善 |
表1 研究区植被变化趋势分类
Table 1 Classification of vegetation change trend in the study area
| 类别 | β | |Z| | 类型 |
|---|---|---|---|
| 1 | <0 | |Z|>2.58 | 极显著退化 |
| 2 | <0 | 1.96<|Z|≤2.58 | 显著退化 |
| 3 | <0 | |Z|≤1.96 | 不显著退化 |
| 4 | =0 | ‒ | 稳定 |
| 5 | >0 | |Z|≤1.96 | 不显著改善 |
| 6 | >0 | 1.96<|Z|≤2.58 | 显著改善 |
| 7 | >0 | |Z|>2.58 | 极显著改善 |
| 类别 | β | Hurst指数 | 类型 |
|---|---|---|---|
| 1 | <0 | H<0.50 | 反持续退化 |
| 2 | <0 | H>0.50 | 持续退化 |
| 3 | / | H=0.50 | 不确定 |
| 4 | =0 | ‒ | 基本稳定 |
| 5 | >0 | H>0.50 | 持续改善 |
| 6 | >0 | H<0.50 | 反持续改善 |
表2 研究区植被未来变化趋势分类
Table 2 Classification of future vegetation change trends in the study area
| 类别 | β | Hurst指数 | 类型 |
|---|---|---|---|
| 1 | <0 | H<0.50 | 反持续退化 |
| 2 | <0 | H>0.50 | 持续退化 |
| 3 | / | H=0.50 | 不确定 |
| 4 | =0 | ‒ | 基本稳定 |
| 5 | >0 | H>0.50 | 持续改善 |
| 6 | >0 | H<0.50 | 反持续改善 |
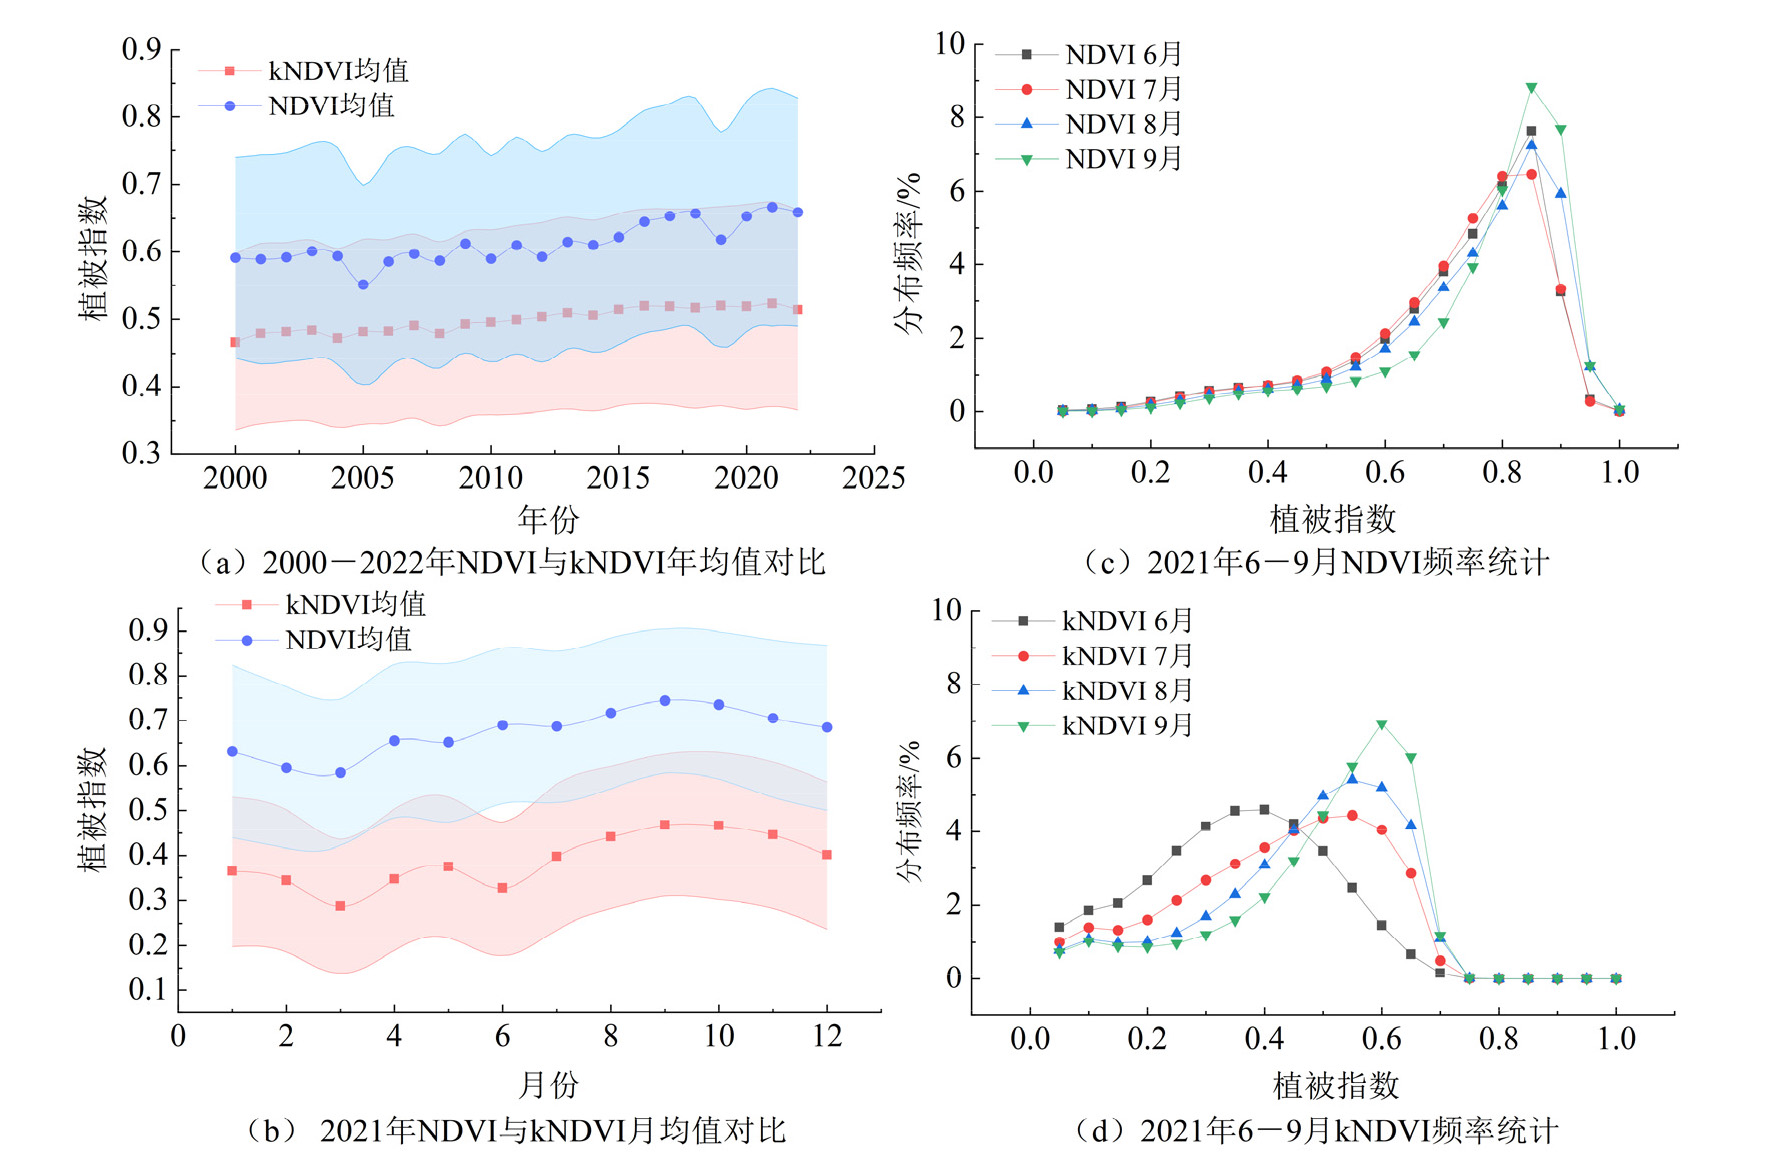
图2 广东省2000-2022年NDVI与kNDVI对比
Figure 2 Comparison of NDVI and kNDVI in Guangdong Province from 2000 to 2022
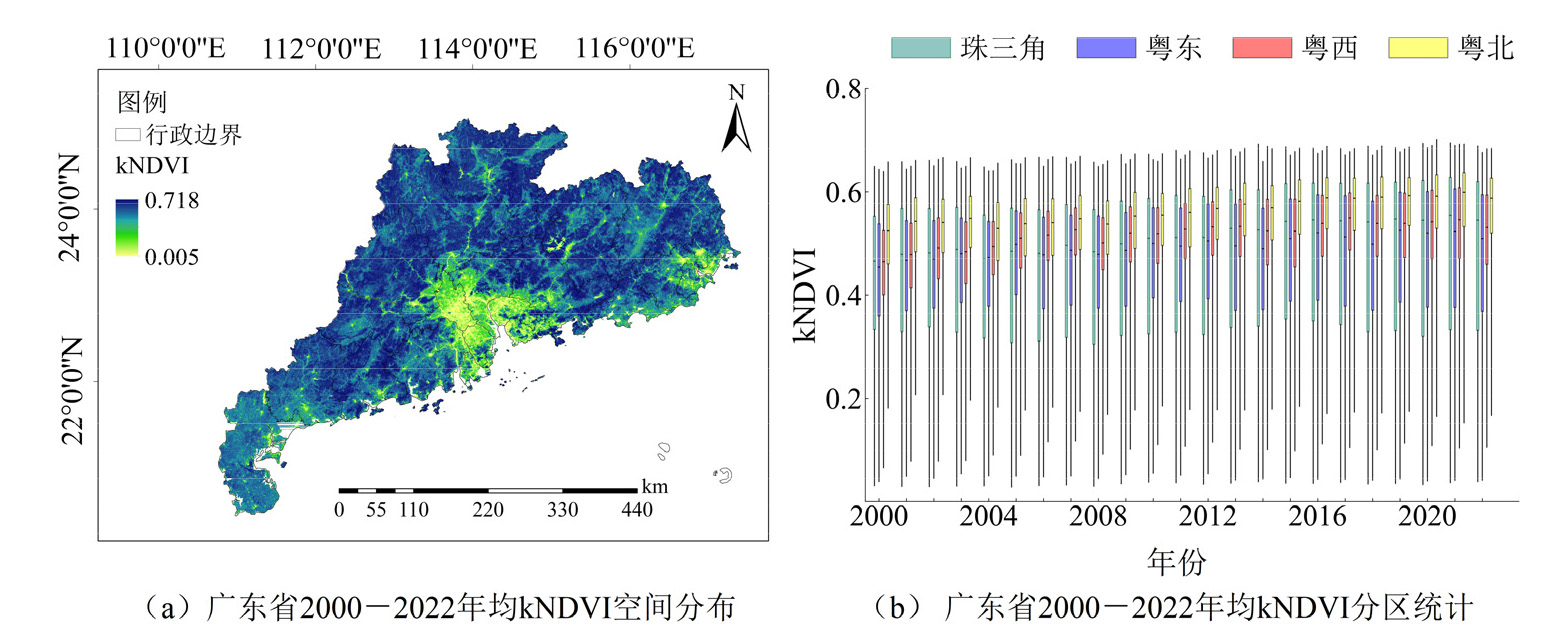
图3 广东省2000-2022年均kNDVI概况
Figure 3 Overview of the average kNDVI in Guangdong Province from 2000 to 2022
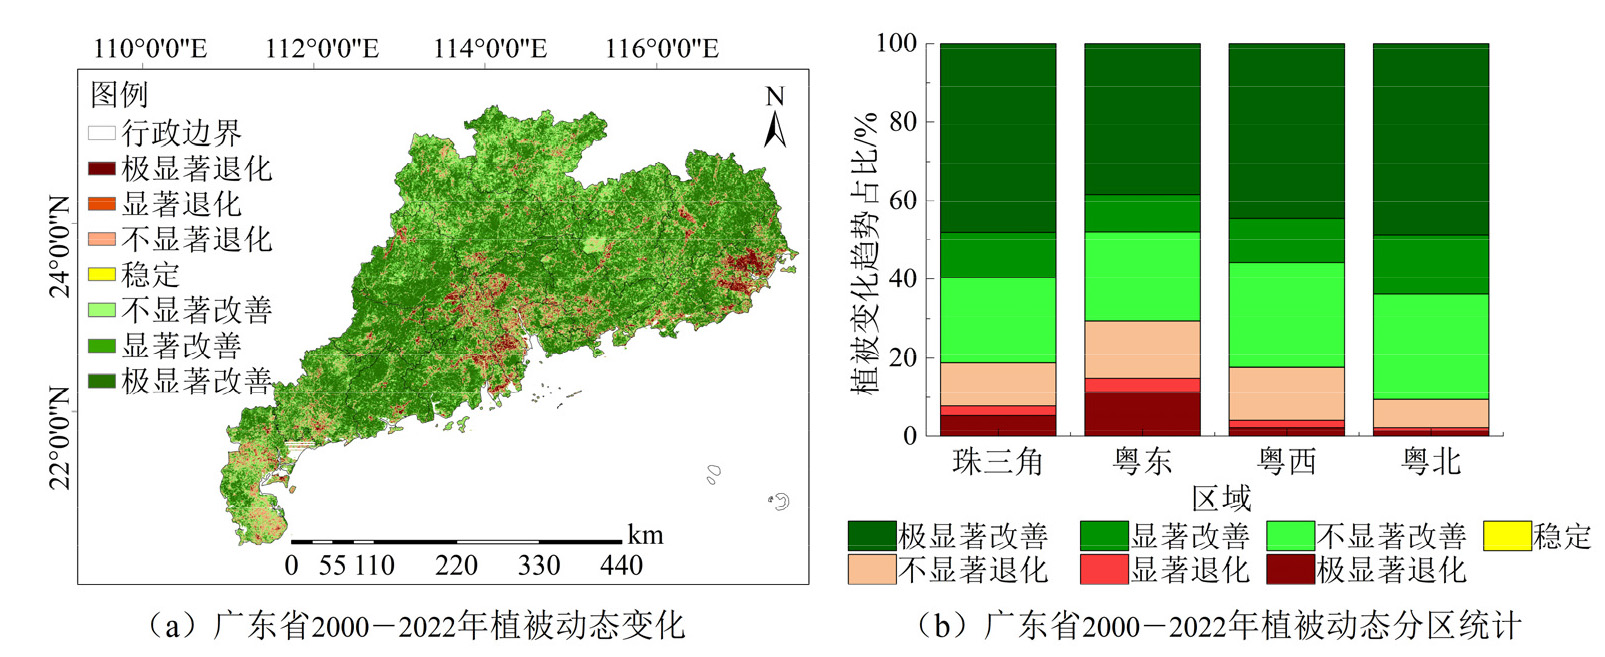
图4 广东省2000-2022年植被动态变化
Figure 4 Vegetation dynamics in Guangdong Province from 2000 to 2022
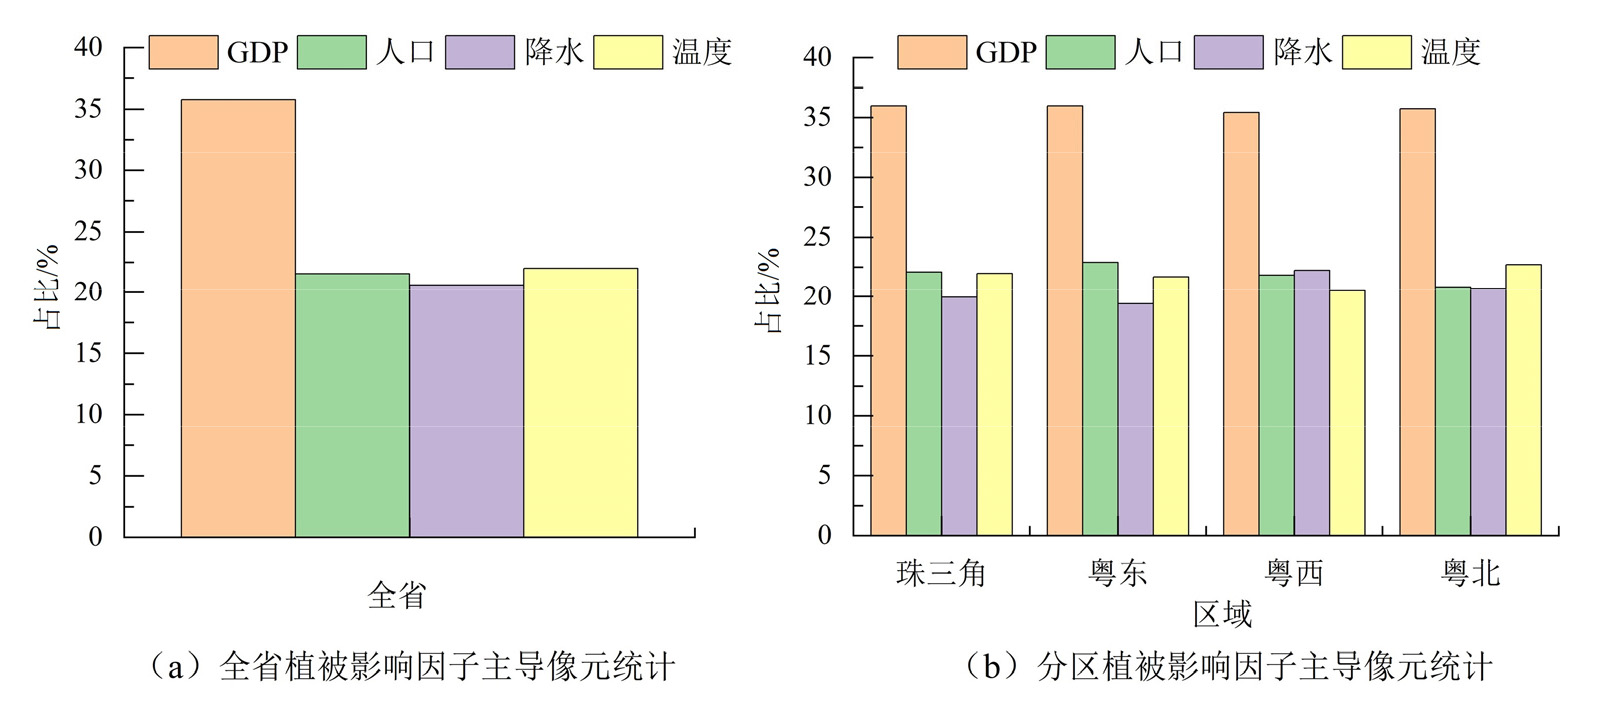
图5 广东省2000-2022年植被变化影响因子贡献度统计
Figure 5 Statistical analysis of the contribution of influencing factors to vegetation change in Guangdong Province from 2000 to 2022
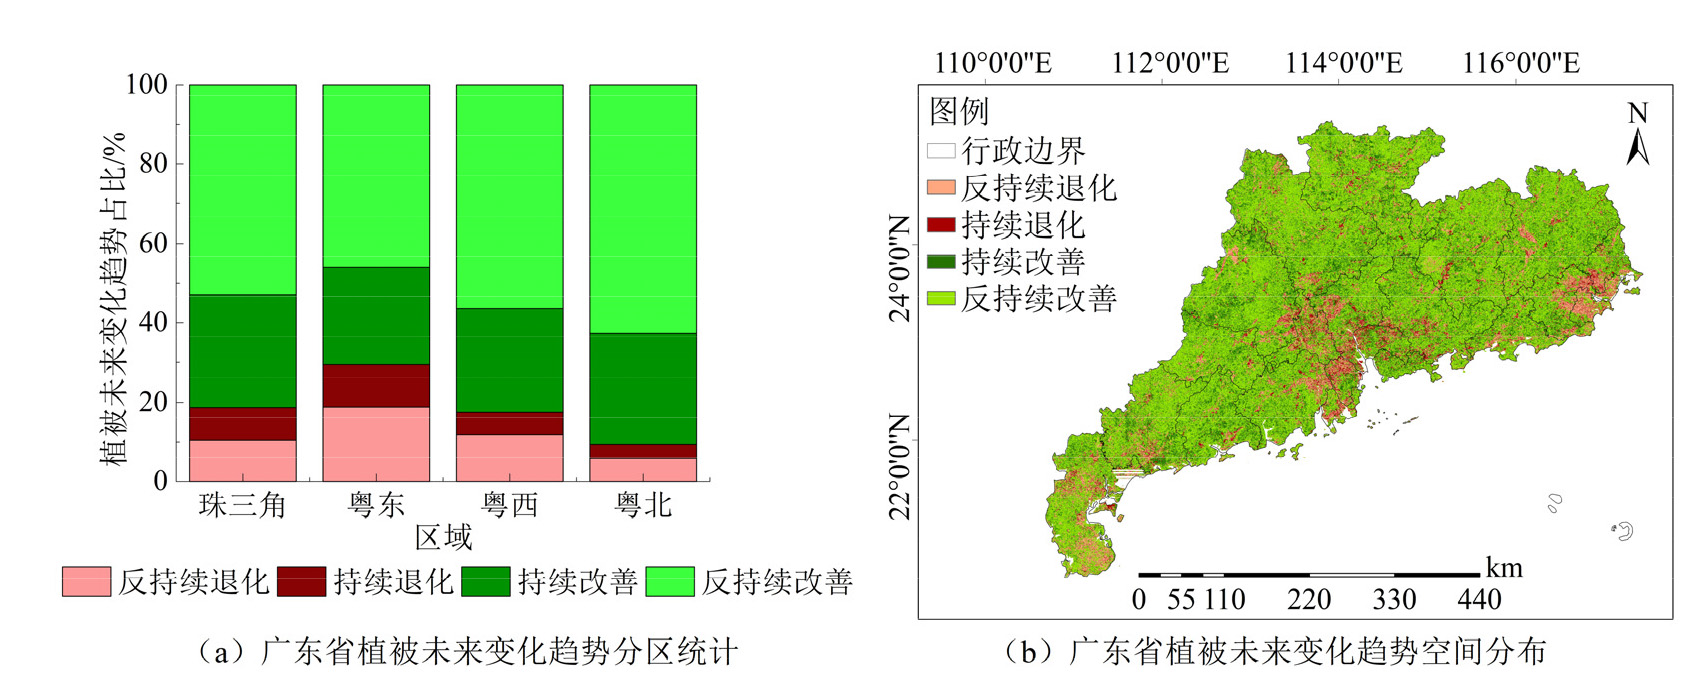
图6 Sen-Hurst预测广东省植被未来变化趋势
Figure 6 Sen-hurst predicts the future change trends of vegetation in Guangdong Province

图7 LSTM预测广东省植被未来50年变化趋势
Figure 7 LSTM predicts the change trends of vegetation in Guangdong Province over the next 50 years
| 2000 | 2022 | |||||||
|---|---|---|---|---|---|---|---|---|
| 农田 | 森林 | 灌木 | 草地 | 水域 | 裸地 | 不透水面 | 总计 | |
| 农田 | 2.94×10⁴ | 1.05×10⁴ | 0.625 | 28 | 1.08×10³ | 13.3 | 4.17×10³ | 4.52×10⁴ |
| 森林 | 1.28×10⁴ | 1.01×10⁵ | 34.4 | 29.8 | 566 | 2.5 | 765 | 1.15×10⁵ |
| 灌木 | 4.13 | 61.6 | 3.88 | 0.75 | 0 | 0 | 0.188 | 70.6 |
| 草地 | 91.2 | 52.9 | 0.375 | 4.19 | 13.1 | 1.38 | 55.4 | 219 |
| 水域 | 2.37×10³ | 717 | 0 | 4.81 | 2.32×10³ | 3.63 | 679 | 6.09×10³ |
| 裸地 | 8.94 | 1.19 | 0 | 1.38 | 5.38 | 1.31 | 11.4 | 29.6 |
| 不透水面 | 2.77×10³ | 508 | 6.25×10⁻² | 6.13 | 305 | 7.19 | 5.14×10³ | 8.74×10³ |
| 总计 | 4.75×10⁴ | 1.13×10⁵ | 39.3 | 75 | 4.28×10³ | 29.3 | 1.08×10⁴ | 1.76×10⁵ |
表3 广东省2000-2022年土地利用转移矩阵
Table 3 Land use change Matrix from 2000 to 2022 in Guangdong Province km2
| 2000 | 2022 | |||||||
|---|---|---|---|---|---|---|---|---|
| 农田 | 森林 | 灌木 | 草地 | 水域 | 裸地 | 不透水面 | 总计 | |
| 农田 | 2.94×10⁴ | 1.05×10⁴ | 0.625 | 28 | 1.08×10³ | 13.3 | 4.17×10³ | 4.52×10⁴ |
| 森林 | 1.28×10⁴ | 1.01×10⁵ | 34.4 | 29.8 | 566 | 2.5 | 765 | 1.15×10⁵ |
| 灌木 | 4.13 | 61.6 | 3.88 | 0.75 | 0 | 0 | 0.188 | 70.6 |
| 草地 | 91.2 | 52.9 | 0.375 | 4.19 | 13.1 | 1.38 | 55.4 | 219 |
| 水域 | 2.37×10³ | 717 | 0 | 4.81 | 2.32×10³ | 3.63 | 679 | 6.09×10³ |
| 裸地 | 8.94 | 1.19 | 0 | 1.38 | 5.38 | 1.31 | 11.4 | 29.6 |
| 不透水面 | 2.77×10³ | 508 | 6.25×10⁻² | 6.13 | 305 | 7.19 | 5.14×10³ | 8.74×10³ |
| 总计 | 4.75×10⁴ | 1.13×10⁵ | 39.3 | 75 | 4.28×10³ | 29.3 | 1.08×10⁴ | 1.76×10⁵ |
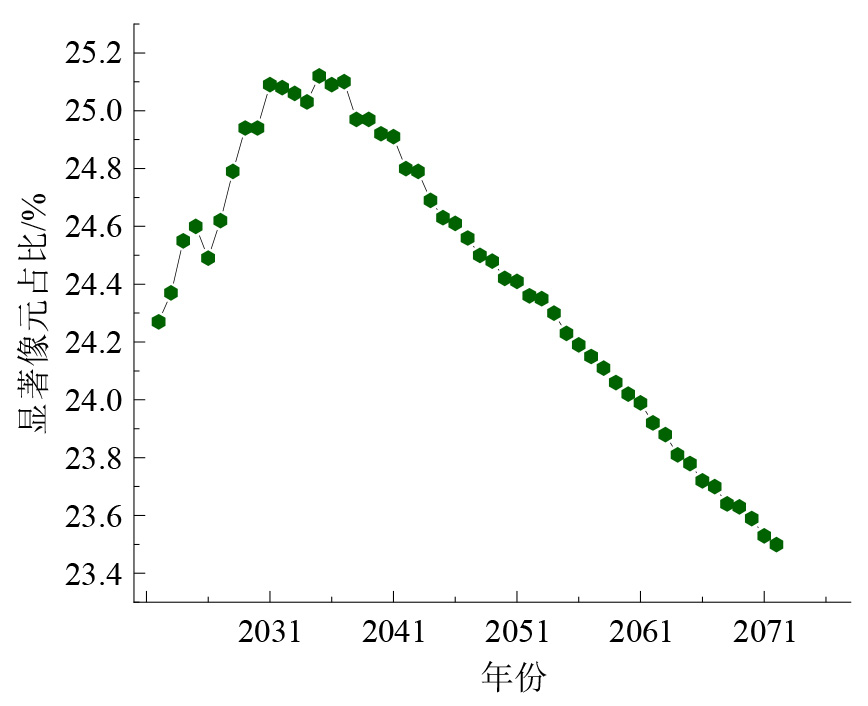
图8 kNDVI模拟值显著性(p<0.05)像元占比统计
Figure 8 Statistical analysis of the proportion of kNDVI pixels with significant simulation values (p<0.05) in Guangdong Province
| [1] | CAMPS-VALLS G, CAMPOS-TABERNER M, MORENO-MARTÍNEZ Á, et al., 2021. A unified vegetation index for quantifying the terrestrial biosphere[J]. Science Advances, 7(9): eabc7447. |
| [2] | CHEN Z C, ZHANG X F, JIAO Y H, et al., 2023. Investigating the spatio-temporal pattern evolution characteristics of vegetation change in Shendong coal mining area based on kNDVI and intensity analysis[J]. Frontiers in Ecology and Evolution, 11: 1344664. |
| [3] |
DENG Y H, WANG S J, BAI X Y, et al., 2018. Relationship among land surface temperature and LUCC, NDVI in typical karst area[J]. Scientific Reports, 8(1): 641.
DOI PMID |
| [4] | FENG X J, TIAN J, WANG Y X, et al., 2023. Spatio-temporal variation and climatic driving factors of vegetation coverage in the Yellow River Basin from 2001 to 2020 based on kNDVI[J]. Forests, 14(3): 620. |
| [5] | FOLEY J A, DEFRIES R, ASNER G P, et al., 2005. Global consequences of land use[J]. Science, 309(5304): 570-574. |
| [6] | GAFUROV A, MUKHARAMOVA S, SAVELIEV A, et al., 2023. Advancing agricultural crop recognition: The application of LSTM networks and spatial generalization in satellite data analysis[J]. Agriculture, 13(9): 1672. |
| [7] | GU Z P, CHEN X W, RUAN W F, et al., 2024. Quantifying the direct and indirect effects of Terrain, climate and human activity on the spatial pattern of kNDVI-based vegetation growth: A case study from the Minjiang River Basin, southeast China[J]. Ecological Informatics, 80(1): 102493. |
| [8] |
HOCHREITER S, SCHMIDHUBER J, 1997. Long short-term memory[J]. Neural Computation, 9(8): 1735-1780.
DOI PMID |
| [9] | JIANG H L, XU X, ZHANG T, et al., 2022. The relative roles of climate variation and human activities in vegetation dynamics in coastal China from 2000 to 2019[J]. Remote Sensing, 14(10): 2485. |
| [10] | YANG J, HUANG X, 2021. The 30 m annual land cover dataset and its dynamics in China from 1990 to 2019[J]. Earth System Science Data, 13(8): 3907-3925. |
| [11] | LI H, LI K X, ZHAO X, et al., 2022. Changes in vegetation greenness and their influencing factors in southern China[J]. Remote Sensing, 14(14): 3291. |
| [12] | LI Z Y, WU W Z, LIU X H, et al., 2017. Land use/cover change and regional climate change in an arid grassland ecosystem of inner Mongolia, China[J]. Ecological Modelling, 353: 86-94. |
| [13] | LIU X, DU G, BI H, et al., 2024. Normal difference vegetation index simulation and driving analysis of the Tibetan Plateau based on deep learning algorithms[J]. Forests, 15(1): 137. |
| [14] |
LUNDBERG S M, ERION G, CHEN H, et al., 2020. From local explanations to global understanding with explainable AI for trees[J]. Nature Machine Intelligence, 2(1): 56-67.
DOI PMID |
| [15] | YU W T, LI J, LIU Q H, et al., 2022. Spatial-temporal prediction of vegetation index with deep recurrent neural networks[J]. IEEE Geoscience and Remote Sensing Letters, 19: 1-5. |
| [16] |
陈甲豪, 胡中民, 吴凯, 2023. 1982-2015年海南岛NDVI时空变化及气候驱动力分析[J]. 遥感技术与应用, 38(5): 1071-1080.
DOI |
| CHEN J H, HU Z M, WU K, 2023. Spatiotemporal variations of NDVI and the analysis of its climate driving factors in Hainan Island during 1982-2015[J]. Remote Sensing Technology and Application, 38(5): 1071-1080. | |
| [17] | 陈澍祺, 何玲, 闫丰, 2024. 京津冀植被覆盖度时空演变及其对自然人为变化的响应[J]. 中国环境科学, 44(7): 3931-3944. |
| CHEN S Q, HE L, YAN F, 2024. Spatiotemporal evolution of vegetation coverage in Beijing-Tianjin-Hebei and its response to natural anthropogenic changes[J]. China Environmental Science, 44(7): 3931-3944. | |
| [18] | 陈智勇, 吴耀炜, 林港特, 等, 2024. 基于遥感生态指数的粤港澳生态环境质量与土地利用变化空间关系[J]. 环境科学, 45(11): 6433-6447. |
| CHEN Z Y, WU Y W, LIN G T, et al., 2024. Spatial relationship between eco-environment quality and land use change in Guangdong Province-Hong Kong-Macao, China based on remote sensing-based ecological index[J]. Environmental Science, 45(11): 6433-6447. | |
| [19] |
邓玉娇, 王捷纯, 徐杰, 等, 2021. 广东省NDVI时空变化特征及其对气候因子的响应[J]. 生态环境学报, 30(1): 37-43.
DOI |
| DENG Y J, WANG J C, XU J, et al., 2021. Spatiotemporal variation of NDVI and its response to climatic factors in Guangdong province[J]. Ecology and Environmental Sciences, 30(1): 37-43. | |
| [20] |
董凯辉, 向男, 王明旭, 等, 2024. 广东省土地利用变化对植被净初级生产力的影响分析[J]. 资源环境与工程, 38(2): 189-196.
DOI |
| DONG K H, XIANG N, WANG M X, et al., 2024. Effects of land use change on vegetation net primary productivity in Guangdong Province[J]. Resources Environment & Engineering, 38(2): 189-196. | |
| [21] | 杜海涛, 2022. 奏响粤北生态屏障绿色发展最强音[N]. 韶关日报, 2022-11-05(A01). |
| DU H T, 2022. Play the strongest sound of green development of ecological barrier in northern Guangdong[N]. Shaoguan Daily, 2022-11-05(A01). | |
| [22] | 冯娴慧, 曾芝琳, 张德顺, 2022. 基于MODIS NDVI数据的粤港澳大湾区植被覆盖时空演变[J]. 中国城市林业, 20(1): 1-28. |
| FENG X H, ZENG Z L, ZHANG D S, 2022. Temporal-spatial evolution of vegetation coverage in Guangdong-HongKong-Macao Greater Bay Area based on MODIS NDVI data[J]. Journal of Chinese Urban Forestry, 20(1): 1-28. | |
| [23] | 高振东, 2016. 西辽河流域植被覆盖度时空演变规律及其影响因素研究[D]. 沈阳: 沈阳农业大学: 1-106. |
| GAO Z D, 2016. Study of spatial temporal evolution rule and influential factors of vegetation coverage in west Liao River Basin[D]. Shenyang: Shenyang Agricultural University: 1-106. | |
| [24] | 郭兵, 张大富, 丁昊, 等, 2022. 近40年中国植被NDVI时空演变格局及主导驱动因子的差异分析[J]. 水土保持通报, 42(6): 312-321. |
| GUO B, ZHANG D F, DING H, et al., 2022. Spatial-temporal evolution pattern of NDVl and its driving factors in China in past 40 years[J]. Bulletin of Soil and Water Conservation, 42(6): 312-321. | |
| [25] |
何远政, 黄文达, 赵昕, 等, 2021. 气候变化对植物多样性的影响研究综述[J]. 中国沙漠, 41(1): 59-66.
DOI |
|
HE Y Z, HUANG W D, ZHAO X, et al., 2021. Review on the impact of climate change on plant diversity[J]. Journal of Desert Research, 41(1): 59-66.
DOI |
|
| [26] | 黄端, 甘家亮, 胡辉, 等, 2023. 赣江流域植被NPP时空演变及其驱动因子研究[J]. 测绘科学, 48(6): 119-130. |
| HUANG D, GAN J L, HU H, et al., 2023. Temporal and spatial evolution of NPP and the impact of driving factors in the Ganjiang River Basin[J]. Science of Surveying and Mapping, 48(6): 119-130. | |
| [27] | 李郊, 王冰, 王晨, 等, 2024. 2005-2020年江西省森林碳储量时空变化趋势及影响因素[J]. 林草资源研究 (1): 17-24. |
| LI J, WANG B, WANG C, et al., 2024. Spatiotemporal trends and influencing factors of forest carbon stock in Jiangxi Province from 2005 to 2020[J]. Forest and Grassland Resources Research (1): 17-24. | |
| [28] |
李加顺, 刘丽, 2023. 2000-2020年云南省植被时空变化及影响因素分析[J]. 草地学报, 31(11): 3503-3513.
DOI |
| LI J S, LIU L, 2023. Analysis of the spatiotemporal change and influencing factors of vegetation in Yunnan Province from 2000 to 2020[J]. Acta Agrestia Sinica, 31(11): 3503-3513. | |
| [29] | 李民梁, 张玉强, 2019. 广东沿海经济带空间结构与功能作用分析[J]. 广东开放大学学报, 28(6): 32-38. |
| LI M L, ZHANG Y Q, 2019. An analysis on the spatial structure and functions of the coastal economic zone in Guangdong province[J]. Journal of the Open University of Guangdong, 28(6): 32-38. | |
| [30] | 陆杰英, 孙丽颖, 王春林, 等, 2022. 1979-2020年粤北和珠三角地区夏季降水结构对比分析[J]. 气象研究与应用, 43(2): 23-28. |
| LU J Y, SUN L Y, WANG C L, et al., 2022. Comparative analysis of summer precipitation structure in northern Guangdong and the Pearl River Delta from 1979 to 2020[J]. Journal of Meteorological Research and Application, 43(2): 23-28. | |
| [31] | 马楠, 白涛, 蔡朝朝, 2024. 2000-2021年新疆植被覆盖度变化及驱动力[J]. 水土保持研究, 31(1): 385-394. |
| MA N, BAI T, CAI Z Z, 2024. Vegetation cover change and its response to climate and surface factors in Xinjiang based on different vegetation types[J]. Research of Soil and Water Conservation, 31(1): 385-394. | |
| [32] | 毛智慧, 黎丽莉, 程露, 等, 2023. 广东省植被叶面积指数时空变化特征及其影响因素[J]. 地球科学与环境学报, 45(4): 907-919. |
| MAO Z H, LI L L, CHENG L, et al., 2023. Spatiotemporal variation of vegetation leaf area index and its influencing factors in Guangdong Province, China[J]. Journal of Earth Sciences and Environment, 45(4): 907-919. | |
| [33] | 王静, 王克林, 张明阳, 等, 2014. 南方丘陵山地带NDVI时空变化及其驱动因子分析[J]. 资源科学, 36(8): 1712-1723. |
| WANG J, WANG K L, ZHANG M Y, et al., 2014. Temporal-spatial variation in NDVI and drivers in Hilly Terrain of southern China[J]. Resources Science, 36(8): 1712-1723. | |
| [34] | 王思, 张路路, 林伟彪, 等, 2022. 基于MODIS-归一化植被指数的广东省植被覆盖与土地利用变化研究[J]. 生态学报, 42(6): 2149-2163. |
| WANG S, ZHANG L L, LIN W B, et al., 2022. Study on vegetation coverage and land-use change of Guangdong Province based on MODIS-NDVI[J]. Acta Ecologica Sinica, 42(6): 2149-2163. | |
| [35] | 王正兴, 刘闯, HUETE A, 2003. 植被指数研究进展: 从AVHRR-NDVI到MODIS-EVI[J]. 生态学报, 23(5): 979-987. |
| WANG Z X, LIU C, HUETE A, 2003. From AVHRR-NDVI to MODIS-EVI: advances in vegetation index research[J]. Acta Ecologica Sinica, 23(5): 979-987. | |
| [36] | 吴运力, 张钰, 田佳榕, 2023. 气候变化和人类活动对内蒙古高原不同植被类型NDVI的影响[J]. 中国农业气象, 44(12): 1155-1168. |
|
WU Y L, ZHANG Y, TIAN J L, 2023. Impacts by climate change and human activities on NDVI in different vegetation types across the Inner Mongolia Plateau[J]. Chinese Journal of Agrometeorology, 44(12): 1155-1168.
DOI |
|
| [37] | 肖柳斯, 张华龙, 吴乃庚, 等, 2024. 广东省汛期分钟尺度极端降水的时空分布及持续性特征[J]. 大气科学, 48(5): 1728-1742. |
| XIAO L S, ZHAN H L, WU N G, et al., 2024. Spatiotemporal distribution and duration characteristics of minute-scale extreme precipitation during flood season in Guangdong Province[J]. Chinese Journal of Atmospheric Sciences, 48(5): 1728-1742. (in Chinese) | |
| [38] | 徐锋, 2024. 1961-2021年华南地区复合干旱-高温变化[J]. 中国防汛抗旱, 34(5): 38-44. |
| XU F, 2024. Changes of concurrent drought and hot extremes in South China during 1961-2021[J]. China Flood & Drought Management, 34(5): 38-44. | |
| [39] | 徐金勤, 符靖茹, 朱平, 等, 2024. 广东省主要农业灾害性天气的时空变化特征及危险性评价[J/OL]. 热带农业科学, 1-9. (2024-03-08) [2024-06-18]. http://kns.cnki.net/kcms/detail/46.1038.S.20240306.1216.002.html. |
| XU J Q, FU J R, ZHU P, et al., 2024. Spatio-temporal characteristics and risk zoning of the main agricultural disastrous weather in Guangdong Province[J/OL]. Chinese Journal of Tropical Agriculture, (2024-03-08) [2024-06-18]. http://kns.cnki.net/kcms/detail/46.1038.S.20240306.1216.002.html. | |
| [40] | 杨嘉, 郭铌, 黄蕾诺, 等, 2008. 西北地区MODIS-NDVI指数饱和问题分析[J]. 高原气象, 27(4): 896-903. |
| YANG J, GUO N, HUANG L N, et al., 2008. Ananlyses on MODIS-NDVI index saturation in northwest China[J]. Plateau Meteorology, 27(4): 896-903. | |
| [41] | 易文莹, 王海洋, 董明明, 等, 2024. 山东省不同水土保持区划NDVI变化及影响因素[J]. 环境科学, 45(9): 5329-5340. |
| YI W Y, WANG H Y, DONG M M, et al., 2024. NDVI changes and influencing factors of different soil and water conservation zones in Shandong Province[J]. Environmental Science, 45(9): 5329-5340. | |
| [42] | 袁丽华, 蒋卫国, 申文明, 等, 2013. 2000-2010年黄河流域植被覆盖的时空变化[J]. 生态学报, 33(24): 7798-7806. |
| YUAN L H, JIANG W G, SHEN W M, et al., 2013. The spatio temporal variations of vegetation cover in the Yellow River Basin from 2000 to 2010[J]. Acta Ecologica Sinica, 33(24): 7798-7806. | |
| [43] | 曾芝琳, 2022. 粤港澳大湾区植被覆盖度动态变化及影响因子分析[D]. 广州: 华南理工大学: 1-93. |
| ZENG Z L, 2022. Analysis of vegetation coverage change and its influencing factors in Guangdong-Hong Kong-Macao Greater Bay Area[D]. Guangzhou: South China University of Technology: 1-93. | |
| [44] | 张柳红, 王华, 刘畅, 等, 2023. 广东骤旱时空特征及其与传统干旱的对比分析[J]. 广东气象, 45(6): 1-6. |
| ZHANG L H, WANG H, LIU C et al., 2023. Spatiotemporal characteristics of flash droughts in Guangdong Province and comparison and analysis with traditional droughts[J]. Guangdong Meteorology, 46(6): 1-6. | |
| [45] | 张岳, 孙梦鑫, 辛宇, 等, 2023. 2000-2020年川东地区植被NDVI变化趋势及影响因素分析[J]. 水土保持研究, 30(6): 247-254, 263. |
| ZHANG Y, SUN M X, XIN Y, et al., 2023. Trend and influencing factors of vegetation NDVI in Eastern Sichuan from 2000 to 2020[J]. Research of Soil and Water Conservation, 30(6): 247-254, 263. | |
| [46] | 赵光远, 董心悦, 曹则煜, 等, 2024. 三生空间视角下京津冀地区植被净初级生产力时空变化及其驱动因素[J/OL]. 生态学杂志, 1-12. (2024-09-19) [2024-11-01]. https://doi.org/10.13292/j.1000-4890.202506.050. |
| ZHAO G Y, DONG X Y, CAO Z Y, et al., 2024. Spatiotemporal changes and driving factors of vegetation net primary productivity in the Jing-Jin-Ji Region from the perspective of the production-living-ecological space[J/OL]. Chinese Journal of Ecology, 1-12 (2024-09-19) [2024-11-01]. https://doi.org/10.13292/j.1000-4890.202506.050. | |
| [47] |
朱华, 谭运洪, 2023. 中国热带雨林的群落特征、研究现状及问题[J]. 植物生态学报, 47(4): 447-468.
DOI |
|
ZHU H, TAN Y H, 2023. Community characteristics, research states and problems of tropical rain forests in China[J]. Chinese Journal of Plant Ecology, 47(4): 447-468.
DOI |
|
| [48] | 朱君瑶, 2023. 2000-2020年饶河流域NDVI时空变化及驱动因素分析[D]. 南昌: 江西农业大学: 1-82. |
| ZHU J Y, 2023. NDVI spatio-temporal changes and its driving factors in Rao River Basin from 2000 to 2020[D]. Nanchang: Jiangxi Agricultural University: 1-82. | |
| [49] | 朱铁才, 林文实, 叶坤辉, 等, 2011. 珠三角地区近38年冬半年降水量变化特征及干旱成因分析[J]. 中山大学学报(自然科学版), 50(4): 144-147, 150. |
| ZHU T C, LIN W S, YE K H, et al., 2011. Precipitation variations and drought causes in the cold half of the year in the Pearl River delta region during the past 38 Years[J]. Acta Scientiarum Naturalium Universitatis Sunyatseni, 50(4): 144-147, 150. |
| [1] | 戴晓爱, 马佳欣, 唐艺菱, 李为乐. 甘肃省植被时空动态变化及其归因分析[J]. 生态环境学报, 2024, 33(8): 1163-1173. |
| [2] | 高文明, 宋芊, 张皓翔, 王士如. 基于生态系统服务功能和保护动物栖息地适宜性评价的优先保护区选取——以三江源地区为例[J]. 生态环境学报, 2024, 33(8): 1318-1328. |
| [3] | 向男, 王明旭, 张宏锋, 廖宝淦. 生态保护重要性分区及其长时间序列生境状况时空分异研究——以广东省为例[J]. 生态环境学报, 2024, 33(6): 958-968. |
| [4] | 何沐全, 石艳军, 王晨茜, 罗祖红, 张少通. 广东省植被生态质量演变与气象条件贡献分析[J]. 生态环境学报, 2024, 33(5): 679-688. |
| [5] | 梁茂厂, 郭晓华, 张影, 马雨萌, 陈弈铭, 龚复俊. 湖北省生态环境质量的时空演变特征及影响因素分析[J]. 生态环境学报, 2024, 33(10): 1634-1647. |
| [6] | 宁健, 程晓波, 苏超丽, 汤泽平, 余泽峰. 广东省伴生放射性矿周围土壤放射性水平分析[J]. 生态环境学报, 2023, 32(9): 1692-1699. |
| [7] | 张鐥文, 杨冉, 侯文星, 王丽丽, 刘爽, 宋汉扬, 赵文吉, 李令军. 生态补水前后永定河两岸植被覆盖度变化及驱动力分析[J]. 生态环境学报, 2023, 32(2): 264-273. |
| [8] | 鲁言波, 陈湛峰, 李彤. 基于改进TOPSIS模型的广东省主要湖库水质特征分析[J]. 生态环境学报, 2023, 32(12): 2194-2206. |
| [9] | 樊艳翔, 雷社平, 解建仓. 广东省河流水体富营养化综合评价及分异特征——基于博弈论组合赋权法与VIKOR模型[J]. 生态环境学报, 2023, 32(10): 1811-1821. |
| [10] | 贾志峰, 刘鹏程, 刘宇, 吴博博, 陈丹姿, 张向飞. 气候变化和人类活动对松辽流域植被覆盖的影响[J]. 生态环境学报, 2023, 32(1): 1-10. |
| [11] | 苏泳松, 宋松, 陈叶, 叶子强, 钟润菲, 王昭尧. 珠江三角洲人类活动净氮输入时空特征及其影响因素[J]. 生态环境学报, 2022, 31(8): 1599-1609. |
| [12] | 王晨茜, 张琼锐, 张若琪, 孙学超, 徐颂军. 广东省珠江流域景观格局对水质净化服务的影响[J]. 生态环境学报, 2022, 31(7): 1425-1433. |
| [13] | 李登科, 王钊. 气候变化和人类活动对陕西省植被NPP影响的定量分析[J]. 生态环境学报, 2022, 31(6): 1071-1079. |
| [14] | 刘香华, 王秀明, 刘谞承, 张音波, 刘飘. 基于外溢生态系统服务价值的广东省生态补偿机制研究[J]. 生态环境学报, 2022, 31(5): 1024-1031. |
| [15] | 黄巧义, 于俊红, 黄建凤, 黄旭, 李苹, 付弘婷, 唐拴虎, 刘一锋, 徐培智. 广东省主要农作物秸秆养分资源量及替代化肥潜力[J]. 生态环境学报, 2022, 31(2): 297-306. |
| 阅读次数 | ||||||
|
全文 |
|
|||||
|
摘要 |
|
|||||