生态环境学报 ›› 2024, Vol. 33 ›› Issue (11): 1672-1685.DOI: 10.16258/j.cnki.1674-5906.2024.11.002
罗光浴1( ), 王志远2,*
收稿日期:2024-06-28
出版日期:2024-11-18
发布日期:2024-12-06
通讯作者:
*王志远。作者简介:罗光浴(2000年生),男,硕士研究生,研究方向为国土空间规划。E-mail: 409642089@qq.com
基金资助:
LUO Guangyu1(), WANG Zhiyuan2,*
Received:2024-06-28
Online:2024-11-18
Published:2024-12-06
摘要:
国土空间是生态文明建设的空间载体,揭示区域国土空间格局演变的生态系统碳储量效应,对于区域国土空间格局优化与管控、实现“双碳”战略目标具有重要意义。以洞庭湖生态经济区为例,通过分析1990-2020年区域国土空间格局演变特征,运用InVEST模型、国土空间碳储量贡献率与潜在影响指数,采用最优参数地理探测器,揭示区域国土空间格局演变的生态系统碳储量效应及碳储量空间分异的驱动因素。结果表明,1)1990-2020年洞庭湖生态经济区国土空间类型以农业生产空间与林地生态空间为主,二者面积占研究区总面积的75%以上;研究期内,不同国土空间类型动态度存在显著差异,总体上表现为农业生产空间与草地生态空间的缩减,以及工矿生产空间与城镇生活空间的扩张。2)1990-2020年洞庭湖生态经济区碳储量呈波动减少趋势,30年间共减少8.58×10⁶ t,农业生产空间与水域生态空间、林地生态空间之间的相互转化是导致碳储量变化的主要原因;区域碳储量整体上呈现出“西部、西南部与东南部高,中部与东北部低”的空间分布格局。国土空间格局演变对区域碳储量服务表现为正向潜在影响,且正向潜在影响在不断减弱,碳储量服务脆弱性在不断降低。3)1990-2020年洞庭湖生态经济区碳储量时空分异是自然要素与社会经济要素综合作用的结果,生境质量与高程为主要驱动因子,且各驱动因子间的交互作用均呈现双因子增强和非线性增强作用。研究结果可为洞庭湖生态经济区国土空间格局优化及固碳能力提升提供理论支撑。
中图分类号:
罗光浴, 王志远. 洞庭湖生态经济区国土空间格局演变的碳储量效应及驱动因素研究[J]. 生态环境学报, 2024, 33(11): 1672-1685.
LUO Guangyu, WANG Zhiyuan. Research on the Carbon Storage Effect and Driving Factors of the Evolution of Territorial Space Pattern in Dongting Lake Ecological and Economic Zone[J]. Ecology and Environment, 2024, 33(11): 1672-1685.

图1 洞庭湖生态经济区行政区划 文本所有地图基于国家地理信息公共服务平台GS (2024) 0650号标准地图制作,底图边界无修改
Figure 1 Administrative division of Dongting Lake Ecological and Economic Zone
| 国土空间分类 | 土地利用类型 | |
|---|---|---|
| 一级空间 | 二级空间 | |
| 城镇空间 | 1城镇生活空间 | 城镇用地 |
| 2工矿生产空间 | 工矿业和交通建设用地 | |
| 农业空间 | 3乡村生活空间 | 农村居民点用地 |
| 4农业生产空间 | 水田、旱地 | |
| 生态空间 | 5林地生态空间 | 有林地、灌木林地、疏林地、其他林地 |
| 6草地生态空间 | 高覆盖度草地、中覆盖度草地、低覆盖度草地 | |
| 7水域生态空间 | 河渠、湖泊、水库、坑塘、滩地 | |
| 8其他生态空间 | 沙地、盐碱地、沼泽地、裸土地、裸岩石砾地 | |
表1 国土空间分类体系与土地利用类型衔接表
Table 1 Connection table of territorial space classification system and land use types
| 国土空间分类 | 土地利用类型 | |
|---|---|---|
| 一级空间 | 二级空间 | |
| 城镇空间 | 1城镇生活空间 | 城镇用地 |
| 2工矿生产空间 | 工矿业和交通建设用地 | |
| 农业空间 | 3乡村生活空间 | 农村居民点用地 |
| 4农业生产空间 | 水田、旱地 | |
| 生态空间 | 5林地生态空间 | 有林地、灌木林地、疏林地、其他林地 |
| 6草地生态空间 | 高覆盖度草地、中覆盖度草地、低覆盖度草地 | |
| 7水域生态空间 | 河渠、湖泊、水库、坑塘、滩地 | |
| 8其他生态空间 | 沙地、盐碱地、沼泽地、裸土地、裸岩石砾地 | |
| 数据类型 | 因子 | 数据来源 |
|---|---|---|
| 自然要素 | X1高程 | 地理空间数据云 ( |
| X2坡度 | 基于高程数据在ArcGIS软件计算 | |
| X3地形起伏度 | 基于高程数据在ArcGIS软件计算 | |
| X4年平均气温 | 国家青藏高原科学数据中心( | |
| X5年平均降水 | 国家青藏高原科学数据中心( | |
| X6归一化植被指数 | 中国科学院资源环境科学数据中心( | |
| X7生境质量 | 基于InVEST模型计算 | |
| 社会经济要素 | X8地均GDP | 洞庭湖地区各市统计年鉴 |
| X9人口密度 | 中国科学院资源环境科学数据中心( | |
| X10夜间灯光指数 | 中国科学院资源环境科学数据中心( |
表2 碳储量驱动因子及数据来源
Table 2 Carbon storage driving factors and data sources
| 数据类型 | 因子 | 数据来源 |
|---|---|---|
| 自然要素 | X1高程 | 地理空间数据云 ( |
| X2坡度 | 基于高程数据在ArcGIS软件计算 | |
| X3地形起伏度 | 基于高程数据在ArcGIS软件计算 | |
| X4年平均气温 | 国家青藏高原科学数据中心( | |
| X5年平均降水 | 国家青藏高原科学数据中心( | |
| X6归一化植被指数 | 中国科学院资源环境科学数据中心( | |
| X7生境质量 | 基于InVEST模型计算 | |
| 社会经济要素 | X8地均GDP | 洞庭湖地区各市统计年鉴 |
| X9人口密度 | 中国科学院资源环境科学数据中心( | |
| X10夜间灯光指数 | 中国科学院资源环境科学数据中心( |
| 国土空间类型 | 地上生物量碳密度 | 地下生物量碳密度 | 土壤碳密度 | 死亡有机物碳密度 |
|---|---|---|---|---|
| 城镇生活空间 | 0.84 | 1.63 | 35.5 | 0.00 |
| 工矿生产空间 | 0.91 | 1.38 | 30.7 | 0.00 |
| 乡村生活空间 | 2.40 | 1.46 | 42.5 | 0.00 |
| 农业生产空间 | 2.06 | 0.31 | 62.9 | 0.00 |
| 林地生态空间 | 36.1 | 15.7 | 116 | 1.29 |
| 草地生态空间 | 4.70 | 9.83 | 62.9 | 1.33 |
| 水域生态空间 | 0.00 | 0.00 | 11.2 | 0.00 |
| 其他生态空间 | 0.63 | 1.56 | 33.3 | 1.13 |
表3 洞庭湖生态经济区各类国土空间碳密度
Table 3 Carbon intensity of various types of territorial space in Dongting Lake Ecological Economic Zone t·hm-2
| 国土空间类型 | 地上生物量碳密度 | 地下生物量碳密度 | 土壤碳密度 | 死亡有机物碳密度 |
|---|---|---|---|---|
| 城镇生活空间 | 0.84 | 1.63 | 35.5 | 0.00 |
| 工矿生产空间 | 0.91 | 1.38 | 30.7 | 0.00 |
| 乡村生活空间 | 2.40 | 1.46 | 42.5 | 0.00 |
| 农业生产空间 | 2.06 | 0.31 | 62.9 | 0.00 |
| 林地生态空间 | 36.1 | 15.7 | 116 | 1.29 |
| 草地生态空间 | 4.70 | 9.83 | 62.9 | 1.33 |
| 水域生态空间 | 0.00 | 0.00 | 11.2 | 0.00 |
| 其他生态空间 | 0.63 | 1.56 | 33.3 | 1.13 |

图2 1990-2020年洞庭湖生态经济区各时期国土空间类型分布
Figure 2 Distribution of territorial space types in each period of Dongting Lake Ecological Economic Zone from 1990 to 2020
| 国土空间类型 | 面积/km2 | 动态度/% | |||||||
|---|---|---|---|---|---|---|---|---|---|
| 1990年 | 2000年 | 2010年 | 2020年 | 1990‒2000年 | 2000‒2010年 | 2010‒2020年 | 1990‒2020年 | ||
| 城镇生活空间 | 355 | 408 | 600 | 657 | 15.2 | 46.9 | 9.50 | 85.4 | |
| 工矿生产空间 | 42 | 80.4 | 265 | 658 | 91.5 | 230 | 148 | 1.47×10³ | |
| 乡村生活空间 | 1.1×10³ | 1.12×10³ | 1.14×10³ | 1.16×10³ | 1.45 | 1.79 | 1.93 | 5.26 | |
| 农业生产空间 | 2.77×10⁴ | 2.75×10⁴ | 2.64×10⁴ | 2.61×10⁴ | -0.95 | -3.71 | -1.32 | -5.88 | |
| 林地生态空间 | 2.23×10⁴ | 2.23×10⁴ | 2.22×10⁴ | 2.21×10⁴ | -0.02 | 0.02 | -0.69 | -0.69 | |
| 草地生态空间 | 905 | 904 | 846 | 847 | -0.13 | -6.37 | 0.13 | -6.38 | |
| 水域生态空间 | 7.18×10³ | 7.34×10³ | 7.76×10³ | 7.78×10³ | 2.25 | 5.63 | 0.27 | 8.30 | |
| 其他生态空间 | 878 | 877 | 1.14×10³ | 1.15×10³ | -0.09 | 29.8 | 0.64 | 30.5 | |
表4 1990-2020年洞庭湖生态经济区国土空间类型变化动态度
Table 4 Dynamic degree of territorial space type changes in Dongting Lake Ecological Economic Zone from 1990 to 2020
| 国土空间类型 | 面积/km2 | 动态度/% | |||||||
|---|---|---|---|---|---|---|---|---|---|
| 1990年 | 2000年 | 2010年 | 2020年 | 1990‒2000年 | 2000‒2010年 | 2010‒2020年 | 1990‒2020年 | ||
| 城镇生活空间 | 355 | 408 | 600 | 657 | 15.2 | 46.9 | 9.50 | 85.4 | |
| 工矿生产空间 | 42 | 80.4 | 265 | 658 | 91.5 | 230 | 148 | 1.47×10³ | |
| 乡村生活空间 | 1.1×10³ | 1.12×10³ | 1.14×10³ | 1.16×10³ | 1.45 | 1.79 | 1.93 | 5.26 | |
| 农业生产空间 | 2.77×10⁴ | 2.75×10⁴ | 2.64×10⁴ | 2.61×10⁴ | -0.95 | -3.71 | -1.32 | -5.88 | |
| 林地生态空间 | 2.23×10⁴ | 2.23×10⁴ | 2.22×10⁴ | 2.21×10⁴ | -0.02 | 0.02 | -0.69 | -0.69 | |
| 草地生态空间 | 905 | 904 | 846 | 847 | -0.13 | -6.37 | 0.13 | -6.38 | |
| 水域生态空间 | 7.18×10³ | 7.34×10³ | 7.76×10³ | 7.78×10³ | 2.25 | 5.63 | 0.27 | 8.30 | |
| 其他生态空间 | 878 | 877 | 1.14×10³ | 1.15×10³ | -0.09 | 29.8 | 0.64 | 30.5 | |

图3 1990-2020年洞庭湖生态经济区国土空间类型变化综合动态度
Figure 3 Comprehensive dynamics of territorial space type changes in Dongting Lake Ecological Economic Zone from 1990 to 2020

图4 1990-2020年洞庭湖生态经济区国土空间格局演变的弦图可视化表达
Figure 4 Visual diagram of territorial spacce pattern evolution of Dongting Lake Ecological Economic Zone from 1990 to 2020
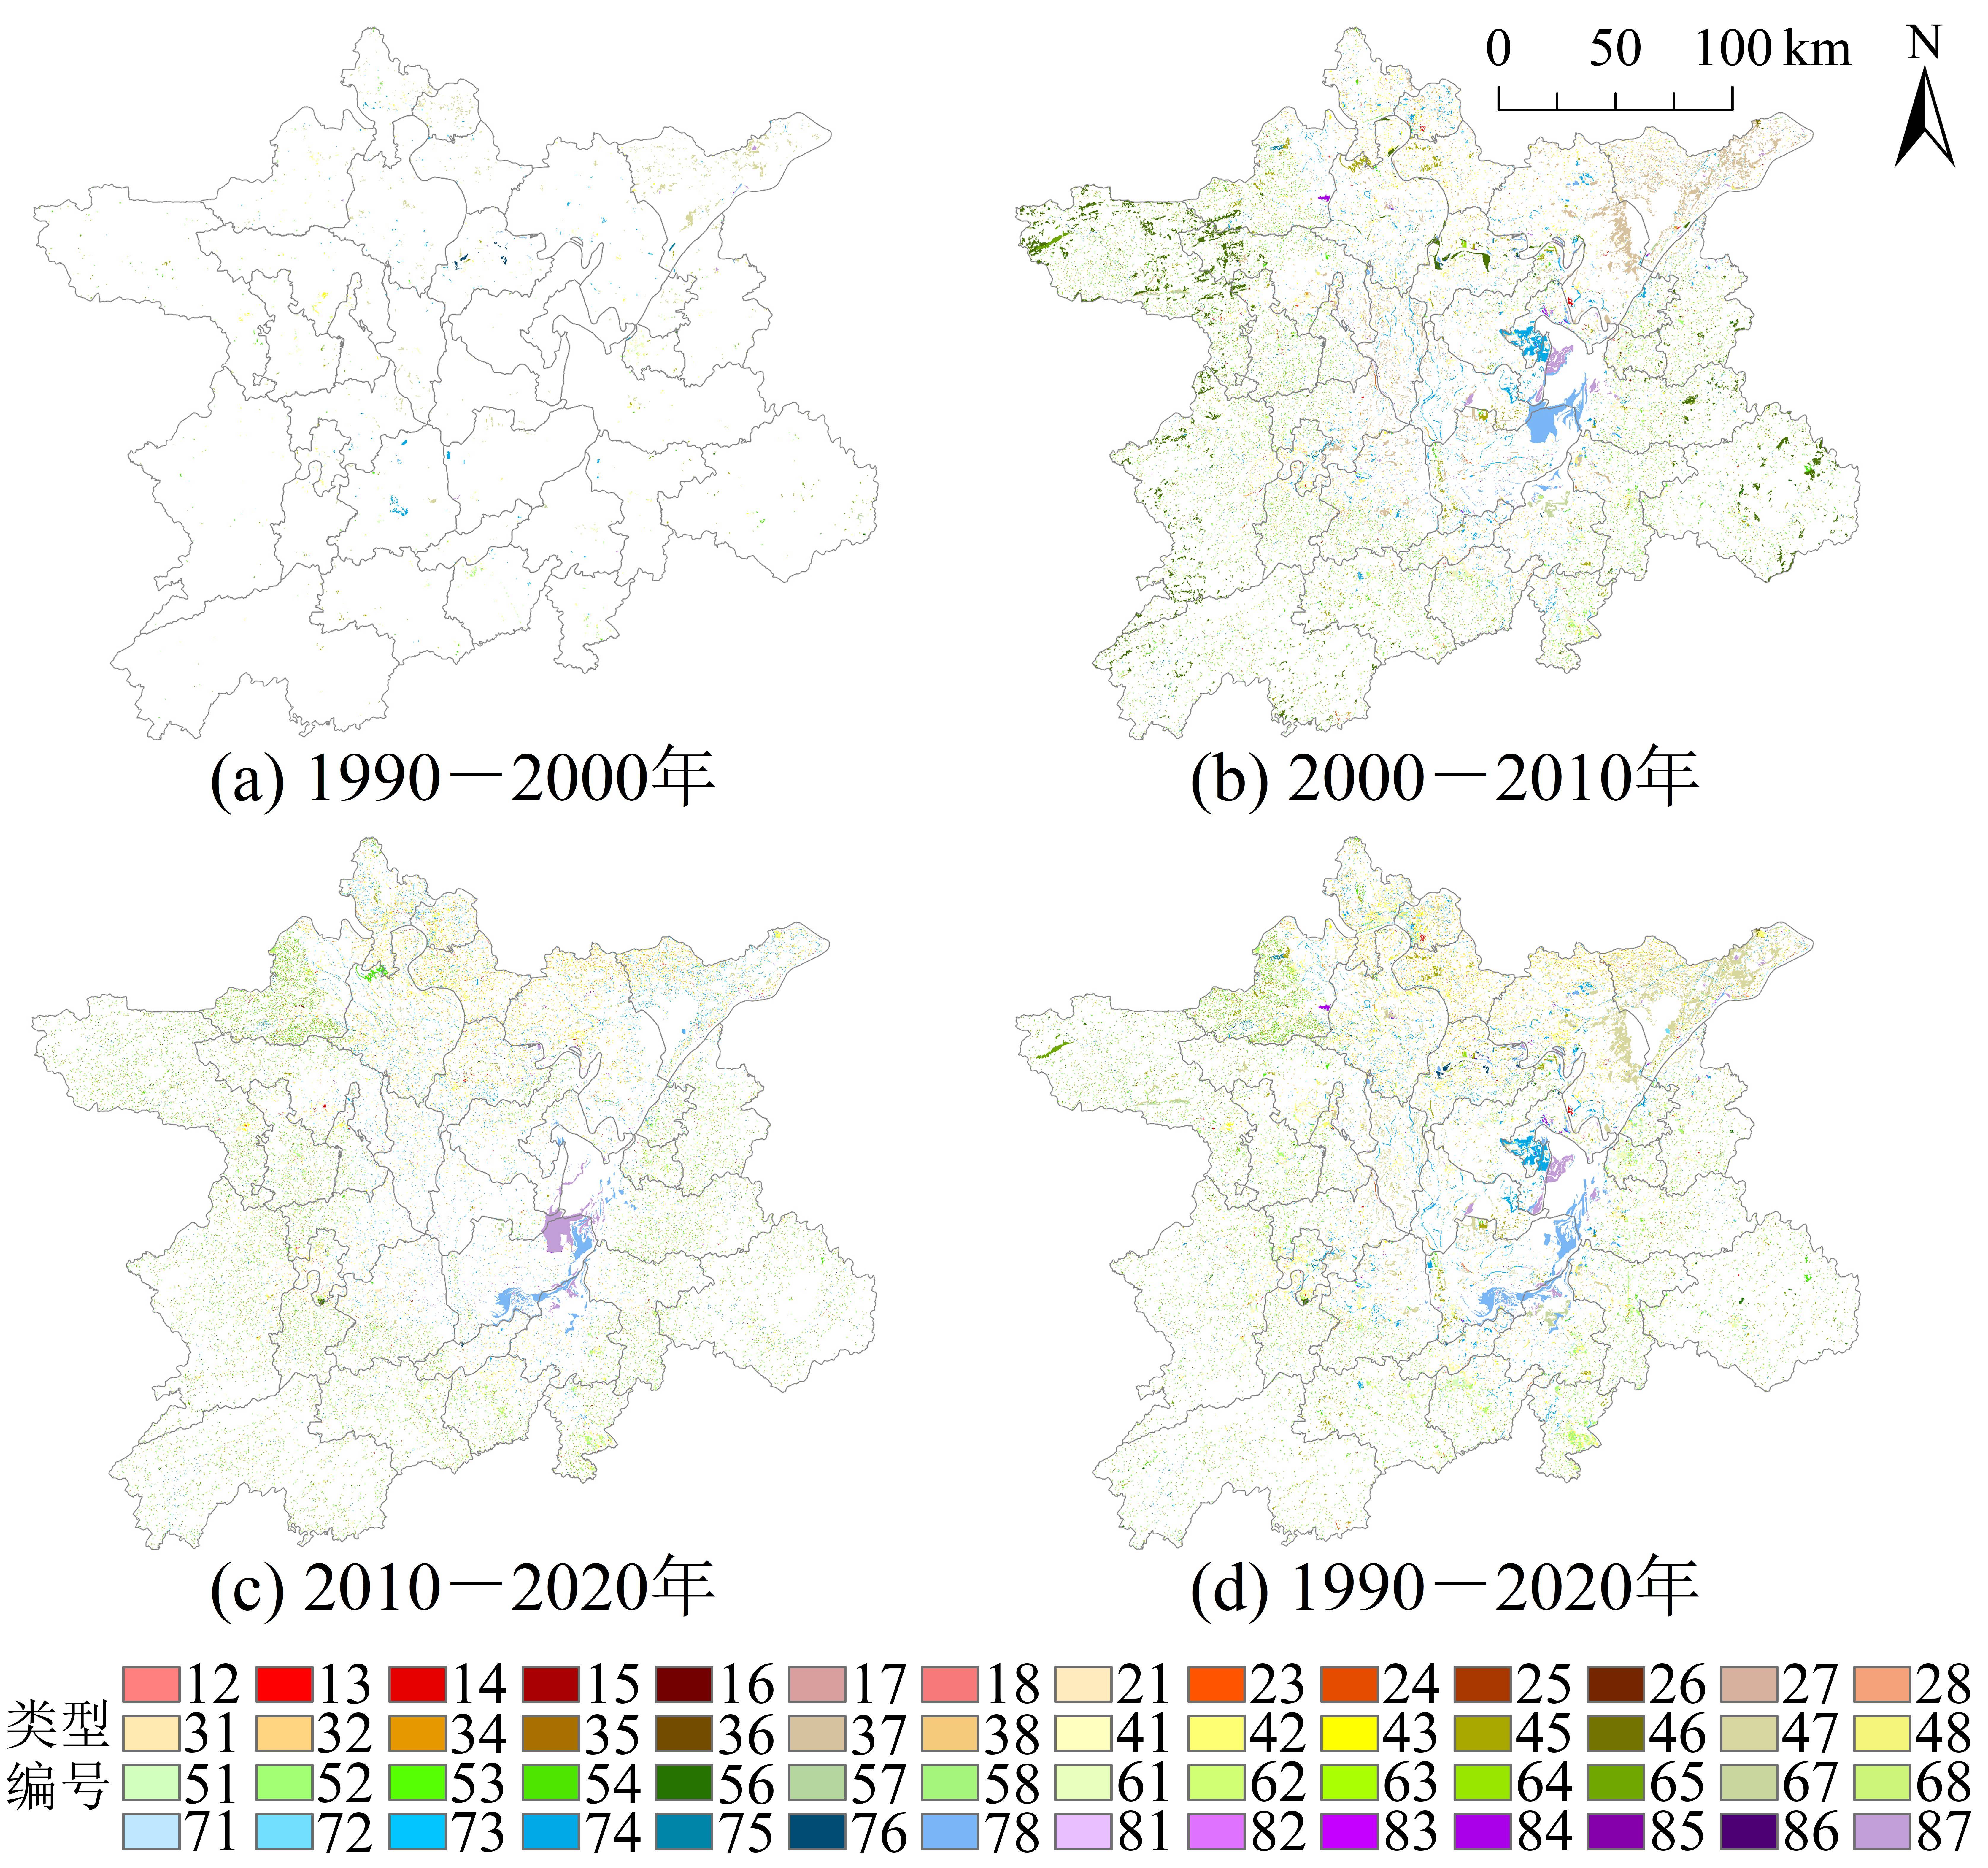
图5 1990-2020年洞庭湖生态经济区国土空间变化图谱 图例中数字编码分别表示转出与转入国土空间类型(具体见表1)
Figure 5 Atlas of territorial Space Changes in Dongting Lake Ecological Economic Zone from 1990 to 2020
| 年份 | 城镇空间 | 农业空间 | 生态空间 | 总计 | |||||||
|---|---|---|---|---|---|---|---|---|---|---|---|
| 城镇生活空间 | 工矿生产空间 | 乡村生活空间 | 农业生产空间 | 林地生态空间 | 草地生态空间 | 水域生态空间 | 其他生态空间 | ||||
| 1990 | 1.35 | 0.14 | 5.12 | 181 | 376 | 7.13 | 8.06 | 3.22 | 581 | ||
| 2000 | 1.55 | 0.27 | 5.20 | 179 | 375 | 7.12 | 8.25 | 3.22 | 580 | ||
| 2010 | 2.28 | 0.87 | 5.29 | 173 | 376 | 6.66 | 8.71 | 4.17 | 576 | ||
| 2020 | 2.50 | 2.17 | 5.39 | 170 | 373 | 6.67 | 8.73 | 4.20 | 573 | ||
| 1990‒2000 | 0.20 | 0.13 | 0.08 | -1.72 | -0.07 | -0.01 | 0.19 | 0.00 | -1.20 | ||
| 2000‒2010 | 0.73 | 0.60 | 0.09 | -6.64 | 0.07 | -0.46 | 0.46 | 0.95 | -4.20 | ||
| 2010‒2020 | 0.22 | 1.30 | 0.10 | -2.28 | -2.58 | 0.01 | 0.02 | 0.03 | -3.18 | ||
| 1990‒2020 | 1.15 | 2.03 | 0.27 | -10.6 | -2.58 | -0.46 | 0.67 | 0.98 | -8.58 | ||
表5 1990-2020年洞庭湖生态经济区国土空间碳储量变化
Table 5 Changes in carbon storage in territorial space of Dongting Lake Ecological Economic Zone from 1990 to 2020 106 t
| 年份 | 城镇空间 | 农业空间 | 生态空间 | 总计 | |||||||
|---|---|---|---|---|---|---|---|---|---|---|---|
| 城镇生活空间 | 工矿生产空间 | 乡村生活空间 | 农业生产空间 | 林地生态空间 | 草地生态空间 | 水域生态空间 | 其他生态空间 | ||||
| 1990 | 1.35 | 0.14 | 5.12 | 181 | 376 | 7.13 | 8.06 | 3.22 | 581 | ||
| 2000 | 1.55 | 0.27 | 5.20 | 179 | 375 | 7.12 | 8.25 | 3.22 | 580 | ||
| 2010 | 2.28 | 0.87 | 5.29 | 173 | 376 | 6.66 | 8.71 | 4.17 | 576 | ||
| 2020 | 2.50 | 2.17 | 5.39 | 170 | 373 | 6.67 | 8.73 | 4.20 | 573 | ||
| 1990‒2000 | 0.20 | 0.13 | 0.08 | -1.72 | -0.07 | -0.01 | 0.19 | 0.00 | -1.20 | ||
| 2000‒2010 | 0.73 | 0.60 | 0.09 | -6.64 | 0.07 | -0.46 | 0.46 | 0.95 | -4.20 | ||
| 2010‒2020 | 0.22 | 1.30 | 0.10 | -2.28 | -2.58 | 0.01 | 0.02 | 0.03 | -3.18 | ||
| 1990‒2020 | 1.15 | 2.03 | 0.27 | -10.6 | -2.58 | -0.46 | 0.67 | 0.98 | -8.58 | ||

图6 1990-2020年洞庭湖生态经济区碳储量格局
Figure 6 Carbon storage patterns of Dongting Lake Ecological Economic Zone from 1990 to 2020

图7 1990-2020年洞庭湖生态经济区碳储量变化空间分布
Figure 7 Spatial distribution of carbon storage changes in Dongting Lake Ecological Economic Zone from 1990 to 2020
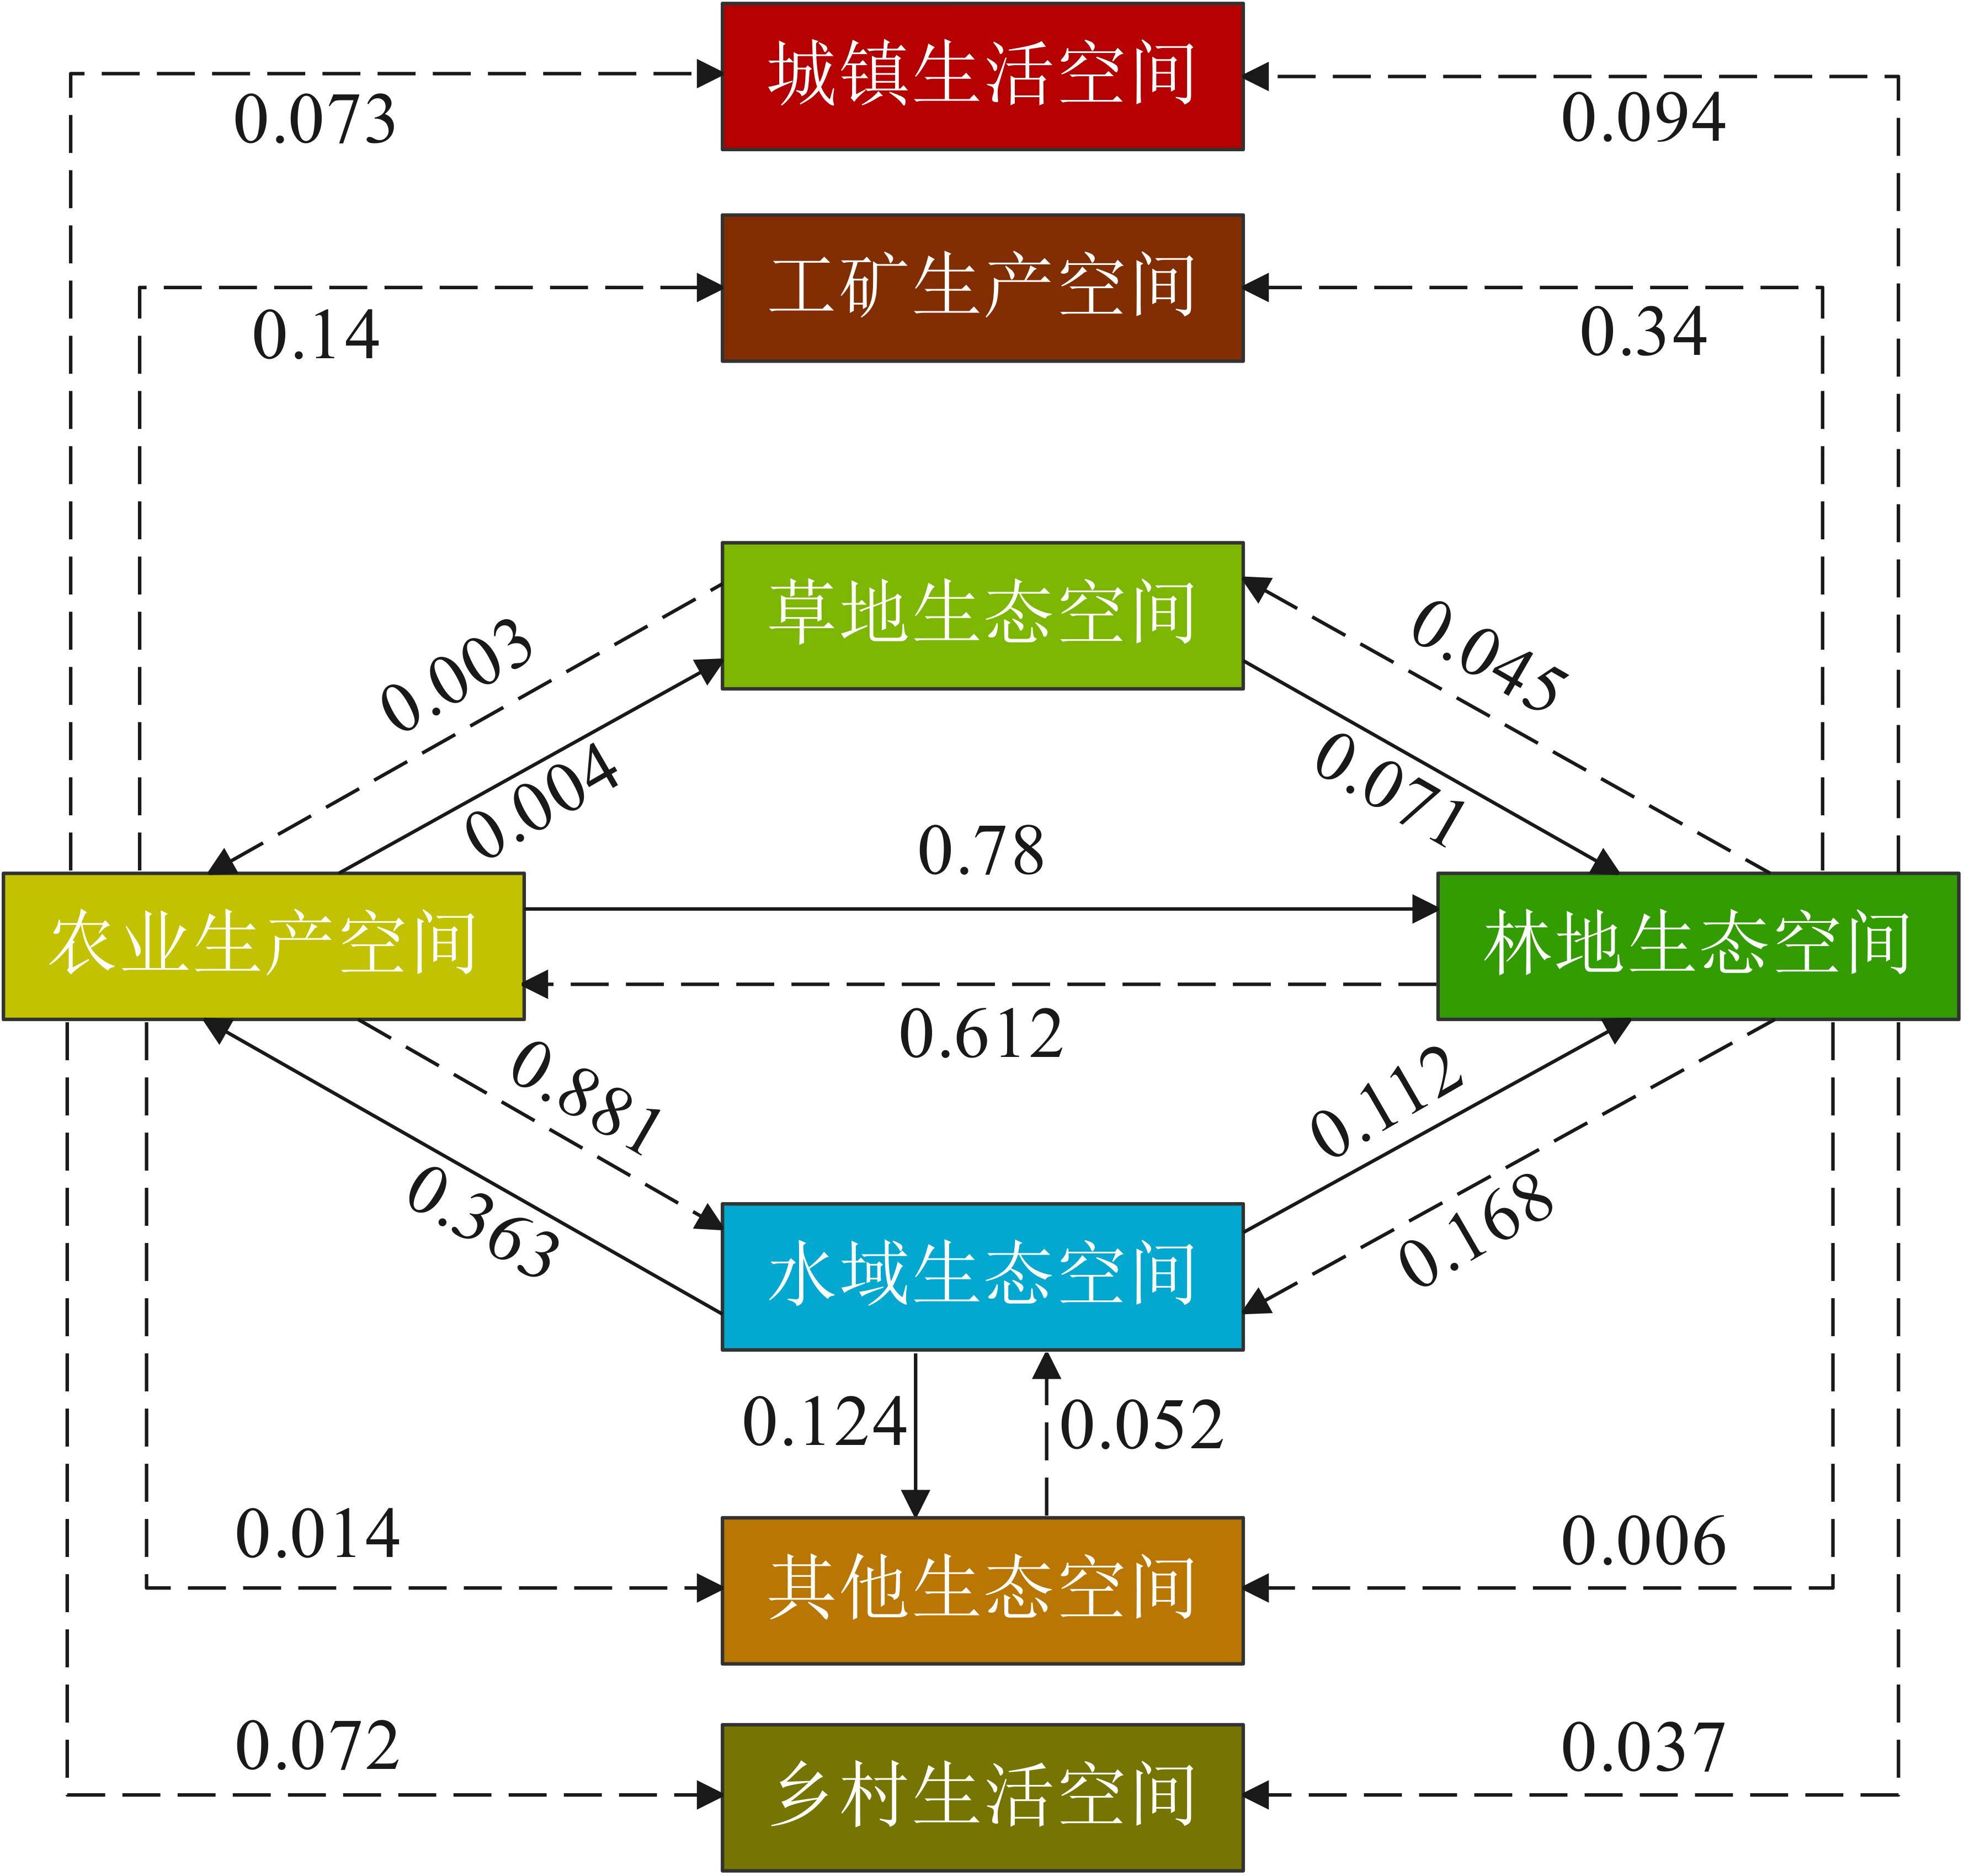
图8 国土空间格局演变的碳储量贡献率
Figure 8 Contribution rate of carbon storage to the evolution of territorial spacce pattern
| 年份 | 国土空间 利用强度指数 | 国土空间 利用强度变化 | 总碳储量/ 106t | 总碳储量 变化/106 t | p |
|---|---|---|---|---|---|
| 1990 | 249.38 | ‒ | 581 | ‒ | ‒ |
| 2000 | 249.31 | -0.07 | 580 | -1.20 | 17.1 |
| 2010 | 248.50 | -0.81 | 576 | -4.20 | 5.19 |
| 2020 | 247.85 | -0.65 | 573 | -3.18 | 4.89 |
表6 国土空间格局演变对碳储备能力的潜在影响
Table 6 Potential impacts of the evolution of territorial space pattern on carbon storage capacity
| 年份 | 国土空间 利用强度指数 | 国土空间 利用强度变化 | 总碳储量/ 106t | 总碳储量 变化/106 t | p |
|---|---|---|---|---|---|
| 1990 | 249.38 | ‒ | 581 | ‒ | ‒ |
| 2000 | 249.31 | -0.07 | 580 | -1.20 | 17.1 |
| 2010 | 248.50 | -0.81 | 576 | -4.20 | 5.19 |
| 2020 | 247.85 | -0.65 | 573 | -3.18 | 4.89 |
| 驱动因子 | 1990年 | 2000年 | 2010年 | 2020年 | 1990‒2020年 | |||||||||
|---|---|---|---|---|---|---|---|---|---|---|---|---|---|---|
| q值 | 排序 | q值 | 排序 | q值 | 排序 | q值 | 排序 | 平均q值 | 排序 | |||||
| 高程 (X1) | 0.542 | 2 | 0.543 | 2 | 0.547 | 2 | 0.549 | 2 | 0.545 | 2 | ||||
| 坡度 (X2) | 0.334 | 4 | 0.335 | 4 | 0.334 | 5 | 0.337 | 4 | 0.335 | 4 | ||||
| 地形起伏度 (X3) | 0.339 | 3 | 0.339 | 3 | 0.342 | 4 | 0.347 | 3 | 0.342 | 3 | ||||
| 年平均气温 (X4) | 0.228 | 7 | 0.326 | 5 | 0.347 | 3 | 0.309 | 6 | 0.302 | 5 | ||||
| 年平均降水 (X5) | 0.237 | 6 | 0.199 | 8 | 0.222 | 8 | 0.334 | 5 | 0.248 | 7 | ||||
| 归一化植被指数 (X6) | 0.113 | 9 | 0.322 | 6 | 0.186 | 9 | 0.285 | 7 | 0.226 | 8 | ||||
| 生境质量 (X7) | 0.755 | 1 | 0.755 | 1 | 0.690 | 1 | 0.690 | 1 | 0.723 | 1 | ||||
| 地均GDP (X8) | 0.278 | 5 | 0.269 | 7 | 0.267 | 6 | 0.261 | 8 | 0.269 | 6 | ||||
| 人口密度 (X9) | 0.219 | 8 | 0.176 | 9 | 0.226 | 7 | 0.233 | 9 | 0.214 | 9 | ||||
| 夜间灯光指数 (X10) | 0.012 | 10 | 0.015 | 10 | 0.017 | 10 | 0.020 | 10 | 0.016 | 10 | ||||
表7 碳储量空间分异驱动因子探测结果
Table 7 Detection results of spatial differentiation driving factors of carbon storage
| 驱动因子 | 1990年 | 2000年 | 2010年 | 2020年 | 1990‒2020年 | |||||||||
|---|---|---|---|---|---|---|---|---|---|---|---|---|---|---|
| q值 | 排序 | q值 | 排序 | q值 | 排序 | q值 | 排序 | 平均q值 | 排序 | |||||
| 高程 (X1) | 0.542 | 2 | 0.543 | 2 | 0.547 | 2 | 0.549 | 2 | 0.545 | 2 | ||||
| 坡度 (X2) | 0.334 | 4 | 0.335 | 4 | 0.334 | 5 | 0.337 | 4 | 0.335 | 4 | ||||
| 地形起伏度 (X3) | 0.339 | 3 | 0.339 | 3 | 0.342 | 4 | 0.347 | 3 | 0.342 | 3 | ||||
| 年平均气温 (X4) | 0.228 | 7 | 0.326 | 5 | 0.347 | 3 | 0.309 | 6 | 0.302 | 5 | ||||
| 年平均降水 (X5) | 0.237 | 6 | 0.199 | 8 | 0.222 | 8 | 0.334 | 5 | 0.248 | 7 | ||||
| 归一化植被指数 (X6) | 0.113 | 9 | 0.322 | 6 | 0.186 | 9 | 0.285 | 7 | 0.226 | 8 | ||||
| 生境质量 (X7) | 0.755 | 1 | 0.755 | 1 | 0.690 | 1 | 0.690 | 1 | 0.723 | 1 | ||||
| 地均GDP (X8) | 0.278 | 5 | 0.269 | 7 | 0.267 | 6 | 0.261 | 8 | 0.269 | 6 | ||||
| 人口密度 (X9) | 0.219 | 8 | 0.176 | 9 | 0.226 | 7 | 0.233 | 9 | 0.214 | 9 | ||||
| 夜间灯光指数 (X10) | 0.012 | 10 | 0.015 | 10 | 0.017 | 10 | 0.020 | 10 | 0.016 | 10 | ||||

图9 碳储量空间分异交互作用探测结果
Figure 9 Detection results of spatial differentiation and interaction of carbon storage
| [1] | ALAM S A, STARR M, CLARK B J F, 2013. Tree biomass and soil organic carbon densities across the Sudanese woodland savannah: A regional carbon sequestration study[J]. Journal of Arid Environments, 89: 67-76. |
| [2] | ANGEON V, BATES S, 2015. Reviewing composite vulnerability and resilience indexes: A sustainable approach and application[J]. World Development, 72: 140-162. |
| [3] | CHENG Q W, JIANG P H, CAI L Y, et al., 2017. Delineation of a permanent basic farmland protection area around a city centre: Case study of Changzhou City, China[J]. Land Use Policy, 60: 73-89. |
| [4] |
FU J Y, GAO Q, JIANG D, et al., 2023. Spatial-temporal distribution of global production-living-ecological space during the period 2000-2020[J]. Scientific Data, 10(1): 589.
DOI PMID |
| [5] | GIARDINA C P, RYAN M G, 2000. Evidence that decomposition rates of organic carbon in mineral soil do not vary with temperature[J]. Nature, 404(6780): 858-861. |
| [6] | LI H Z, FANG C Y, XIA Y, et al., 2022. Multi-Scenario Simulation of Production-Living-Ecological Space in the Poyang Lake Area Based on Remote Sensing and RF-Markov-FLUS Model[J]. Remote Sensing, 14(12): 2830. |
| [7] | LI W M, CAI Z Y, JIN L S, 2023. Spatiotemporal characteristics and influencing factors of the coupling coordinated development of production-living-ecology system in China[J]. Ecological Indicators, 145(4): 109738. |
| [8] | OUYANG X, XU J, LI J Y, et al., 2022. Land space optimization of urban-agriculture-ecological functions in the Changsha-Zhuzhou- Xiangtan Urban Agglomeration, China[J]. Land Use Policy, 117: 106112. |
| [9] | PENG H J, ZHANG X S, REN W, et al., 2023. Spatial pattern and driving factors of cropland ecosystem services in a major grain-producing region: A production-living-ecology perspective[J]. Ecological Indicators, 155: 111024. |
| [10] | PENG J, LIU Z C, LIU Y X, et al., 2015. Multifunctionality assessment of urban agriculture in Beijing City, China[J]. Science of The Total Environment, 537: 343-351. |
| [11] |
SCHRÖTER D, CRAMER W, LEEMANS R, et al., 2005. Ecosystem service supply and vulnerability to global change in Europe[J]. Science, 310(5752): 1333-1337.
PMID |
| [12] | SONG Y Z, WANG J F, GE Y, et al., 2020. An optimal parameters-based geographical detector model enhances geographic characteristics of explanatory variables for spatial heterogeneity analysis: Cases with different types of spatial data[J]. GIScience and Remote Sensing, 57(5): 593-610. |
| [13] | TAO J Y, LU Y Q, GE D Z, et al., 2022. The spatial pattern of agricultural ecosystem services from the production-living-ecology perspective: A case study of the Huaihai Economic Zone, China[J]. Land Use Policy, 122: 106355. |
| [14] | WANG D, FU J Y, XIE X L, et al., 2022. Spatiotemporal evolution of urban-agricultural-ecological space in China and its driving mechanism[J]. Journal of Cleaner Production, 371: 133684. |
| [15] | YU Z X, XU E Q, ZHANG H Q, et al., 2020. Spatio-Temporal Coordination and Conflict of Production-Living-Ecology Land Functions in the Beijing-Tianjin-Hebei Region, China[J]. Land, 9(5): 170. |
| [16] | ZHANG D C, LIU X P, LIN Z Y, et al., 2020. The delineation of urban growth boundaries in complex ecological environment areas by using cellular automata and a dual-environmental evaluation[J]. Journal of Cleaner Production, 256: 120361. |
| [17] | 陈大蓉, 周旭, 杨胜天, 等, 2023. 基于贵州省土地变化的碳储量演变及其脆弱性特征分析[J]. 水土保持通报, 43(3): 301-309. |
| CHEN D R, ZHOU X, YANG S T, et al., 2023. Analysis of carbon stock evolution and its vulnerability characteristics based on land use change in Guizhou Province[J]. Bulletin of Soil and Water Conservation, 43(3): 301-309. | |
| [18] | 陈光水, 杨玉盛, 谢锦升, 等, 2007. 中国森林的地下碳分配[J]. 生态学报, 27(12): 5148-5157. |
| CHEN G S, YANG Y S, XIE J S, et al., 2007. Total belowground carbon allocation in China's forests[J]. Acta Ecologica Sinica, 27(12): 5148-5157. | |
| [19] | 陈美景, 王庆日, 白中科, 等, 2021. 碳中和愿景下 “三生空间” 转型及其碳储量效应——以贵州省为例[J]. 中国土地科学, 35(11): 101-111. |
| CHEN M J, WANG Q R, BAI Z K, et al., 2021. Transition of “production-living-ecological” space and its carbon storage effect under the vision of carbon neutralization: A case study of Guizhou Province[J]. China Land Science, 35(11): 101-111. | |
| [20] |
崔红茶, 陈新, 陈辞, 等, 2023. 长江流域少数民族特色村寨空间异质性及形成机理[J]. 经济地理, 43(9): 160-171.
DOI |
| CUI H C, CHEN X, CHEN C, et al., 2023. Spatial heterogeneity and formation mechanism of Ethnic Groups' Villages in the Yangtze River Basin[J]. Economic Geography, 43(9): 160-171. | |
| [21] |
范清瑶, 夏卫生, 莫成鑫, 等, 2023. 基于 “三生空间” 的土地利用转型时空演变及其碳排放效应研究——以福建省为例[J]. 生态环境学报, 32(12): 2183-2193.
DOI |
| FAN Q Y, XIA W S, MO C X, et al., 2023. Study on transition of land use function and its carbon emission effect repose based on the conception of “production, living and ecological space”: A case study of Fujian Province[J]. Ecology and Environmental Sciences, 32(12): 2183-2193. | |
| [22] | 高星, 刘泽伟, 李晨曦, 等, 2020. 基于 “三生空间” 的雄安新区土地利用功能转型与生态环境效应研究[J]. 生态学报, 40(20): 7113-7122. |
| GAO X, LIU Z W, LI C X, et al., 2020. Land use function transformation in the Xiongan New Area based on “ecological-production-living spaces” and associated eco-environment effects[J]. Acta Ecologica Sinica, 40(20): 7113-7122. | |
| [23] | 郭云, 李鹏, 程维金, 等, 2022. 洞庭湖土地利用和生态服务功能时空变化及其耦合效应分析[J]. 环境科学学报, 42(1): 121-130. |
| GUO Y, LI P, CHENG W J, et al., 2022. Evaluation and complex relations analysis of ecosystem services based on spatial-temporal change of land use in Dongting Lake[J]. Acta Scientiae Circumstantiae, 42(1): 121-130. | |
| [24] | 何苏玲, 王金亮, 角媛梅, 等, 2022. 国土空间规划视角下资源环境承载力评价分析——以昆明市为例[J]. 中国农业资源与区划, 43(4): 119-128. |
| HE S L, WANG J L, JIAO Y M, et al., 2022. Resource and environmental carrying capacity evaluation analysis under the perspective of territory development planning: A case study of Kunming City[J]. Chinese Journal of Agricultural Resources and Regional Planning, 43(4): 119-128. | |
| [25] |
黄贤金, 陈逸, 赵雲泰, 等, 2021. 黄河流域国土空间开发格局优化研究——基于国土开发强度视角[J]. 地理研究, 40(6): 1554-1564.
DOI |
| HUANG X J, CHEN Y, ZHAO Y T, et al., 2021. Optimization on land spatial development pattern in the Yellow River Basin: From the perspective of land development intensity[J]. Geographical Research, 40(6): 1554-1564. | |
| [26] | 黄艳, 刘晓曼, 袁静芳, 等, 2024. 2000-2020年华北干旱半干旱区碳储量变化特征及影响因素[J]. 环境科学研究, 37(4): 849-861. |
| HUANG Y, LIU X M, YUAN J F, et al., 2024. Spatial and temporal changes of carbon storage and its influencing factors in Arid and Semi-Arid Region of North China from 2000 to 2020[J]. Research of Environmental Sciences, 37(4): 849-861. | |
| [27] | 冀新慧, 曹永强, 么嘉棋, 等, 2023. 海河流域土地利用与生态系统碳储量变化及预测[J]. 南水北调与水利科技(中英文), 21(5): 985-995. |
| JI X H, CAO Y Q, YAO J Q, et al., 2023. Land use and ecosystem carbon storage change and prediction in the Haihe River basin[J]. South-to-North Water Transfers and Water Science & Technology, 21(5): 985-995. | |
| [28] | 冀正欣, 刘超, 许月卿, 等, 2020. 基于土地利用功能测度的 “三生” 空间识别与优化调控[J]. 农业工程学报, 36(18): 222-231. |
| JI Z X, LIU C, XU Y Q, et al., 2020. Identification and optimal regulation of the “production-living-ecological” space based on quantitative land use functions[J]. Transactions of the Chinese Society of Agricultural Engineering, 36(18): 222-231. | |
| [29] | 柯新利, 唐兰萍, 2019. 城市扩张与耕地保护耦合对陆地生态系统碳储量的影响——以湖北省为例[J]. 生态学报, 39(2): 672-683. |
| KE X L, TANG L P, 2019. Impact of cascading processes of urban expansion and cropland reclamation on the ecosystem of a carbon storage service in Hubei Province, China[J]. Acta Ecologica Sinica, 39(2): 672-683. | |
| [30] |
孔冬艳, 陈会广, 吴孔森, 2021. 中国 “三生空间” 演变特征、生态环境效应及其影响因素[J]. 自然资源学报, 36(5): 1116-1135.
DOI |
| KONG D Y, CHEN H G, WU K S, 2021. The evolution of “production-living-ecological space”, eco‐environmental effects and its influencing factors in China[J]. Journal of Natural Resources, 36(5): 1116-1135. | |
| [31] |
匡文慧, 2019. 新时代国土空间格局变化和美丽愿景规划实施的若干问题探讨[J]. 资源科学, 41(1): 23-32.
DOI |
| KUANG W H, 2019. Issues regarding on spatial pattern change of national land space and its overall implementation on beautiful vision in new era[J]. Resources Science, 41(1): 23-32. | |
| [32] |
李广东, 方创琳, 2016. 城市生态-生产-生活空间功能定量识别与分析[J]. 地理学报, 71(1): 49-65.
DOI |
|
LI G D, FANG C L, 2016. Quantitative function identification and analysis of urban ecological-production-living spaces[J]. Acta Geographica Sinica, 71(1): 49-65.
DOI |
|
| [33] | 李妙宇, 上官周平, 邓蕾, 2021. 黄土高原地区生态系统碳储量空间分布及其影响因素[J]. 生态学报, 41(17): 6786-6799. |
| LI M Y, SHANGGUAN Z P, DENG L, 2021. Spatial distribution of carbon storages in the terrestrial ecosystems and its influencing factors on the Loess Plateau[J]. Acta Geographica Sinica, 41(17): 6786-6799. | |
| [34] |
林树高, 陆汝成, 叶宗达, 等, 2022. 广西国土空间格局演变特征与形成机理[J]. 地理科学, 42(11): 1963-1974.
DOI |
|
LIN S G, LU R C, YE Z D, et al., 2022. Evolution characteristics and formation mechanism of territorial space pattern in Guangxi Zhuang Autonomous Region[J]. Scientia Geographica Sinica, 42(11): 1963-1974.
DOI |
|
| [35] | 林树高, 诸培新, 陆汝成, 等, 2024. 长江经济带国土空间格局与功能演变的时空特征和响应过程[J]. 农业工程学报, 40(4): 304-316. |
| LIN S G, ZHU P X, LU R C, et al., 2024. Spatiotemporal characteristics and response process of the territorial space and functional evolution in the Yangtze River Economic Belt[J]. Transactions of the Chinese Society of Agricultural Engineering, 40(4): 304-316. | |
| [36] | 卢照地, 张正峰, 2022. 京津冀国土空间格局演变及其驱动因素的区域差异性研究[J]. 中国土地科学, 36(10): 42-52. |
| LU Z D, ZHANG Z F, 2022. Research on regional variability in the evolution of territorial space pattern and its driving factors in Beijing-Tianjin-Hebei Region[J]. China Land Science, 36(10): 42-52. | |
| [37] | 帕茹克·吾斯曼江, 艾东, 冀正欣, 等, 2024. 人地关系视角下北京市 “三生” 空间转型及其碳储量效应[J]. 中国环境科学, 44(5): 2786-2798. |
| PARUKE W S M J, AI D, JI Z X, et al., 2024. The spatial transition of “production-living-ecological” space in Beijing and its effect on carbon storage under the perspective of human-land relation[J]. China Environmental Science, 44(5): 2786-2798. | |
| [38] | 任付月, 王萍, 孙丕苓, 2023. “三区” 视角下山东省国土空间演变特征及均衡性研究[J]. 土壤通报, 54(2): 263-272. |
| REN F Y, WANG P, SUN P L, 2023. Spatial evolution characteristics and equilibrium of Shandong Province from the perspective of “Three Zones”[J]. Chinese Journal of Soil Science, 54(2): 263-272. | |
| [39] | 石晶, 石培基, 王梓洋, 2024. 基于PLUS-InVEST模型的酒泉市生态系统碳储量时空演变与预测[J]. 环境科学, 45(1): 300-313. |
| SHI J, SHI P J, WANG Z Y, 2024. Spatial-temporal evolution and prediction of carbon storage in Jiuquan City ecosystem based on PLUS-InVEST model[J]. Environmental Science, 45(1): 300-313. | |
| [40] | 宋复蓉, 曾向阳, 陈勇, 2024. 矿粮复合区 “三生” 空间冲突诊断及演化特征分析——以大冶市陈贵镇为例[J]. 水土保持研究, 31(2): 401-412. |
| SONG F R, ZENG X Y, CHEN Y, 2024. Diagnosis and optimization of “production-living-ecological” space conflict in the Mine-Grain Mixed Zone: An example of Chengui Town, Daye City[J]. Research of Soil and Water Conservation, 31(2): 401-412. | |
| [41] | 王丹阳, 陈逸, 黄贤金, 等, 2022. 基于空间冲突的区域国土空间优化研究——以江苏省为例[J]. 长江流域资源与环境, 31(4): 832-839. |
| WANG D Y, CHEN Y, HUANG X J, et al., 2022. Spatial optimization of regional territory based on spatial conflict: A case study of Jiangsu Province[J]. Resources and Environment in the Yangtze Basin, 31(4): 832-839. | |
| [42] |
王劲峰, 徐成东, 2017. 地理探测器:原理与展望[J]. 地理学报, 72(1): 116-134.
DOI |
|
WANG J F, XU C D, 2017. Geodetector: Principle and prospective[J]. Acta Geographica Sinica, 72(1): 116-134.
DOI |
|
| [43] | 王颖, 刘学良, 魏旭红, 等, 2018. 区域空间规划的方法和实践初探——从 “三生空间” 到 “三区三线”[J]. 城市规划学刊 (4): 65-74. |
| WANG Y, LIU X L, WEI X H, et al., 2018. The method and practice of regional spatial planning from “Three Basic Spaces” to “Three- zones and Three-lines”[J]. Urban Planning Forum (4): 65-74. | |
| [44] | 王志远, 万鼎, 廖建军, 等, 2023a. 洞庭湖生态经济区 “三生空间” 转型的生态环境效应及其驱动因素[J]. 科学技术与工程, 23(9): 3876-3888. |
| WANG Z Y, WAN D, LIAO J J, et al., 2023a. Ecological environment effect and driving factors of transformation of “production-living- ecological space” in Dongting Lake Eco-economic Zone[J]. Science Technology and Engineering, 23(9): 3876-3888. | |
| [45] | 王志远, 吴凡, 万鼎, 等, 2023b. 多情景模拟区域土地利用变化对碳储量的影响[J]. 中国环境科学, 43(11): 6063-6078. |
| WANG Z Y, WU F, WAN D, et al., 2023b. Multi-scenario simulation of the impact of regional land use change on carbon reserve[J]. China Environmental Science, 43(11): 6063-6078. | |
| [46] | 韦绍音, 陆汝成, 林晓楠, 等, 2021. 广西陆地边境带国土空间格局演化及机理研究[J]. 中国土地科学, 35(12): 98-108. |
| WEI S Y, LU R C, LIN X N, et al., 2021. Study on the evolution and mechanism of territorial space pattern of Land Border Area in Guangxi[J]. China Land Science, 35(12): 98-108. | |
| [47] | 韦绍音, 陆汝成, 张利国, 等, 2023. 碳中和目标下的广西边境地区 “三生” 空间转型及碳储量效应[J]. 水土保持通报, 43(1): 399-408. |
| WEI S Y, LU R C, ZHANG L G, et al., 2023. Transition of “production-living-ecological” space and carbon storage effect in Guangxi Border Area under carbon neutrality goal[J]. Bulletin of Soil and Water Conservation, 43(1): 399-408. | |
| [48] |
魏伟, 尹力, 谢波, 等, 2022. 国土空间规划背景下黄河流域 “三区空间” 演化特征及机制[J]. 经济地理, 42(3): 44-55.
DOI |
|
WEI W, YIN L, XIE B, et al., 2022. Spatial-temporal evolution characteristics and mechanism of “Three-function Space” in the Yellow River Basin under the background of territorial spatial planning[J]. Economic Geography, 42(3): 44-55.
DOI |
|
| [49] | 吴佩君, 刘小平, 黎夏, 等, 2016. 基于InVEST模型和元胞自动机的城市扩张对陆地生态系统碳储量影响评估——以广东省为例[J]. 地理与地理信息科学, 32(5): 22-28. |
| WU P J, LIU X P, LI X, et al., 2016. Impact of urban expansion on carbon storage in terrestrial ecosystems based on InVEST model and CA: A case study of Guangdong Province, China[J]. Geography and Geo-Information Science, 32(5): 22-28. | |
| [50] | 夏安全, 王艳芬, 郝彦宾, 等, 2020. 复杂地形草地植被碳储量遥感估算研究进展[J]. 生态学报, 37(0): 6338-6350. |
| XIA A Q, WANG Y F, HAO Y B, et al., 2020. Research progress on estimation of vegetation carbon storage of grasslands on complex terrain by remote sensing technology[J]. Acta Ecologica Sinica, 37(5): 6338-6350. | |
| [51] |
向书江, 张骞, 王丹, 等, 2022. 近20年重庆市主城区碳储量对土地利用/覆被变化的响应及脆弱性分析[J]. 自然资源学报, 37(5): 1198-1213.
DOI |
| XIANG S J, ZHANG Q, WANG D, et al., 2022. Response and vulnerability analysis of carbon storage to LUCC in the main urban area of Chongqing during 2000-2020[J]. Journal of Natural Resources, 37(5): 1198-1213. | |
| [52] | 徐丽, 何念鹏, 于贵瑞, 2019. 2010s中国陆地生态系统碳密度数据集[J]. 中国科学数据, 4(1): 86-92. |
| XU L, HE N P, YU G R, 2019. A dataset of carbon density in Chinese terrestrial ecosystems (2010s)[J]. China Scientific Data, 4(1): 86-92. | |
| [53] | 杨元合, 石岳, 孙文娟, 等, 2022. 中国及全球陆地生态系统碳源汇特征及其对碳中和的贡献[J]. 中国科学(生命科学), 52(4): 534-574. |
| YANG Y H, SHI Y, SUN W J, et al., 2022. Terrestrial carbon sinks in China and around the world and their contribution to carbon neutrality[J]. Science in China (Series C), 52(4): 534-574. | |
| [54] | 叶斌, 郑晓华, 罗海明, 等, 2024. “三区三线” 统筹划定: 现象剖析、技术逻辑与南京经验[J]. 城市规划学刊 (1): 54-62. |
| YE B, ZHENG X H, LUO H M, et al., 2024. Comprehensive demarcation of “Three Zones and Three Lines”: Phenomenon analysis, technical logic, and the Nanjing experience[J]. Urban Planning Forum (1): 54-62. | |
| [55] | 尹力, 魏伟, 薄立明, 等, 2024. 秦巴山区国土空间格局演变特征及驱动力分析[J]. 水土保持学报, 38(2): 278-293. |
| YIN L, WEI W, BO L M, et al., 2024. Analysis on the evolution characteristics and driving forces of territorial space pattern in the Qinling-Daba Mountain Area[J]. Journal of Soil and Water Conservation, 38(2): 278-293. | |
| [56] | 张德玉, 刘兆德, 于兰军, 等, 2024. 鲁南经济带国土空间格局演变特征与驱动力分析[J]. 资源开发与市场, 40(2): 182-193. |
| ZHANG D Y, LIU Z D, YU L J, et al., 2024. Analysis of the evolution characteristics and driving forces of the spatial pattern in the Lunan Economic Belt[J]. Resource Development & Market, 40(2): 182-193. | |
| [57] |
张雪飞, 王传胜, 李萌, 2019. 国土空间规划中生态空间和生态保护红线的划定[J]. 地理研究, 38(10): 2430-2446.
DOI |
| ZHANG X F, WANG C S, LI M, 2019. Demarcating ecological space and ecological protection red line under the framework of territory spatial planning[J]. Geographical Research, 38(10): 2430-2446. | |
| [58] |
周侃, 樊杰, 盛科荣, 2019. 国土空间管控的方法与途径[J]. 地理研究, 38(10): 2527-2540.
DOI |
| ZHOU K, FAN J, SHENG K R, 2019. Research on methods and approaches of spatial governances[J]. Geographical Research, 38(10): 2527-2540. | |
| [59] | 周鹏, 邓伟, 张少尧, 等, 2020. 太行山区国土空间格局演变特征及其驱动力[J]. 山地学报, 38(2): 276-289. |
| ZHOU P, DENG W, ZHANG S Y, et al., 2020. Evolution characteristics and its driving force of territory space pattern in the Taihang Mountain, China[J]. Mountain Research, 38(2): 276-289. | |
| [60] | 周文强, 韩宇, 王金龙, 等, 2024. 洞庭湖流域碳储量的时空异质性及驱动力分析[J]. 中国环境科学, 44(4): 1851-1862. |
| ZHOU W Q, HAN Y, WANG J L, et al., 2024. Spatiotemporal heterogeneity and driving forces of carbon storage in the Dongting Lake Basin[J]. China Environmental Science, 44(4): 1851-1862. | |
| [61] | 庄大方, 刘纪远, 1997. 中国土地利用程度的区域分异模型研究[J]. 自然资源学报, 12(2): 105-111. |
| ZHUANG D F, LIU J Y, 1997. Study on the model of regional differentiation of land use degree in China[J]. Journal of Natural Resources, 12(2): 105-111. | |
| [62] | 邹汉邦, 陈文波, 黄细华, 等, 2021. “三区” 视角下滨湖县国土空间用途管制格局耦合协调性与机制分析[J]. 江西农业大学学报, 43(6): 1452-1462. |
| ZOU H B, CHEN W B, HUANG X H, et al., 2021. Coupling coordination and mechanism analysis of space control pattern of Lakeside County from the perspective of “Three Zones”[J]. Acta Agriculturae Universitatis Jiangxiensis, 43(6): 1452-1462. |
| [1] | 张舒涵, 姜海玲, 于海淋, 冯馨慧. 沈阳现代化都市圈景观生态风险时空演变及驱动力分析[J]. 生态环境学报, 2024, 33(9): 1471-1481. |
| [2] | 王美娜, 范顺祥, 舒翰俊, 张建杰, 褚力其, 法玉琦. 河南省土壤侵蚀时空分异特征及土壤保持经济价值[J]. 生态环境学报, 2024, 33(5): 730-744. |
| [3] | 程鹏, 孙明东, 宋晓伟. 中国灰水足迹时空动态演进及驱动因素研究[J]. 生态环境学报, 2024, 33(5): 745-756. |
| [4] | 李荣杰, 李惠梅, 武非非, 赵明德, 王诗涵, 孙雪颖. 青海湖流域生态系统服务空间分异规律及驱动力研究[J]. 生态环境学报, 2024, 33(2): 301-309. |
| [5] | 田嘉莉, 毛靖宇, 彭甲超, 姚婷婷, 付书科. 重污染企业减污降碳协同效应时空分异特征及其驱动因素分析——来自A股100家企业的证据[J]. 生态环境学报, 2024, 33(11): 1661-1671. |
| [6] | 李辉蔷, 梁小英, 魏峥, 朱泳霏, 石金鑫. 基于logistic回归模型的生态系统服务簇变化驱动力分析——以关天经济区为例[J]. 生态环境学报, 2024, 33(11): 1803-1815. |
| [7] | 高文明, 宋芊, 张皓翔, 王士如. 三江源区生态脆弱性时空演变及驱动因素分析[J]. 生态环境学报, 2024, 33(10): 1648-1660. |
| [8] | 郑秋萍, 李菲, 赵芮, 蒋冬升, 王宏. 福建省PM2.5-O3双高特征与天气形势影响分析[J]. 生态环境学报, 2023, 32(8): 1440-1448. |
| [9] | 王嘉丽, 冯婧珂, 杨元征, 俎佳星, 蔡文华, 杨健. 南宁市主城区不透水面与热环境效应的空间关系研究[J]. 生态环境学报, 2023, 32(3): 525-534. |
| [10] | 雷金睿, 陈宗铸, 陈毅青, 陈小花, 李苑菱, 吴庭天. 1990—2018年海南岛湿地景观生态安全格局演变[J]. 生态环境学报, 2020, 29(2): 293-302. |
| 阅读次数 | ||||||
|
全文 |
|
|||||
|
摘要 |
|
|||||