生态环境学报 ›› 2021, Vol. 30 ›› Issue (7): 1522-1531.DOI: 10.16258/j.cnki.1674-5906.2021.07.021
刘强1,2( ), 杨众养3,4, 陈毅青3,4,*(), 雷金睿3,4, 陈宗铸3,4, 陈小花3,4
收稿日期:2021-02-24
出版日期:2021-07-18
发布日期:2021-10-09
通讯作者:
*陈毅青(1975年生),男,高级工程师,硕士,研究方向为森林生态。E-mail: 13876350188@126.com作者简介:刘强(1969年生),男,高级工程师,研究方向为森林生态与资源监测管理。E-mail: 2568060444@qq.com
基金资助:
LIU Qiang1,2(), YANG Zhongyang3,4, CHEN Yiqing3,4,*(), LEI Jinrui3,4, CHEN Zongzhu3,4, CHEN Xiaohua3,4
Received:2021-02-24
Online:2021-07-18
Published:2021-10-09
摘要:
以海南岛为研究区域,基于2010年和2020年两期土地利用数据,利用 CA-Markov模型预测了3种模拟情景下2030年和2040年土地利用空间分布格局,定量分析了海南岛2010—2040年土地利用变化及其生态环境效应。结果表明,(1)2010—2020年间,海南岛土地利用类型以林地为主,面积占比达62%以上,其次耕地。该时期土地利用类型转移的主要特征是林地、耕地、水域转为建设用地,建设用地面积增加483.55 km2,增长率高达53.27%。(2)利用CA-Markov模型模拟3种情景下海南岛2030年和2040年的建设用地均呈现较大幅度的增长,其中耕地保护情景模拟下的耕地面积最多,生态保护情景模拟下的林地和水域面积有所增加。(3)海南岛生态环境质量呈现出中部高、四周低的阶梯式空间分布格局,2010—2040年间海南岛生态环境质量逐期降低,由2010年的0.6064下降至2040年的0.5878。在3种模拟情景中,生态保护情景下的海南岛生态环境质量最高,其次是耕地保护情景,基准情景最差。(4)2010—2040年间,林地转为建设用地是导致海南岛生态环境质量恶化的主要类型和主导因素,耕地转为林地则是致使未来生态环境质量改善的主要土地利用变化类型,生态贡献率超过70%。总体而言,海南岛生态环境质量恶化的趋势大于生态环境质量改善的趋势。
中图分类号:
刘强, 杨众养, 陈毅青, 雷金睿, 陈宗铸, 陈小花. 基于CA-Markov多情景模拟的海南岛土地利用变化及其生态环境效应[J]. 生态环境学报, 2021, 30(7): 1522-1531.
LIU Qiang, YANG Zhongyang, CHEN Yiqing, LEI Jinrui, CHEN Zongzhu, CHEN Xiaohua. Multi-scenario Simulation of Land Use Change and Its Eco-environmental Effect in Hainan Island Based on CA-Markov Model[J]. Ecology and Environment, 2021, 30(7): 1522-1531.
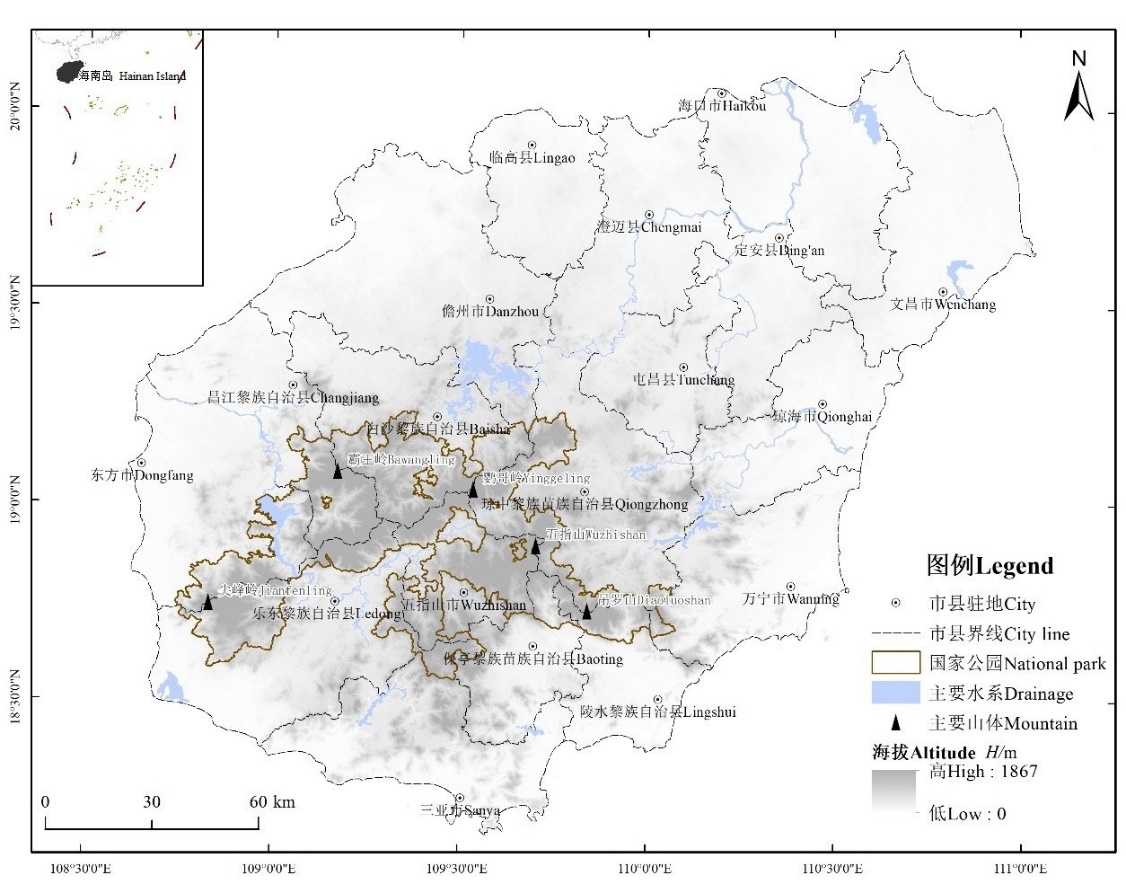
图1 研究区位置
Fig. 1 The location of the research area
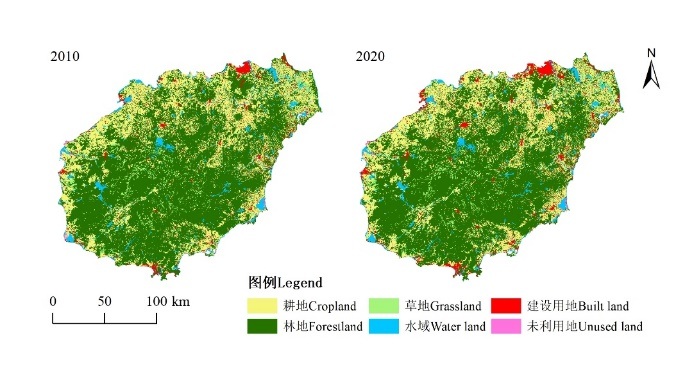
图2 2010年和2020年海南岛土地利用现状
Fig. 2 Current situation of land use in Hainan Island in 2010 and 2020
| 一级类型 First class | 生态环境 质量指数 Eco-environmental quality values | 二级类型 Second class | 生态环境 质量指数 Eco-environmental quality values |
|---|---|---|---|
| 耕地 Cropland | 0.27 | 水田 Paddy field | 0.30 |
| 旱地 Dry land | 0.25 | ||
| 林地 Forestland | 0.76 | 有林地 Forest land | 0.95 |
| 灌木林 Shrubbery | 0.65 | ||
| 疏林地 Open forest land | 0.45 | ||
| 其它林地Other forest land | 0.40 | ||
| 草地 Grassland | 0.70 | 高覆盖度草地 High coverage grassland | 0.75 |
| 中覆盖度草地 Medium coverage grassland | 0.45 | ||
| 低覆盖度草地 Low coverage grassland | 0.20 | ||
| 水域 Water land | 0.54 | 河渠 Canal | 0.55 |
| 水库坑塘 Reservoir | 0.55 | ||
| 滩涂 Mudflat | 0.45 | ||
| 滩地 Beach land | 0.55 | ||
| 建设用地 Built land | 0.18 | 城镇建设用地 Urban construction land | 0.20 |
| 农村居民点 Rural residential area | 0.20 | ||
| 其它建设用地 Other construction land | 0.15 | ||
| 未利用地Unused land | 0.11 | 沙地 Sandy land | 0.01 |
| 沼泽地 Swamp land | 0.65 |
表1 土地利用分类及其生态环境质量指数
Table 1 Land use classification and eco-environmental quality values of different land-use types
| 一级类型 First class | 生态环境 质量指数 Eco-environmental quality values | 二级类型 Second class | 生态环境 质量指数 Eco-environmental quality values |
|---|---|---|---|
| 耕地 Cropland | 0.27 | 水田 Paddy field | 0.30 |
| 旱地 Dry land | 0.25 | ||
| 林地 Forestland | 0.76 | 有林地 Forest land | 0.95 |
| 灌木林 Shrubbery | 0.65 | ||
| 疏林地 Open forest land | 0.45 | ||
| 其它林地Other forest land | 0.40 | ||
| 草地 Grassland | 0.70 | 高覆盖度草地 High coverage grassland | 0.75 |
| 中覆盖度草地 Medium coverage grassland | 0.45 | ||
| 低覆盖度草地 Low coverage grassland | 0.20 | ||
| 水域 Water land | 0.54 | 河渠 Canal | 0.55 |
| 水库坑塘 Reservoir | 0.55 | ||
| 滩涂 Mudflat | 0.45 | ||
| 滩地 Beach land | 0.55 | ||
| 建设用地 Built land | 0.18 | 城镇建设用地 Urban construction land | 0.20 |
| 农村居民点 Rural residential area | 0.20 | ||
| 其它建设用地 Other construction land | 0.15 | ||
| 未利用地Unused land | 0.11 | 沙地 Sandy land | 0.01 |
| 沼泽地 Swamp land | 0.65 |
| 土地利用类型 Land use types | 耕地 Cropland | 林地 Forestland | 草地 Grassland | 水域 Water land | 建设用地 Built land | 未利用地 Unused land | |
|---|---|---|---|---|---|---|---|
| 2010年 | 面积 Area/ km2 | 8891.93 | 21742.29 | 1135.91 | 1507.49 | 907.81 | 93.54 |
| 比例 Proportion/% | 25.94 | 63.43 | 3.31 | 4.40 | 2.65 | 0.27 | |
| 2020年 | 面积 Area/ km2 | 8701.35 | 21465.89 | 1155.04 | 1476.57 | 1391.35 | 89.45 |
| 比例 Proportion/% | 25.38 | 62.62 | 3.37 | 4.31 | 4.06 | 0.26 | |
| 2010—2020年面积变化量 Area change from 2010 to 2020/km2 | -190.58 | -276.40 | 19.14 | -30.92 | 483.55 | -4.09 | |
| 2010—2020年面积变化率 Rate of area change from 2010 to 2020/% | -2.14 | -1.27 | 1.68 | -2.05 | 53.27 | -4.38 | |
表2 2010—2020年海南岛土地利用类型变化
Table 2 Changes of different land use types in Hainan Island from 2010 to 2020
| 土地利用类型 Land use types | 耕地 Cropland | 林地 Forestland | 草地 Grassland | 水域 Water land | 建设用地 Built land | 未利用地 Unused land | |
|---|---|---|---|---|---|---|---|
| 2010年 | 面积 Area/ km2 | 8891.93 | 21742.29 | 1135.91 | 1507.49 | 907.81 | 93.54 |
| 比例 Proportion/% | 25.94 | 63.43 | 3.31 | 4.40 | 2.65 | 0.27 | |
| 2020年 | 面积 Area/ km2 | 8701.35 | 21465.89 | 1155.04 | 1476.57 | 1391.35 | 89.45 |
| 比例 Proportion/% | 25.38 | 62.62 | 3.37 | 4.31 | 4.06 | 0.26 | |
| 2010—2020年面积变化量 Area change from 2010 to 2020/km2 | -190.58 | -276.40 | 19.14 | -30.92 | 483.55 | -4.09 | |
| 2010—2020年面积变化率 Rate of area change from 2010 to 2020/% | -2.14 | -1.27 | 1.68 | -2.05 | 53.27 | -4.38 | |
| 2010 | 2020 | |||||
|---|---|---|---|---|---|---|
| 耕地 Cropland | 林地 Forestland | 草地 Grassland | 水域 Water land | 建设用地 Built land | 未利用地 Unused land | |
| 耕地 Cropland | 8643.83 | 3.82 | 3.89 | 24.16 | 214.82 | 1.40 |
| 林地 Forestland | 17.08 | 21451.98 | 12.01 | 24.99 | 232.03 | 3.77 |
| 草地 Grassland | 0.39 | 0.26 | 1111.12 | 6.69 | 17.38 | 0.00 |
| 水域 Water land | 28.57 | 2.52 | 4.40 | 1417.15 | 41.62 | 4.58 |
| 建设用地 Built land | 11.43 | 6.11 | 14.74 | 2.87 | 872.16 | 0.00 |
| 未利用地 Unused land | 0.00 | 0.33 | 8.77 | 0.18 | 4.55 | 79.70 |
表3 2010—2020年海南岛土地利用转移矩阵
Table 3 Conversion of different land use types in Hainan Island from 2010 to 2020 km2
| 2010 | 2020 | |||||
|---|---|---|---|---|---|---|
| 耕地 Cropland | 林地 Forestland | 草地 Grassland | 水域 Water land | 建设用地 Built land | 未利用地 Unused land | |
| 耕地 Cropland | 8643.83 | 3.82 | 3.89 | 24.16 | 214.82 | 1.40 |
| 林地 Forestland | 17.08 | 21451.98 | 12.01 | 24.99 | 232.03 | 3.77 |
| 草地 Grassland | 0.39 | 0.26 | 1111.12 | 6.69 | 17.38 | 0.00 |
| 水域 Water land | 28.57 | 2.52 | 4.40 | 1417.15 | 41.62 | 4.58 |
| 建设用地 Built land | 11.43 | 6.11 | 14.74 | 2.87 | 872.16 | 0.00 |
| 未利用地 Unused land | 0.00 | 0.33 | 8.77 | 0.18 | 4.55 | 79.70 |
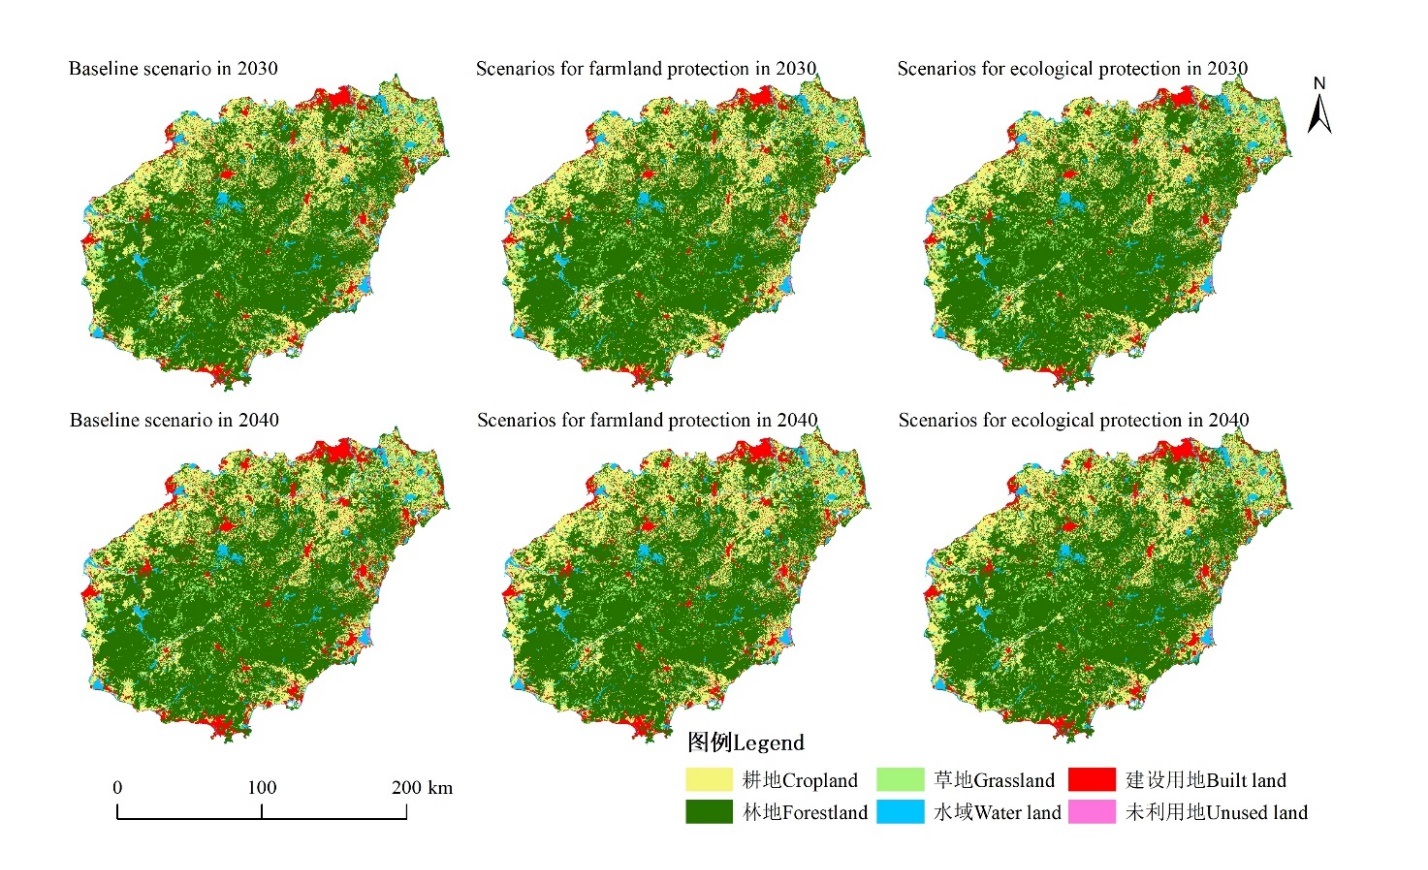
图3 2030年和2040年海南岛土地利用变化多情景模拟
Fig. 3 Multi-scenario simulation of land use change in Hainan Island in 2030 and 2040
| 模拟情景 Scene simulation | 耕地 Cropland | 林地 Forestland | 草地 Grassland | 水域 Water land | 建设用地 Built land | 未利用地 Unused land |
|---|---|---|---|---|---|---|
| 2030年基准情景 Baseline scenario in 2030 | 8510.53 | 21188.63 | 1172.72 | 1449.80 | 1849.70 | 85.38 |
| 2030年耕地保护情景 Scenarios for farmland protection in 2030 | 8731.80 | 21186.66 | 1169.16 | 1432.34 | 1652.67 | 84.13 |
| 2030年生态保护情景 Scenarios for ecological protection in 2030 | 8469.63 | 21447.53 | 1158.57 | 1486.66 | 1616.77 | 77.62 |
| 2040年基准情景 Baseline scenario in 2040 | 8258.93 | 20719.62 | 1191.32 | 1437.10 | 2563.24 | 86.57 |
| 2040年耕地保护情景 Scenarios for farmland protection in 2040 | 8549.66 | 20714.36 | 1184.38 | 1432.32 | 2291.39 | 84.67 |
| 2040年生态保护情景 Scenarios for ecological protection in 2040 | 8219.46 | 21191.45 | 1162.59 | 1459.46 | 2148.71 | 75.11 |
表4 多情景模拟下的海南岛土地利用面积统计
Table 4 Statistics of land use area of Hainan Island under multi-scenario simulation km2
| 模拟情景 Scene simulation | 耕地 Cropland | 林地 Forestland | 草地 Grassland | 水域 Water land | 建设用地 Built land | 未利用地 Unused land |
|---|---|---|---|---|---|---|
| 2030年基准情景 Baseline scenario in 2030 | 8510.53 | 21188.63 | 1172.72 | 1449.80 | 1849.70 | 85.38 |
| 2030年耕地保护情景 Scenarios for farmland protection in 2030 | 8731.80 | 21186.66 | 1169.16 | 1432.34 | 1652.67 | 84.13 |
| 2030年生态保护情景 Scenarios for ecological protection in 2030 | 8469.63 | 21447.53 | 1158.57 | 1486.66 | 1616.77 | 77.62 |
| 2040年基准情景 Baseline scenario in 2040 | 8258.93 | 20719.62 | 1191.32 | 1437.10 | 2563.24 | 86.57 |
| 2040年耕地保护情景 Scenarios for farmland protection in 2040 | 8549.66 | 20714.36 | 1184.38 | 1432.32 | 2291.39 | 84.67 |
| 2040年生态保护情景 Scenarios for ecological protection in 2040 | 8219.46 | 21191.45 | 1162.59 | 1459.46 | 2148.71 | 75.11 |
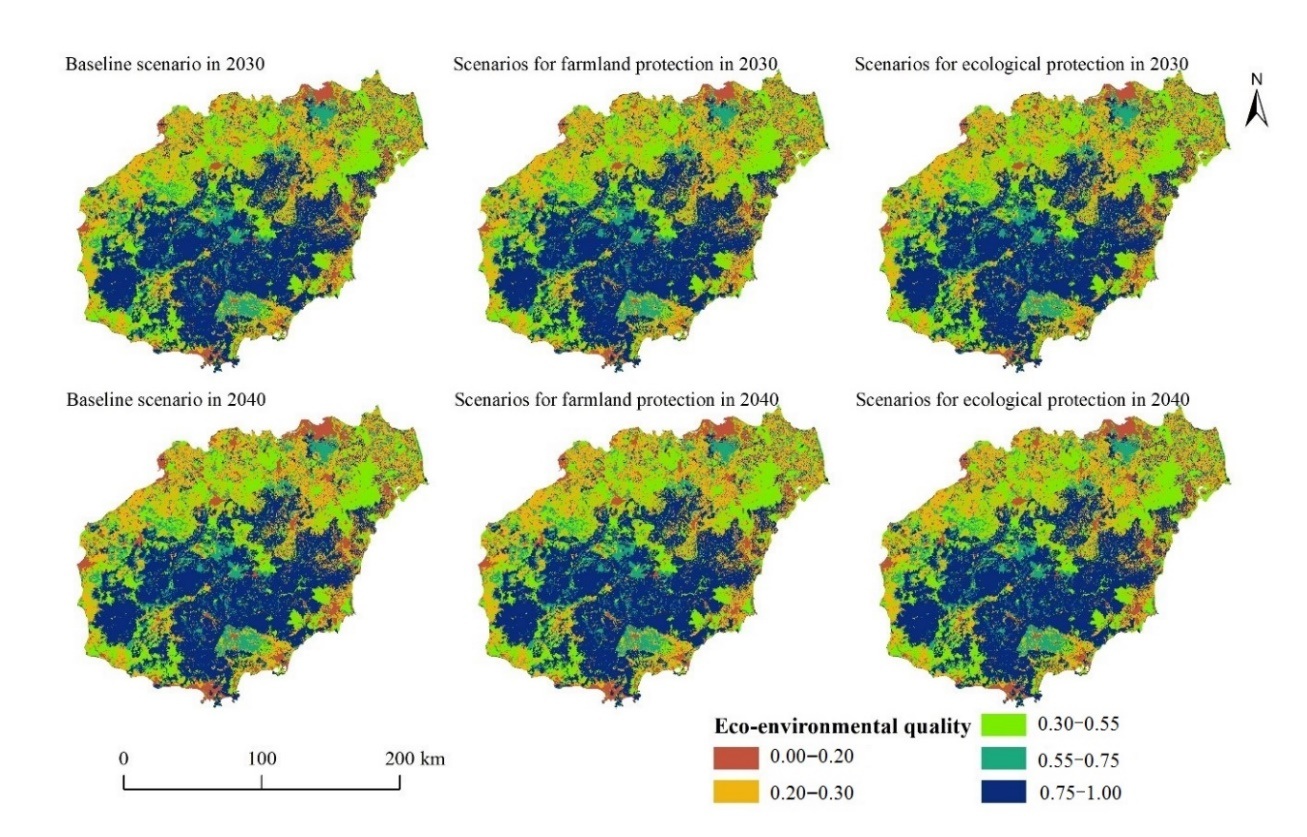
图4 多情景模拟的2030年和2040年海南岛土地利用变化生态环境质量空间分布
Fig. 4 Spatial distribution of eco-environmental quality of land use change in Hainan Island in 2030 and 2040 by multi-scenario simulation
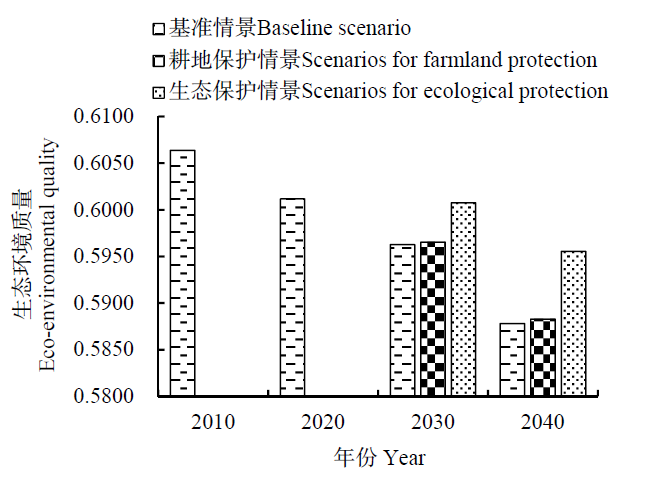
图5 不同时期海南岛土地利用变化生态环境质量
Fig. 5 Eco-environmental quality of land use change in Hainan Island in different periods
| 等级 Level | 取值范围 Value range | 2010 | 2020 | 2030 | 2040 | |||||
|---|---|---|---|---|---|---|---|---|---|---|
| 基准情景 Baseline scenario | 耕地保护情景 Scenarios for farmland protection | 生态保护情景Scenarios for ecological protection | 基准情景 Baseline scenario | 耕地保护情景Scenarios for farmland protection | 生态保护情景 Scenarios for ecological protection | |||||
| Ⅰ | 0.00‒0.20 | 2.95 | 4.32 | 5.63 | 5.05 | 4.94 | 7.69 | 6.89 | 6.46 | |
| Ⅱ | 0.20‒0.30 | 25.94 | 25.38 | 24.84 | 25.49 | 24.72 | 24.11 | 24.96 | 23.99 | |
| Ⅲ | 0.30‒0.55 | 22.70 | 22.30 | 21.92 | 21.86 | 22.34 | 21.44 | 21.41 | 21.95 | |
| Ⅳ | 0.55‒0.75 | 10.01 | 9.95 | 9.88 | 9.87 | 9.96 | 9.76 | 9.74 | 9.87 | |
| Ⅴ | 0.75‒1.00 | 38.40 | 38.05 | 37.72 | 37.72 | 38.03 | 37.01 | 37.01 | 37.72 | |
表5 不同时期海南岛土地利用变化生态环境质量等级面积比例
Table 5 Area proportion of eco-environmental quality grade of land use change in Hainan Island in different periods %
| 等级 Level | 取值范围 Value range | 2010 | 2020 | 2030 | 2040 | |||||
|---|---|---|---|---|---|---|---|---|---|---|
| 基准情景 Baseline scenario | 耕地保护情景 Scenarios for farmland protection | 生态保护情景Scenarios for ecological protection | 基准情景 Baseline scenario | 耕地保护情景Scenarios for farmland protection | 生态保护情景 Scenarios for ecological protection | |||||
| Ⅰ | 0.00‒0.20 | 2.95 | 4.32 | 5.63 | 5.05 | 4.94 | 7.69 | 6.89 | 6.46 | |
| Ⅱ | 0.20‒0.30 | 25.94 | 25.38 | 24.84 | 25.49 | 24.72 | 24.11 | 24.96 | 23.99 | |
| Ⅲ | 0.30‒0.55 | 22.70 | 22.30 | 21.92 | 21.86 | 22.34 | 21.44 | 21.41 | 21.95 | |
| Ⅳ | 0.55‒0.75 | 10.01 | 9.95 | 9.88 | 9.87 | 9.96 | 9.76 | 9.74 | 9.87 | |
| Ⅴ | 0.75‒1.00 | 38.40 | 38.05 | 37.72 | 37.72 | 38.03 | 37.01 | 37.01 | 37.72 | |
| 变化期 Changing period | 致生态环境质量改善 Improved eco-environmental quality | 致生态环境质量恶化 Deteriorated eco-environmental quality | |||||
|---|---|---|---|---|---|---|---|
| 主要土地利用变化类型 Major land use transformation types | 生态贡献率 Ecological contribution rate | 占贡献率的百分比Proportion/% | 主要土地利用变化类型 Major land use transformation types | 生态贡献率 Ecological contribution rate | 占贡献率的百分比Proportion/% | ||
| 2010—2020 | 建设用地-草地 Built land-Grassland | 0.000222 | 25.08 | 林地-建设用地 Forestland-Built land | 0.003943 | 65.64 | |
| 耕地-水域 Cropland-Water land | 0.000190 | 21.39 | 耕地-建设用地 Cropland-Built land | 0.000537 | 8.94 | ||
| 未利用地-草地 Unused land-Grassland | 0.000152 | 17.11 | 水域-建设用地 Water land-Built land | 0.000431 | 7.17 | ||
| 建设用地-林地 Built land-Forestland | 0.000104 | 11.70 | 草地-建设用地 Grassland-Built land | 0.000262 | 4.37 | ||
| 耕地-林地 Cropland-Forestland | 0.000055 | 6.24 | 林地-耕地 Forestland-Cropland | 0.000248 | 4.12 | ||
| 总计 Total | 0.000723 | 81.52 | 0.005421 | 90.24 | |||
| 2020—2040年 基准情景 Baseline scenario in 2020‒2040 | 耕地-林地 Cropland-Forestland | 0.002279 | 70.71 | 林地-建设用地 Forestland-Built land | 0.010341 | 61.44 | |
| 未利用地-草地 Unused land-Grassland | 0.000253 | 7.85 | 林地-耕地 Forestland-Cropland | 0.002819 | 16.75 | ||
| 耕地-草地 Cropland-Grassland | 0.000217 | 6.73 | 耕地-建设用地 Cropland-Built land | 0.001215 | 7.22 | ||
| 水域-林地 Water land-Forestland | 0.000120 | 3.71 | 水域-建设用地 Water land-Built land | 0.000809 | 4.81 | ||
| 耕地-水域 Cropland-Water land | 0.000110 | 3.42 | 林地-水域 Forestland-Water land | 0.000500 | 2.97 | ||
| 总计 Total | 0.002979 | 92.42 | 0.015684 | 93.19 | |||
| 2020—2040年耕地 保护情景 Scenarios for farmland protection in 2020‒2040 | 耕地-林地 Cropland-Forestland | 0.002239 | 72.53 | 林地-建设用地 Forestland-Built land | 0.010282 | 63.43 | |
| 未利用地-草地 Unused land-Grassland | 0.000253 | 8.20 | 林地-耕地 Forestland-Cropland | 0.002906 | 17.93 | ||
| 耕地-草地 Cropland-Grassland | 0.000140 | 4.53 | 水域-建设用地 Water land-Built land | 0.000804 | 4.96 | ||
| 水域-林地 Water land-Forestland | 0.000119 | 3.87 | 耕地-建设用地 Cropland-Built land | 0.000548 | 3.38 | ||
| 耕地-水域 Cropland-Water land | 0.000090 | 2.92 | 林地-水域 Forestland-Water land | 0.000499 | 3.08 | ||
| 总计Total | 0.002841 | 92.05 | 0.015039 | 92.79 | |||
| 2020—2040年生态 保护情景 Scenarios for ecological protection in 2020‒2040 | 耕地-林地 Cropland-Forestland | 0.002426 | 70.76 | 林地-建设用地 Forestland-Built land | 0.004024 | 43.30 | |
| 未利用地-草地 Unused land-Grassland | 0.000264 | 7.71 | 林地-耕地 Forestland-Cropland | 0.002512 | 27.03 | ||
| 耕地-草地 Cropland-Grassland | 0.000216 | 6.30 | 耕地-建设用地 Cropland-Built land | 0.001207 | 12.99 | ||
| 水域-林地 Water land-Forestland | 0.000128 | 3.74 | 水域-建设用地 Water land-Built land | 0.000413 | 4.45 | ||
| 耕地-水域 Cropland-Water land | 0.000125 | 3.64 | 草地-建设用地 Grassland-Built land | 0.000400 | 4.31 | ||
| 总计Total | 0.003159 | 92.15 | 0.008557 | 92.07 | |||
表6 影响生态环境质量的主要土地利用变化类型及生态贡献率
Table 6 Major land use change types and ecological contribution rates influencing eco-environmental quality
| 变化期 Changing period | 致生态环境质量改善 Improved eco-environmental quality | 致生态环境质量恶化 Deteriorated eco-environmental quality | |||||
|---|---|---|---|---|---|---|---|
| 主要土地利用变化类型 Major land use transformation types | 生态贡献率 Ecological contribution rate | 占贡献率的百分比Proportion/% | 主要土地利用变化类型 Major land use transformation types | 生态贡献率 Ecological contribution rate | 占贡献率的百分比Proportion/% | ||
| 2010—2020 | 建设用地-草地 Built land-Grassland | 0.000222 | 25.08 | 林地-建设用地 Forestland-Built land | 0.003943 | 65.64 | |
| 耕地-水域 Cropland-Water land | 0.000190 | 21.39 | 耕地-建设用地 Cropland-Built land | 0.000537 | 8.94 | ||
| 未利用地-草地 Unused land-Grassland | 0.000152 | 17.11 | 水域-建设用地 Water land-Built land | 0.000431 | 7.17 | ||
| 建设用地-林地 Built land-Forestland | 0.000104 | 11.70 | 草地-建设用地 Grassland-Built land | 0.000262 | 4.37 | ||
| 耕地-林地 Cropland-Forestland | 0.000055 | 6.24 | 林地-耕地 Forestland-Cropland | 0.000248 | 4.12 | ||
| 总计 Total | 0.000723 | 81.52 | 0.005421 | 90.24 | |||
| 2020—2040年 基准情景 Baseline scenario in 2020‒2040 | 耕地-林地 Cropland-Forestland | 0.002279 | 70.71 | 林地-建设用地 Forestland-Built land | 0.010341 | 61.44 | |
| 未利用地-草地 Unused land-Grassland | 0.000253 | 7.85 | 林地-耕地 Forestland-Cropland | 0.002819 | 16.75 | ||
| 耕地-草地 Cropland-Grassland | 0.000217 | 6.73 | 耕地-建设用地 Cropland-Built land | 0.001215 | 7.22 | ||
| 水域-林地 Water land-Forestland | 0.000120 | 3.71 | 水域-建设用地 Water land-Built land | 0.000809 | 4.81 | ||
| 耕地-水域 Cropland-Water land | 0.000110 | 3.42 | 林地-水域 Forestland-Water land | 0.000500 | 2.97 | ||
| 总计 Total | 0.002979 | 92.42 | 0.015684 | 93.19 | |||
| 2020—2040年耕地 保护情景 Scenarios for farmland protection in 2020‒2040 | 耕地-林地 Cropland-Forestland | 0.002239 | 72.53 | 林地-建设用地 Forestland-Built land | 0.010282 | 63.43 | |
| 未利用地-草地 Unused land-Grassland | 0.000253 | 8.20 | 林地-耕地 Forestland-Cropland | 0.002906 | 17.93 | ||
| 耕地-草地 Cropland-Grassland | 0.000140 | 4.53 | 水域-建设用地 Water land-Built land | 0.000804 | 4.96 | ||
| 水域-林地 Water land-Forestland | 0.000119 | 3.87 | 耕地-建设用地 Cropland-Built land | 0.000548 | 3.38 | ||
| 耕地-水域 Cropland-Water land | 0.000090 | 2.92 | 林地-水域 Forestland-Water land | 0.000499 | 3.08 | ||
| 总计Total | 0.002841 | 92.05 | 0.015039 | 92.79 | |||
| 2020—2040年生态 保护情景 Scenarios for ecological protection in 2020‒2040 | 耕地-林地 Cropland-Forestland | 0.002426 | 70.76 | 林地-建设用地 Forestland-Built land | 0.004024 | 43.30 | |
| 未利用地-草地 Unused land-Grassland | 0.000264 | 7.71 | 林地-耕地 Forestland-Cropland | 0.002512 | 27.03 | ||
| 耕地-草地 Cropland-Grassland | 0.000216 | 6.30 | 耕地-建设用地 Cropland-Built land | 0.001207 | 12.99 | ||
| 水域-林地 Water land-Forestland | 0.000128 | 3.74 | 水域-建设用地 Water land-Built land | 0.000413 | 4.45 | ||
| 耕地-水域 Cropland-Water land | 0.000125 | 3.64 | 草地-建设用地 Grassland-Built land | 0.000400 | 4.31 | ||
| 总计Total | 0.003159 | 92.15 | 0.008557 | 92.07 | |||
| [1] |
ABURAS M M, HO Y M, RAMLI M F, et al., 2017. Improving the capability of an integrated CA-Markov model to simulate spatio-temporal urban growth trends using an Analytical Hierarchy Process and Frequency Ratio[J]. International Journal of Applied Earth Observation and Geoinformation, 59: 65-78.
DOI URL |
| [2] |
DE GROOT R S, WILSON M A, BOUMANS R M J, 2002. A typology for the classification, description and valuation of ecosystem functions, goods and services[J]. Ecological Economics, 41(3): 393-408.
DOI URL |
| [3] |
DU X J, HUANG Z H, 2017. Ecological and environmental effects of land use change in rapid urbanization: The case of Hangzhou, China[J]. Ecological Indicators, 81: 243-251.
DOI URL |
| [4] |
LI R Q, DONG M, CUI J Y, et al., 2007. Quantification of the impact of land-use changes on ecosystem services: A case study in Pingbian County, China[J]. Environmental Monitoring and Assessment, 128(1-3): 503-510.
DOI URL |
| [5] | LIU Y S, GAO J, YANG Y F, 2003. A holistic approach towards assessment of severity of land degradation along the Great Wall in northern Shaanxi Province, China[J]. Environmental Monitoring & Assessment, 82(2): 187-202. |
| [6] |
LIU Y, HUANG X J, YANG H, et al., 2014. Environmental effects of land-use/cover change caused by urbanization and policies in Southwest China Karst area: A case study of Guiyang[J]. Habitat International, 44: 339-348.
DOI URL |
| [7] |
METZGER M J, ROUNSEVELL M D A, ACOSTA-MICHLIK L, et al., 2006. The vulnerability of ecosystem services to land use change[J]. Agriculture Ecosystems & Environment, 114(1): 69-85.
DOI URL |
| [8] |
MOONEY H A, DURAIAPPAH A, LARIGAUDERIE A, 2013. Evolution of natural and social science interactions in global change research programs[J]. PNAS, 110(Suppl 1): 3665-3672.
DOI URL |
| [9] |
TANG F, FU M C, WANG L, et al., 2020. Land-use change in Changli County, China: Predicting its spatio-temporal evolution in habitat quality[J]. Ecological Indicators, 117: 106719.
DOI URL |
| [10] |
陈万旭, 李江风, 曾杰, 等, 2019. 中国土地利用变化生态环境效应的空间分异性与形成机理[J]. 地理研究, 38(9): 2173-2187.
DOI |
| CHEN W X, LI J F, ZENG J, et al., 2019. Spatial heterogeneity and formation mechanism of ecoenvironmental effect of land use change in China[J]. Geographical Research, 38(9): 2173-2187. | |
| [11] |
邓楚雄, 彭勇, 李科, 等, 2021. 基于生产-生态-生活空间多情景模拟下的流域土地利用转型及生态环境效应[J]. 生态学杂志, DOI: 10.13292/j.1000-4890.202108.031.
DOI |
|
DENG C X, PENG Y, LI K, et al., 2021. Simulation of watershed land use transition and ecological environment effects under multiple scenarios based on production-ecological-living space[J]. Chinese Journal of Ecology, DOI: 10.13292/j.1000-4890.202108.031.
DOI |
|
| [12] | 高星, 刘泽伟, 李晨曦, 等, 2020. 基于“三生空间”的雄安新区土地利用功能转型与生态环境效应研究[J]. 生态学报, 40(20): 7113-7122. |
| GAO X, LIU Z W, LI C X, et al., 2020. Land use function transformation in the Xiong’an New Area based on ecological-production-living spaces and associated eco-environment effects[J]. Acta Ecologica Sinica, 40(20): 7113-7122. | |
| [13] | 胡碧松, 张涵玥, 2018. 基于CA-Markov模型的鄱阳湖区土地利用变化模拟研究[J]. 长江流域资源与环境, 27(6): 1207-1219. |
| HU B S, ZHANG H Y, 2018. Simulation of land- use change in Poyang Lake region based on CA-Markov mode[J]. Resources and Environment in the Yangtze Basin, 27(6): 1207-1219. | |
| [14] | 焦露, 薛哲进, 尹剑, 等, 2020. “三生空间”视角下喀斯特地区土地利用转型的生态环境效应——以贵州省为例[J]. 生态经济, 36(4): 209-212. |
| JIAO L, XUE Z J, YIN J, et al., 2020. Eco-Environmental Effects of Land Use Transition in Karst Area Based on the View of “Ecological-Production-Living Spaces”: Taking Guizhou Province as an Example[J]. Ecological Economy, 36(4): 209-212. | |
| [15] | 雷金睿, 陈宗铸, 吴庭天, 等, 2019. 1989—2015年海口城市热环境与景观格局的时空演变及其相互关系[J]. 中国环境科学, 39(4): 1734-1743. |
| LEI J R, CHEN Z Z, WU T T, et al., 2019. Spatio-temporal evolution and interrelationship between thermal environment and landscape patterns of Haikou City, 1989-2015[J]. China Environmental Science, 39(4): 1734-1743. | |
| [16] | 雷金睿, 陈宗铸, 陈小花, 等, 2020. 1980—2018年海南岛土地利用与生态系统服务价值时空变化[J]. 生态学报, 40(14): 4760-4773. |
| LEI J R, CHEN Z Z, CHEN X H, et al., 2020. Spatio temporal changes of land use and ecosystem services value in Hainan Island from 1980 to 2018[J]. Acta Ecologica Sinica, 40(14): 4760-4773. | |
| [17] | 黎夏, 2007. 地理模拟系统: 元胞自动机与多智能体[M]. 北京: 科学出版社. |
| LI X, 2007. Geographical Simulation System: Cellular Automata and Multi-agent System[M]. Beijing: Science Press. | |
| [18] | 李晓文, 方创琳, 黄金川, 等, 2003. 西北干旱区城市土地利用变化及其区域生态环境效应: 以甘肃河西地区为例[J]. 第四纪研究, 23(3): 280-290. |
| LI X W, FANG C L, HUANG J C, et al., 2003. The urban land use transformations and associated effects on eco-environment in northwest China arid region: A case study in Hexi Region, Gansu Province[J]. Quaternary Sciences, 23(3): 280-290. | |
| [19] |
刘春芳, 王川, 刘立程, 2018. 三大自然区过渡带生境质量时空差异及形成机制: 以榆中县为例[J]. 地理研究, 37(2): 419-432.
DOI |
| LIU C F, WANG C, LIU L C, 2018. Spatio-temporal variation on habitat quality and its mechanism within the transitional area of the Three Natural Zones: A case study in Yuzhong county[J]. Geographical Research, 37(2): 419-432. | |
| [20] |
刘纪远, 宁佳, 匡文慧, 等, 2018. 2010—2015年中国土地利用变化的时空格局与新特征[J]. 地理学报, 73(5): 789-802.
DOI |
| LIU J Y, NING J, KUANG W H, et al., 2018. Spatio-temporal patterns and characteristics of land-use change in China during 2010-2015 [J]. Acta Geographica Sinica, 73(5): 789-802. | |
| [21] | 潘月, 于东升, 王秀虹, 等, 2018. 基于CA-Markov模型的土地利用景观格局预测研究[J]. 土壤, 50(2): 391-397. |
| PAN Y, YU D S, WANG X H, et al., 2018. Prediction of land use landscape pattern based on CA-Markov model[J]. Soils, 50(2): 391-397. | |
| [22] |
宋小青, 2017. 论土地利用转型的研究框架[J]. 地理学报, 72(3): 471-487.
DOI |
| SONG X Q, 2017. Discussion on land use transition research framework[J]. Acta Geographica Sinica, 72(3): 471-487. | |
| [23] |
杨清可, 段学军, 王磊, 等, 2018. 基于“三生空间”的土地利用转型与生态环境效应——以长江三角洲核心区为例[J]. 地理科学, 38(1): 97-106.
DOI |
| YANG Q K, DUAN X J, WANG L, et al., 2018. Land Use Transformation Based on Ecological-production-living Spaces and Associated Eco-environment Effects: A Case Study in the Yangtze River Delta[J]. Scientia Geographica Sinica, 38(1): 97-106. | |
| [24] | 苑韶峰, 唐奕钰, 申屠楚宁, 2019. 土地利用转型时空演变及其生态环境效应——基于长江经济带127个地级市的实证研究[J]. 经济地理, 39(9): 174-181. |
| YUAN S F, TANG Y Y, SHENTU C N, 2019. Spatiotemporal Change of Land-Use Transformation and Its Eco-Environmental Response: A Case of 127 Counties in Yangtze River Economic Belt[J]. Economic Geography, 39(9): 174-181. | |
| [25] |
张学儒, 周杰, 李梦梅, 2020. 基于土地利用格局重建的区域生境质量时空变化分析[J]. 地理学报, 75(1): 160-178.
DOI |
|
ZHANG X R, ZHOU J, LI M M, 2020. Analysis on spatial and temporal changes of regional habitat quality based on the spatial pattern reconstruction of land use[J]. Acta Geographica Sinica, 75(1): 160-178.
DOI |
|
| [26] | 朱增云, 阿里木江∙卡斯木, 2020. 基于地理探测器的伊犁谷地生境质量时空演变及其影响因素[J]. 生态学杂志, 39(10): 3408-3420. |
| ZHU Z Y, ALIMUJIANG KASIMU, 2020. Spatial-temporal evolution of habitat quality in Yili Valley based on geographical detectorand its influencing factors[J]. Chinese Journal of Ecology, 39(10): 3408-3420. |
| [1] | 翁升恒, 张玉琴, 姜冬昕, 潘卫华, 李丽纯, 张方敏. 福建省森林植被NEP时空变化及影响因子分析[J]. 生态环境学报, 2023, 32(5): 845-856. |
| [2] | 于菲, 曾海龙, 房怀阳, 付玲芳, 林澍, 董家豪. 典型感潮河网浮游藻类功能群时空变化特征及水质评价[J]. 生态环境学报, 2023, 32(4): 756-765. |
| [3] | 李梦华, 韩颖娟, 赵慧, 王云霞. 基于地理探测器的宁夏植被覆盖度时空变化特征及其驱动因子分析[J]. 生态环境学报, 2022, 31(7): 1317-1325. |
| [4] | 郝永佩, 宋晓伟, 赵文珺, 向发敏. 汾渭平原大气污染时空分布及相关因子分析[J]. 生态环境学报, 2022, 31(3): 512-523. |
| [5] | 石智宇, 王雅婷, 赵清, 张连蓬, 朱长明. 2001-2020年中国植被净初级生产力时空变化及其驱动机制分析[J]. 生态环境学报, 2022, 31(11): 2111-2123. |
| [6] | 付乐, 迟妍妍, 于洋, 张丽苹, 刘斯洋, 王夏晖, 许开鹏, 王晶晶, 张信. 2000—2020年黄河流域土地利用变化特征及影响因素分析[J]. 生态环境学报, 2022, 31(10): 1927-1938. |
| [7] | 余玉洋, 宋丰艺, 张世杰. 2000—2020年河南省NDVI时空变化及其驱动因素定量分析[J]. 生态环境学报, 2022, 31(10): 1939-1950. |
| [8] | 邓玉娇, 王捷纯, 徐杰, 吴永琪, 陈靖扬. 广东省植被固碳量时空变化及气象贡献率研究[J]. 生态环境学报, 2022, 31(1): 1-8. |
| [9] | 李圣增, 郝赛梅, 谭路遥, 张怀成, 徐标, 谷树茂, 潘光, 王淑妍, 闫怀忠, 张桂芹. 济南市PM2.5中二次组分的时空变化特征及其影响因素[J]. 生态环境学报, 2022, 31(1): 100-109. |
| [10] | 张伟, 王凯丽, 梁胜, 杜心宇, 刘路云, 陈存友, 胡希军. 基于计算力流体力学的城市近郊湖泊“冷岛效应”及其情景模拟研究——以长沙市同升湖为例[J]. 生态环境学报, 2021, 30(10): 2054-2066. |
| 阅读次数 | ||||||
|
全文 |
|
|||||
|
摘要 |
|
|||||