生态环境学报 ›› 2026, Vol. 35 ›› Issue (5): 793-804.DOI: 10.16258/j.cnki.1674-5906.2026.05.012
石洪飞1( ), 侯光良1,2,*(), 曹明珠1, 关佳萌1, 何家豪1, 唐中华1, 马曙光1
收稿日期:2025-09-12
修回日期:2026-01-21
接受日期:2026-03-06
出版日期:2026-05-18
发布日期:2026-05-08
通讯作者:
*E-mail: 作者简介:石洪飞(2001年生),男,硕士研究生,研究方向为全球变化与人类适应。E-mail: 2058057578@qq.com
基金资助:
SHI Hongfei1(), HOU Guangliang1,2,*(), CAO Mingzhu1, GUAN Jiameng1, HE Jiahao1, TANG Zhonghua1, MA Shuguang1
Received:2025-09-12
Revised:2026-01-21
Accepted:2026-03-06
Online:2026-05-18
Published:2026-05-08
摘要:
为揭示三江源黄河流域水源涵养的时空演变特征及驱动机制,同时为该区域生态保护与水源涵养功能提升提供科学依据。基于InVEST模型(3.15.0版)评估了2000-2020年三江源黄河流域水源涵养时空变化及驱动机制。结果显示:1)时序上,水源涵养能力与涵养量呈“上升-下降-上升”波动,年均涵养深度为31.9-54.3 mm,涵养总量为11.2×10⁸-19.6×10⁸ m3。2005年达峰值,2015年为谷值,Mann-Kendall趋势检验未通过显著性水平(p=1.000)。空间上呈现“东南高、西北低”的稳定格局。2)土地利用中,草地贡献了73.7%-77.2%的涵养总量,是主要贡献者;Kruskal-Wallis检验表明不同土地利用类型间涵养能力存在极显著差异(p<0.001,ȵ2=0.961)。揭示了未利用地(以高寒裸地为主)因表层结皮与冻土隔水作用表现出较强持水能力,而水域在模型中表征值最低,提示生态管理需兼顾“功能质量”与“空间数量”。3)驱动机制上,降水量是主导因子(q值:0.548-0.653),但核心发现为降水量与土地利用类型的交互作用具有最强解释力(q值:0.712-0.794),且存在非线性增强效应。地形因子(如坡度)单独解释力较弱,但与降水交互后影响力显著上升,揭示其通过调控降水再分配间接影响涵养格局的次级驱动机制。综上,三江源黄河流域水源涵养演变是由水热条件主导、多因子非线性协同作用的结果,尤其在冻土环境下,下垫面属性对降水的响应机制是驱动过程的核心。
中图分类号:
石洪飞, 侯光良, 曹明珠, 关佳萌, 何家豪, 唐中华, 马曙光. 基于InVEST模型的三江源黄河流域水源涵养时空演变与驱动机制[J]. 生态环境学报, 2026, 35(5): 793-804.
SHI Hongfei, HOU Guangliang, CAO Mingzhu, GUAN Jiameng, HE Jiahao, TANG Zhonghua, MA Shuguang. Water Conservation in the Three-River Headwaters Region of the Yellow River: Spatiotemporal Changes and Driving Forces Using the InVEST Model[J]. Ecology and Environmental Sciences, 2026, 35(5): 793-804.
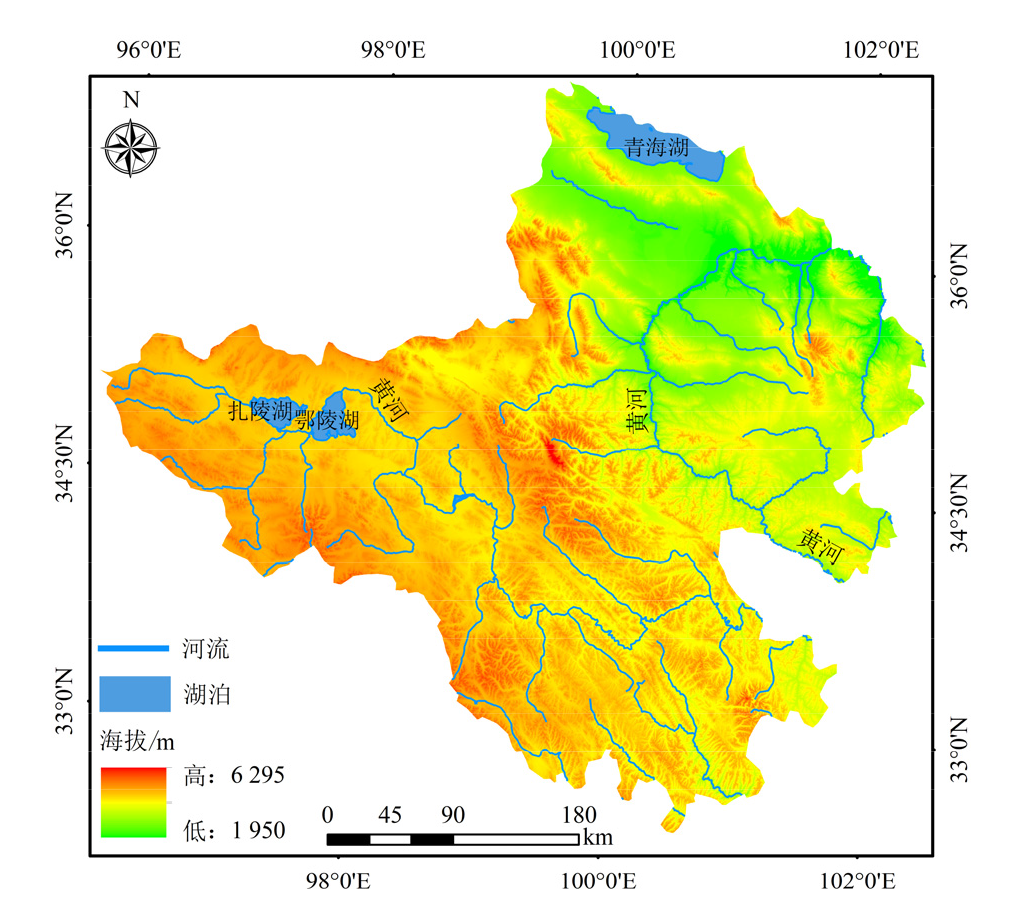
图1 研究区概括图
Figure 1 Location map of the study area
| 数据名称 | 内容 | 格式 | 时间序列 | 来源 |
|---|---|---|---|---|
| DEM | 三江源黄河流域高程 | 栅格 (30 m) | - | 地理空间数据云(www.gscloud.cn) |
| 土地利用类型 | 包括:耕地、林地、草地、水域、 建设用地、未利用土地 | 2000-2020 | 中科院_30m_LUCC-土地利用数据集 | |
| 年降水量 | 年降水量 | 栅格 (1 km) | 国家青藏高原科学数据中心( | |
| TEM | 年均气温 | |||
| ETP | 年潜在蒸散量 | |||
| 土壤数据 | 厚度及沙粒、粉沙粒、黏粒、土壤有机质含量 | - | 世界土壤数据库(HWSD) | |
| 植被可利用含水量 | 植被可利用含水率 | 栅格 (30 m) | - | 利用SPAW软件计算 |
| 土壤饱和导水率 | 各个土壤组成的饱和导水率 | - | 根据SPAW软件计算 | |
| Z系数 | 模型系数(取值为1-30) | - | - | 通过手动多次调整Zhang系数,评估系数调整前后产水系数和区域产水系数的差异,确定Zhang系数为4.9 |
| 生物系数表 | 包含最大根系深度(root_depth)、土地利用/覆被类型植被蒸散系数(Kc)、土地利用类型代码(Lucode)和土地利用类型名称(LULC_desc) | - | - | 通过参考前人研究成果(谷丰等, |
| 流域系数 | 各土地利用的流域系数 | - | - | 联合国粮农组织提出的作物参考数据和相关文献确定(傅斌等, |
| 水文数据 | 流域水资源产水系数 | 统计数据 | 2000-2020 | 水利部黄河水利委员会获取( |
表1 数据来源
Table 1 Data source
| 数据名称 | 内容 | 格式 | 时间序列 | 来源 |
|---|---|---|---|---|
| DEM | 三江源黄河流域高程 | 栅格 (30 m) | - | 地理空间数据云(www.gscloud.cn) |
| 土地利用类型 | 包括:耕地、林地、草地、水域、 建设用地、未利用土地 | 2000-2020 | 中科院_30m_LUCC-土地利用数据集 | |
| 年降水量 | 年降水量 | 栅格 (1 km) | 国家青藏高原科学数据中心( | |
| TEM | 年均气温 | |||
| ETP | 年潜在蒸散量 | |||
| 土壤数据 | 厚度及沙粒、粉沙粒、黏粒、土壤有机质含量 | - | 世界土壤数据库(HWSD) | |
| 植被可利用含水量 | 植被可利用含水率 | 栅格 (30 m) | - | 利用SPAW软件计算 |
| 土壤饱和导水率 | 各个土壤组成的饱和导水率 | - | 根据SPAW软件计算 | |
| Z系数 | 模型系数(取值为1-30) | - | - | 通过手动多次调整Zhang系数,评估系数调整前后产水系数和区域产水系数的差异,确定Zhang系数为4.9 |
| 生物系数表 | 包含最大根系深度(root_depth)、土地利用/覆被类型植被蒸散系数(Kc)、土地利用类型代码(Lucode)和土地利用类型名称(LULC_desc) | - | - | 通过参考前人研究成果(谷丰等, |
| 流域系数 | 各土地利用的流域系数 | - | - | 联合国粮农组织提出的作物参考数据和相关文献确定(傅斌等, |
| 水文数据 | 流域水资源产水系数 | 统计数据 | 2000-2020 | 水利部黄河水利委员会获取( |
| 年份 | 2000 | 2005 | 2010 | 2015 | 2020 |
|---|---|---|---|---|---|
| 实际产水系数 | 28.1 | 41.4 | 29.9 | 26.5 | 38.5 |
| 模型产水系数 | 30.6 | 39.1 | 29.7 | 26.6 | 33.3 |
| 误差 | 2.5 | −2.3 | −0.2 | 0.1 | −5.2 |
表2 2000-2020年实际产水系数与模拟产水系数比对
Table 2 Comparison of actual water yield coefficient and simulated water yield coefficient from 2000 to 2020 %
| 年份 | 2000 | 2005 | 2010 | 2015 | 2020 |
|---|---|---|---|---|---|
| 实际产水系数 | 28.1 | 41.4 | 29.9 | 26.5 | 38.5 |
| 模型产水系数 | 30.6 | 39.1 | 29.7 | 26.6 | 33.3 |
| 误差 | 2.5 | −2.3 | −0.2 | 0.1 | −5.2 |
| 年份 | 多年平均 | 2000 | 2005 | 2010 | 2015 | 2020 |
|---|---|---|---|---|---|---|
| 年均产水深度/mm | 138.26 | 121.77 | 187.48 | 130.62 | 103.61 | 147.81 |
| 相对变化/% | 0 | −11.9 | 35.6 | −5.5 | −25.1 | 6.91 |
| 年均降水/mm | 429.05 | 397.39 | 478.53 | 437.64 | 391.18 | 440.51 |
| 降水距平/% | 0 | −7.4 | 11.5 | 2.0 | −8.8 | 2.7 |
| 类型 | 平水年 | 平水年 | 丰水年 | 平水年 | 枯水年 | 平水年 |
表3 产水深度年均变化
Table 3 Annual average variation of water production depth
| 年份 | 多年平均 | 2000 | 2005 | 2010 | 2015 | 2020 |
|---|---|---|---|---|---|---|
| 年均产水深度/mm | 138.26 | 121.77 | 187.48 | 130.62 | 103.61 | 147.81 |
| 相对变化/% | 0 | −11.9 | 35.6 | −5.5 | −25.1 | 6.91 |
| 年均降水/mm | 429.05 | 397.39 | 478.53 | 437.64 | 391.18 | 440.51 |
| 降水距平/% | 0 | −7.4 | 11.5 | 2.0 | −8.8 | 2.7 |
| 类型 | 平水年 | 平水年 | 丰水年 | 平水年 | 枯水年 | 平水年 |
| 参数 | Ksat | T | V | 扰动度/% |
|---|---|---|---|---|
| 平均水源涵养能力变化/% | 10.0% | 0.0% | −8.8% | +10.0% |
| −10.0% | −0.1% | 6.1% | −10.0% | |
| 29.9% | 0.0% | −22.2% | +30.0% | |
| −30.0% | −7.9% | 23.3% | −30.0% |
表4 模型参数敏感性分析结果
Table 4 Results of sensitivity analysis on model parameters
| 参数 | Ksat | T | V | 扰动度/% |
|---|---|---|---|---|
| 平均水源涵养能力变化/% | 10.0% | 0.0% | −8.8% | +10.0% |
| −10.0% | −0.1% | 6.1% | −10.0% | |
| 29.9% | 0.0% | −22.2% | +30.0% | |
| −30.0% | −7.9% | 23.3% | −30.0% |
| 因子 | 降水量 | TEM | ETP | DEM | 坡度 | 土地利用 | 格网(像元) |
|---|---|---|---|---|---|---|---|
| 单因子 q值 | 0.603 | 0.163 | 0.170 | 0.191 | 0.129 | 0.246 | 250×250 |
| 0.601 | 0.167 | 0.170 | 0.197 | 0.125 | 0.247 | 200×200 | |
| 0.607 | 0.171 | 0.178 | 0.191 | 0.129 | 0.240 | 150×150 |
表5 格网敏感性分析结果
Table 5 Results of sensitivity analysis on grids
| 因子 | 降水量 | TEM | ETP | DEM | 坡度 | 土地利用 | 格网(像元) |
|---|---|---|---|---|---|---|---|
| 单因子 q值 | 0.603 | 0.163 | 0.170 | 0.191 | 0.129 | 0.246 | 250×250 |
| 0.601 | 0.167 | 0.170 | 0.197 | 0.125 | 0.247 | 200×200 | |
| 0.607 | 0.171 | 0.178 | 0.191 | 0.129 | 0.240 | 150×150 |
| 因子 | 降水量 | TEM | ETP | DEM | 坡度 | 土地利用 | 自然间断法分层 |
|---|---|---|---|---|---|---|---|
| 单因子 q值 | 0.607 | 0.163 | 0.172 | 0.195 | 0.121 | 0.244 | 9 |
| 0.598 | 0.150 | 0.159 | 0.181 | 0.116 | 0.244 | 6 | |
| 0.588 | 0.141 | 0.157 | 0.158 | 0.113 | 0.244 | 5 |
表6 自然间断层数敏感性分析结果
Table 6 Results of sensitivity analysis on the number of natural break layers
| 因子 | 降水量 | TEM | ETP | DEM | 坡度 | 土地利用 | 自然间断法分层 |
|---|---|---|---|---|---|---|---|
| 单因子 q值 | 0.607 | 0.163 | 0.172 | 0.195 | 0.121 | 0.244 | 9 |
| 0.598 | 0.150 | 0.159 | 0.181 | 0.116 | 0.244 | 6 | |
| 0.588 | 0.141 | 0.157 | 0.158 | 0.113 | 0.244 | 5 |
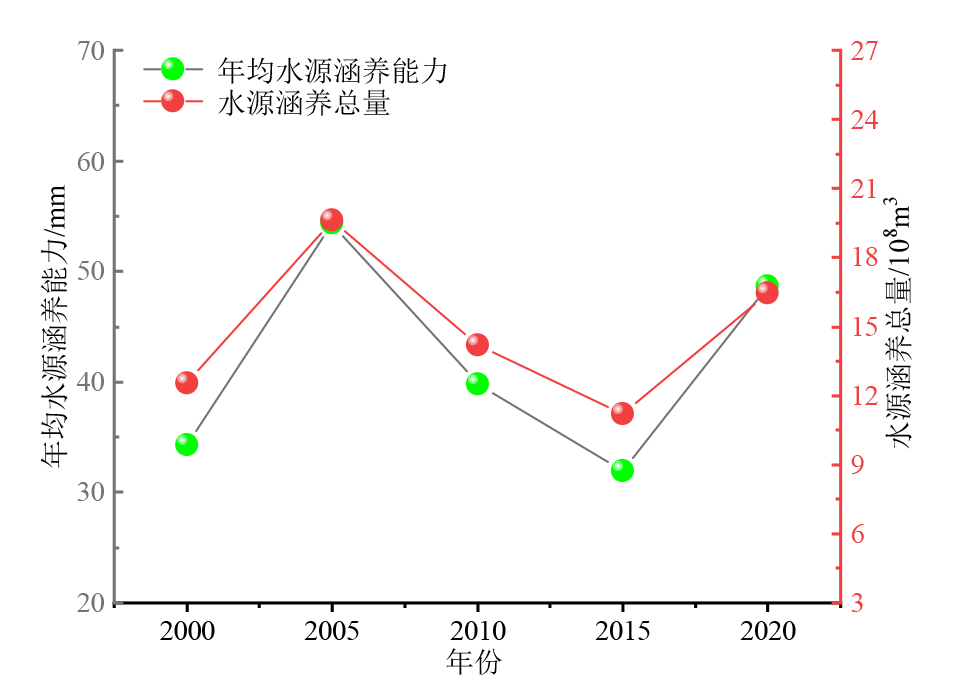
图2 三江源黄河流域水源涵养能力与水源涵养量变化趋势
Figure 2 Trends in changes of water conservation capacity and quantity in the Yellow River Basin of the Three-River Headwaters Region
| 参数 | Z | p | Sen’s斜率 | 显著性检验水平α |
|---|---|---|---|---|
| 水源涵养量M-K检验值 | 0.000 | 1.000 | 1.86 | 0.05 |
| 年均水源涵养能力 M-K检验值 | 0.000 | 1.000 | 0.992 | 0.05 |
表7 Mann Kendall检验结果
Table 7 Results of the Mann-Kendall test
| 参数 | Z | p | Sen’s斜率 | 显著性检验水平α |
|---|---|---|---|---|
| 水源涵养量M-K检验值 | 0.000 | 1.000 | 1.86 | 0.05 |
| 年均水源涵养能力 M-K检验值 | 0.000 | 1.000 | 0.992 | 0.05 |
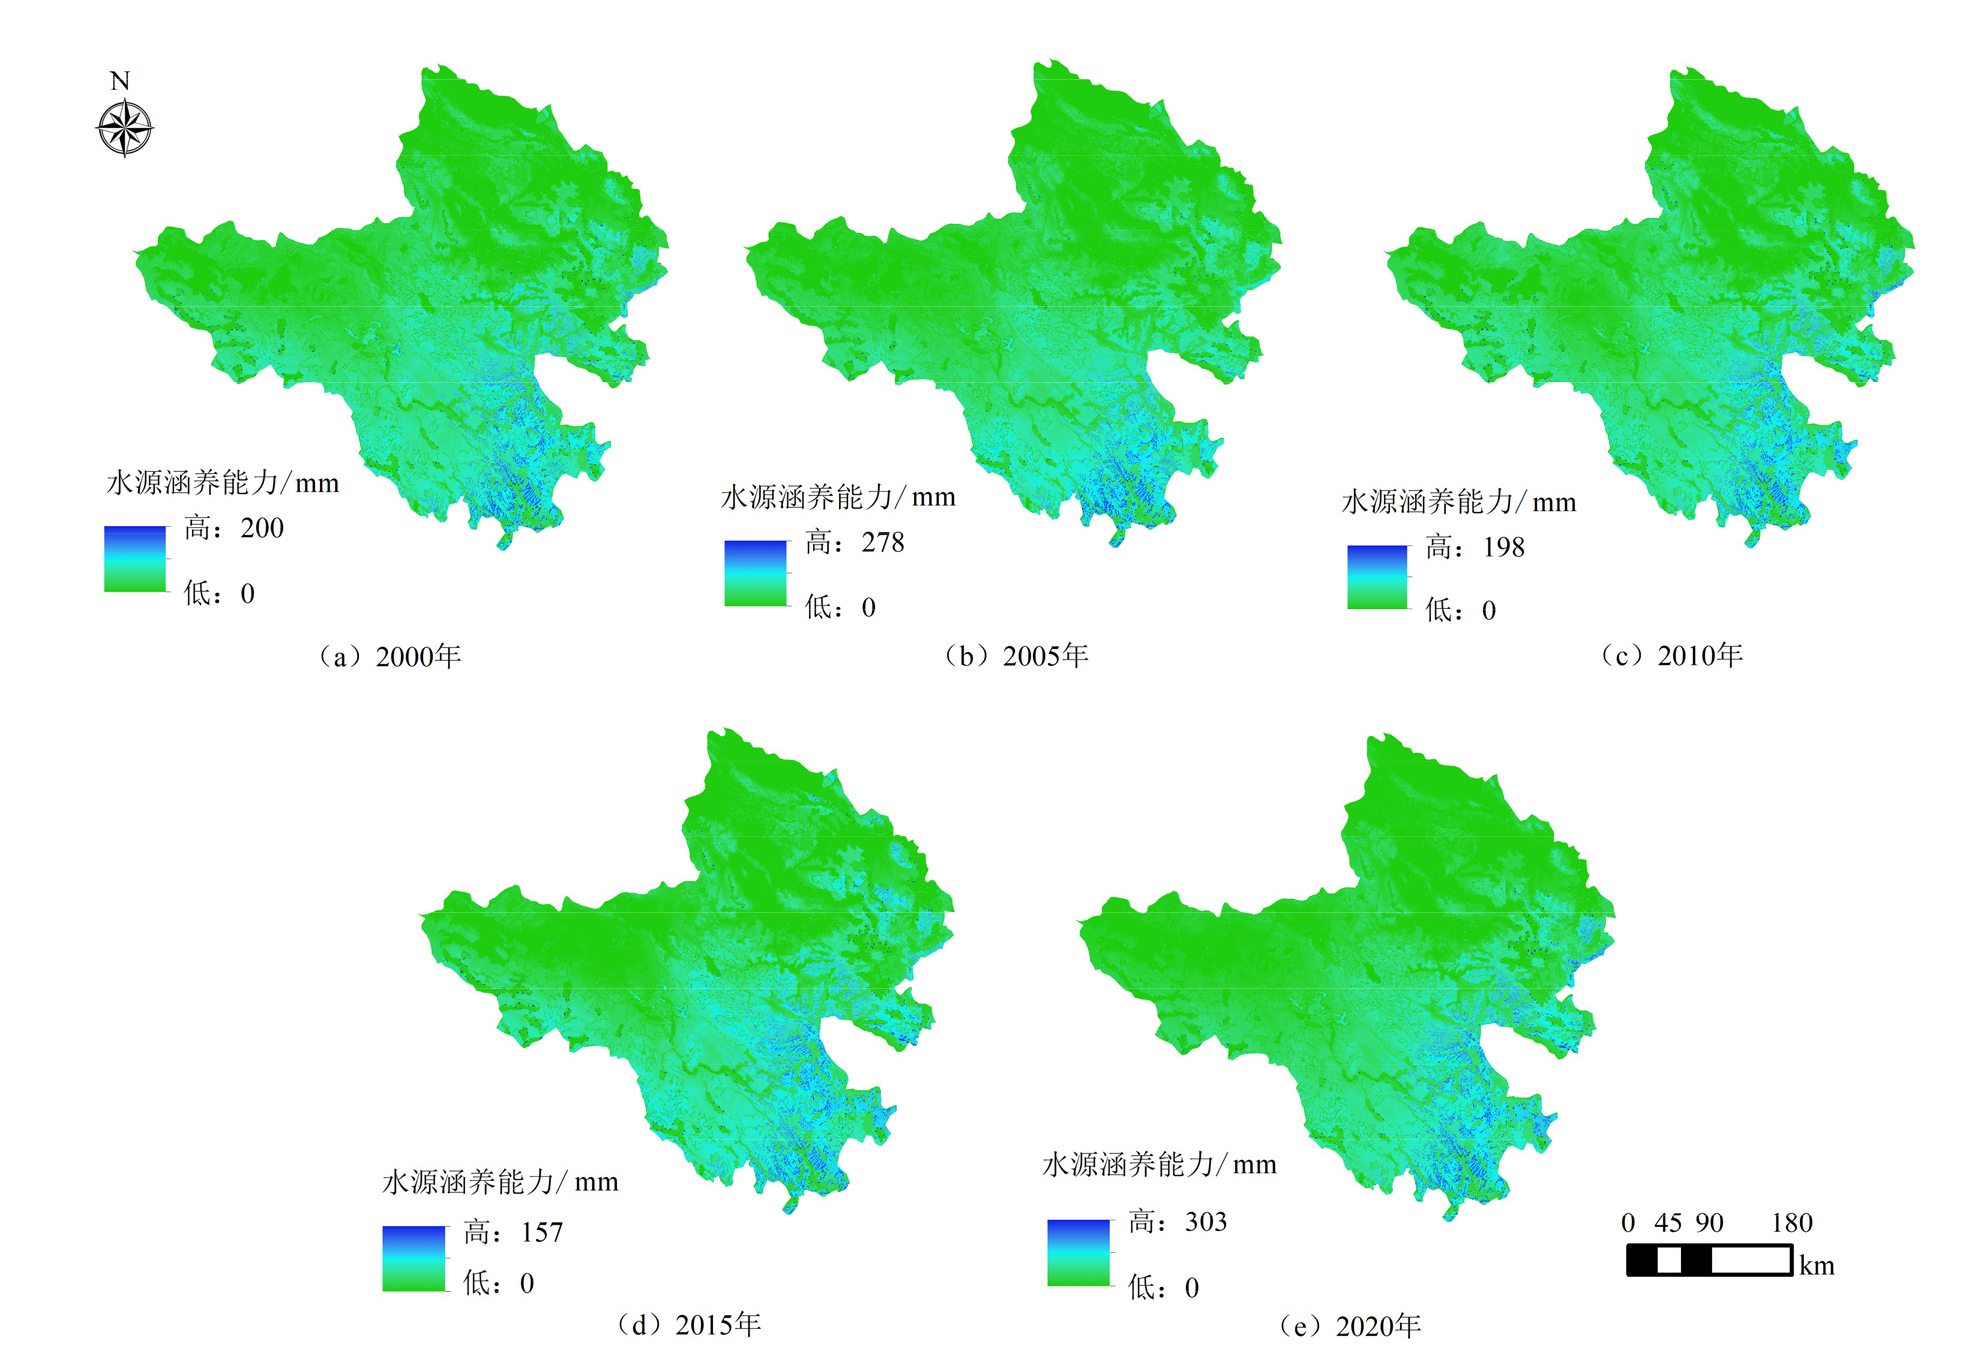
图3 水源涵养能力空间分布图
Figure 3 Spatial distribution map of water conservation capacity
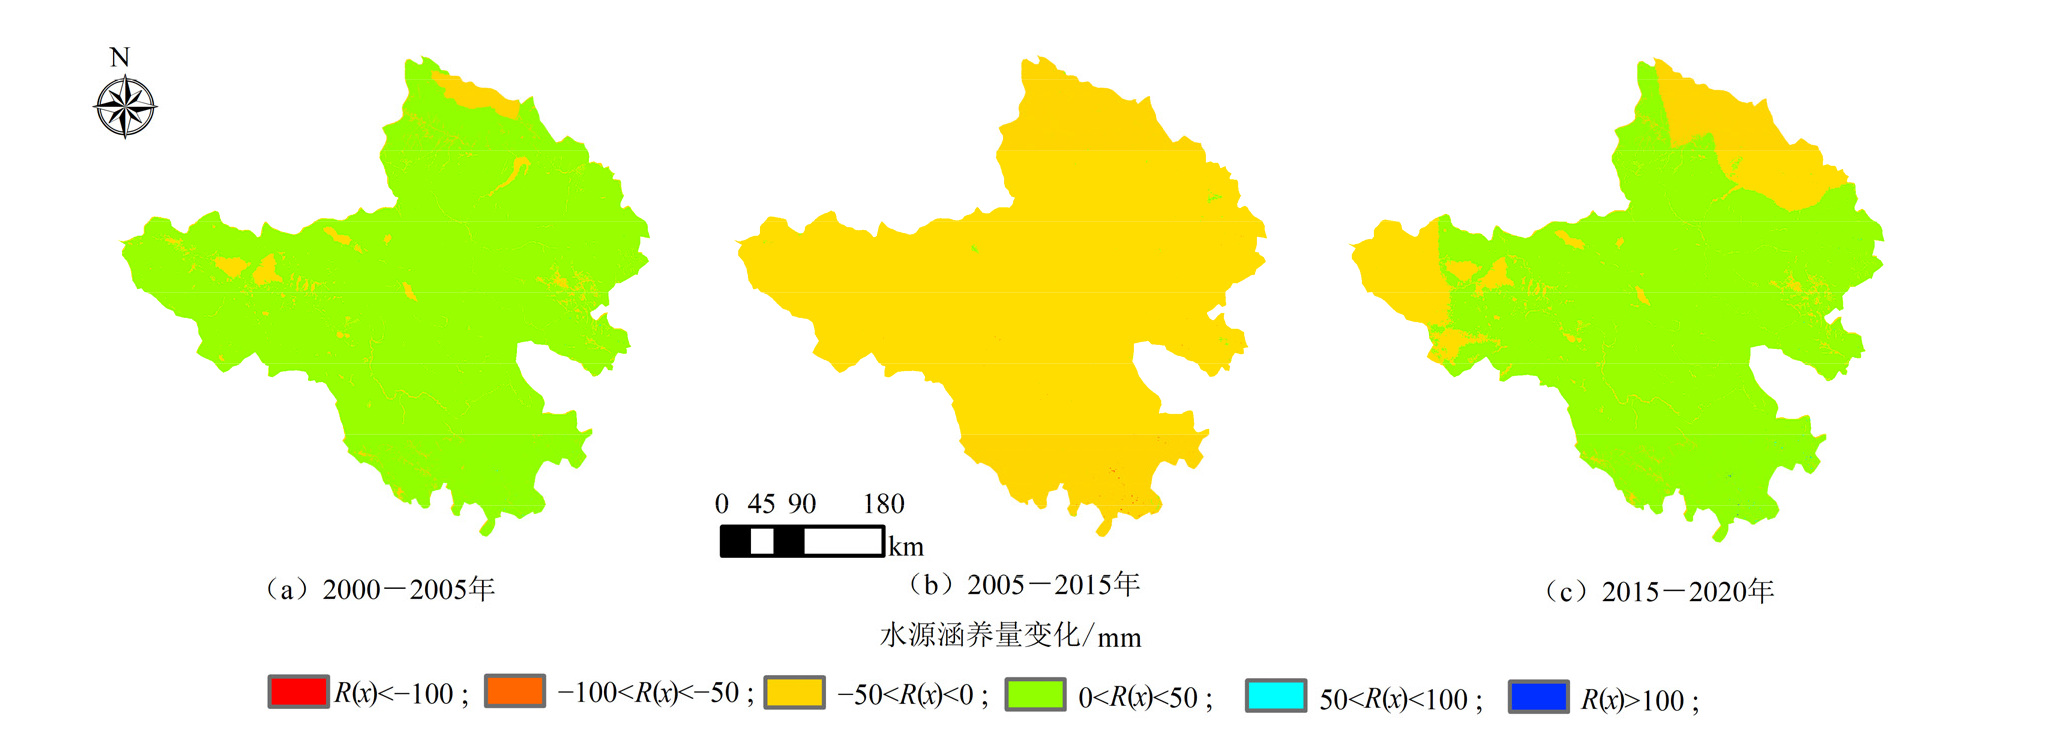
图4 水源涵养能力空间变化图
Figure 4 Spatial change map of water conservation capacity
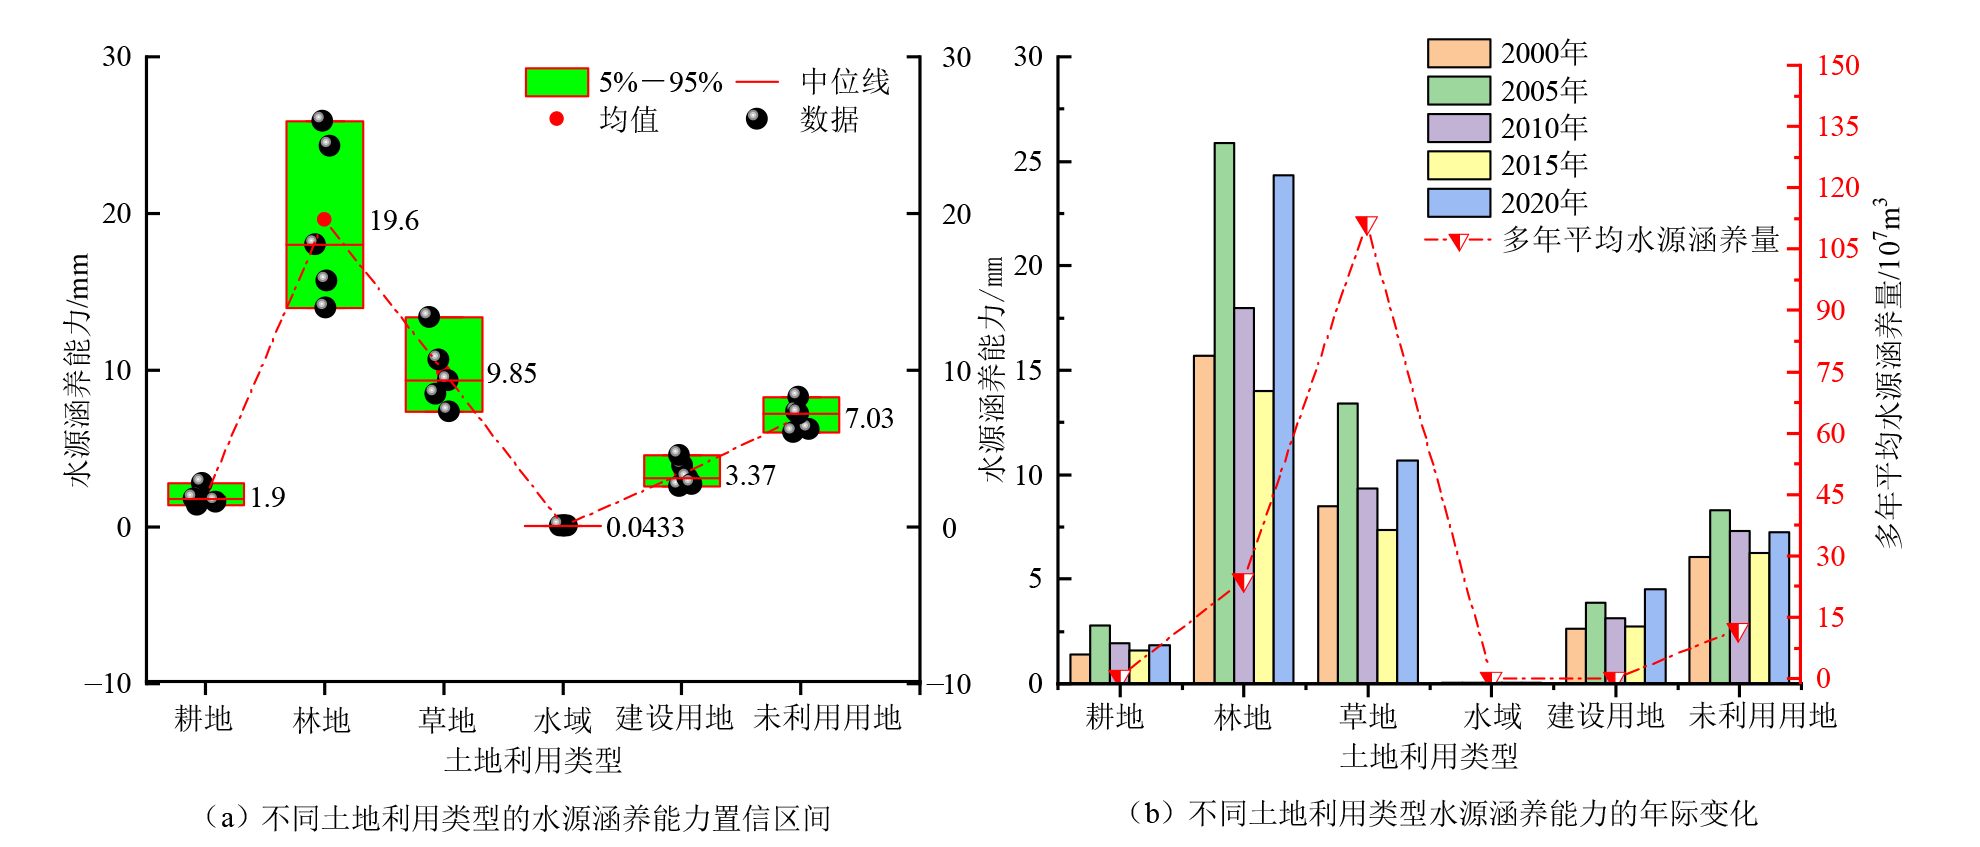
图5 2000-2020年不同土地利用类型水源涵养能力的置信区间估计与年际变化
Figure 5 Interannual variation and confidence intervals of water retention capacity across land use types, 2000?2020
| 参数 | 耕地 (n=5) | 林地 (n=5) | 草地 (n=5) | 水域 (n=5) | 建设用地 (n=5) | 未利用地 (n=5) | Kruskal-Wallis 检验统计量H值 | p | ȵ2 |
|---|---|---|---|---|---|---|---|---|---|
| 多年平均水源涵养能力 | 1.90 | 19.6 | 9.85 | 0.04 | 3.37 | 7.03 | 27.9 | 0.000*** | 0.961 |
表8 Kruskal-Wallis非参数检验分析结果
Table 8 Results of the Kruskal-Wallis non-parametric test analysis
| 参数 | 耕地 (n=5) | 林地 (n=5) | 草地 (n=5) | 水域 (n=5) | 建设用地 (n=5) | 未利用地 (n=5) | Kruskal-Wallis 检验统计量H值 | p | ȵ2 |
|---|---|---|---|---|---|---|---|---|---|
| 多年平均水源涵养能力 | 1.90 | 19.6 | 9.85 | 0.04 | 3.37 | 7.03 | 27.9 | 0.000*** | 0.961 |
| 年代 | 坡度 | DEM | 土地利用 | 降水量 | TEM | ETP |
|---|---|---|---|---|---|---|
| 2000 | 0.123 | 0.171 | 0.195 | 0.643 | 0.148 | 0.161 |
| 2005 | 0.118 | 0.194 | 0.303 | 0.548 | 0.146 | 0.164 |
| 2010 | 0.116 | 0.216 | 0.257 | 0.579 | 0.171 | 0.179 |
| 2015 | 0.129 | 0.186 | 0.212 | 0.614 | 0.169 | 0.168 |
| 2020 | 0.121 | 0.195 | 0.254 | 0.653 | 0.179 | 0.187 |
表9 三江源黄河流域水源涵养能力单因子探测结果
Table 9 Results of single factor detection on water conservation capacity in the Yellow River Basin of the Three-River Headwaters Region
| 年代 | 坡度 | DEM | 土地利用 | 降水量 | TEM | ETP |
|---|---|---|---|---|---|---|
| 2000 | 0.123 | 0.171 | 0.195 | 0.643 | 0.148 | 0.161 |
| 2005 | 0.118 | 0.194 | 0.303 | 0.548 | 0.146 | 0.164 |
| 2010 | 0.116 | 0.216 | 0.257 | 0.579 | 0.171 | 0.179 |
| 2015 | 0.129 | 0.186 | 0.212 | 0.614 | 0.169 | 0.168 |
| 2020 | 0.121 | 0.195 | 0.254 | 0.653 | 0.179 | 0.187 |
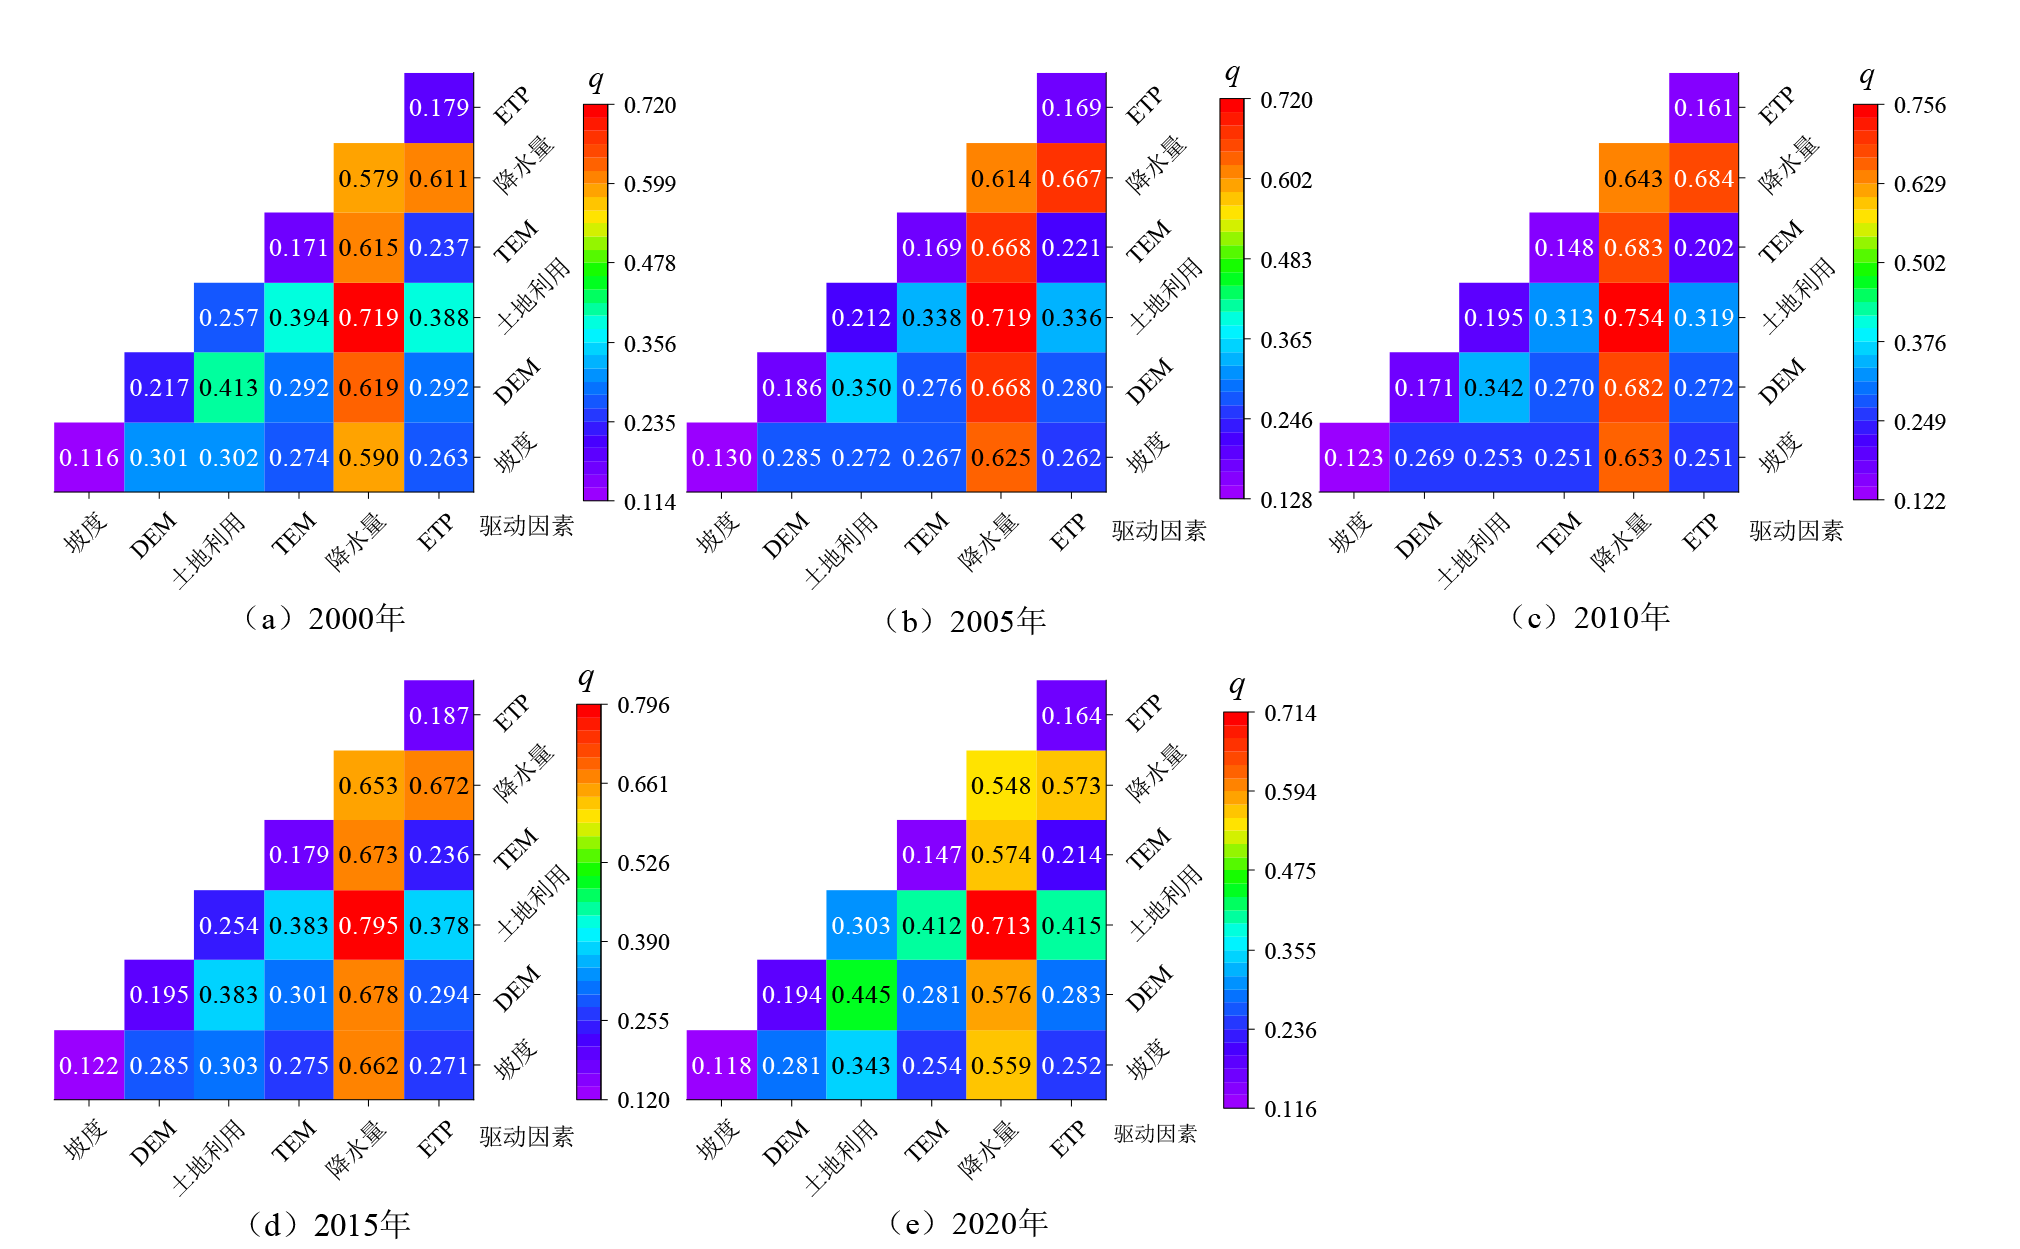
图6 三江源黄河流域水源涵养能力因子交互探测结果
Figure 6 Results of factor interaction detection on water conservation capacity in the Yellow River Basin of the Three-River Headwaters Region
| [1] |
CHEN Q R, XU X, WU M Y, et al., 2022. Assessing the Water Conservation Function Based on the InVEST Model: Taking Poyang Lake Region as an Example[J]. Land, 11(12): 22-28.
DOI URL |
| [2] |
COSBY B J, HORNBERGER G M, CLAPP R B, et al., 1984. A statistical exploration of the relationships of soil moisture characteristics to the physical properties of soils[J]. Water Resources Research, 20(6): 682-690.
DOI URL |
| [3] | COHEN J, 1988. Statistical Power Analysis for the Behavioral Sciences[M]. Hillsdale, NJ: Lawrence Erlbaum Associates. |
| [4] |
DIVINSKY I, BECKER N, BAR P, 2017. Ecosystem service tradeoff between grazing intensity and other services: A case study in Karei-Deshe experimental cattle range in northern Israel[J]. Ecosystem Services, 24: 16-27.
DOI URL |
| [5] |
FABER J H, VAN W J, 2012. Elaborations on the use of the ecosystem services concept for application in ecological risk assessment for soils[J]. Science of the Total Environment, 415(2): 3-8.
DOI URL |
| [6] |
GUNTON R M, ASPEREN E N, ELINE N, et al., 2017. Beyond ecosystem services: Valuing the invaluable[J]. Trends in Ecology and Evolution, 32(4): 249-257.
DOI URL |
| [7] | HELSEL D R, HIRSCH R M, 2002. Statistical Methods in Water Resources[M]. Reston, Virginia: U.S. Geological Survey. |
| [8] | REDHEAD J W, STRATFORD C, SHARPS K, et al., 2016. Empirical validation of the InVEST water yield ecosystem service model at a national scale[J]. Science of the Total Environment, 569: 1418-1426. |
| [9] |
WANG J F, ZHANG T L, FU B J, 2016. A measure of spatial stratified heterogeneity[J]. Ecological Indicators, 67: 250-256.
DOI URL |
| [10] | ZHANG L, HICKEL K, DAWES W R, et al., 2004. A rational function approach for estimating mean annual evapotranspiration[J]. Water Resources Research, 40(2): 1-14. |
| [11] | 曹巍, 刘璐璐, 吴丹, 等, 2019. 三江源国家公园生态功能时空分异特征及其重要性辨识[J]. 生态学报, 39(4): 1361-1374. |
| CAO W, LIU L L, WU D, et al., 2019. Spatial and temporal variations and the importance of hierarchy of ecosystem functions in the Three-river-source National Park[J]. Acta Ecologica Sinica, 39(4): 1361-1374. | |
| [12] | 陈长征, 甘容, 杨峰, 等, 2022. 基于SWAT的径流模拟参数优化方案及不确定性分析[J]. 人民长江, 53(7): 82-89. |
| CHEN C Z, GAN R, YANG F, et al., 2022. Parameters optimization scheme and uncertainty analysis of runoff simulation based on SWAT model[J]. Yangtze River, 53(7): 82-89. | |
| [13] |
陈万旭, 李江风, 朱丽君, 2019. 长江中游地区生态系统服务价值空间分异及敏感性分析[J]. 自然资源学报, 34(2): 325-337.
DOI |
|
CHEN W X, LI J F, ZHU L J, 2019. Spatial heterogeneity and sensitivity analysis of ecosystem services value in the Middle Yangtze River region[J]. Journal of Natural Resources, 34(2): 325-337.
DOI URL |
|
| [14] |
方露露, 许德华, 王伦澈, 等, 2021. 长江、黄河流域生态系统服务变化及权衡协同关系研究[J]. 地理研究, 40(3): 821-838.
DOI |
| FANG L L, XU D H, WANG L C, et al., 2021. The study of ecosystem services and the comparison of trade-off and synergy in Yangtze River Basin and Yellow River Basin[J]. Geographical Research, 40(3): 821-838. | |
| [15] | 傅斌, 徐佩, 王玉宽, 等, 2013. 都江堰市水源涵养功能空间格局[J]. 生态学报, 33(3): 126-134. |
| FU B, XU P, WANG Y K, et al., 2013. Spatial pattern of water retetnion in Dujiangyan County[J]. Acta Ecologica Sinica, 33(3): 126-134. | |
| [16] | 龚诗涵, 肖洋, 郑华, 等, 2017. 中国生态系统水源涵养空间特征及其影响因素[J]. 生态学报, 37(7): 2455-2462. |
| GONG S H, XIAO Y, ZHENG H, et al., 2017. Spatial patterns of ecosystem water conservation in China and its impact factors analysis[J]. Acta Ecologica Sinica, 37(7): 2455-2462. | |
| [17] | 谷丰, 王恒, 任春坪, 等, 2025. 基于InVEST模型的黄河流域四川段水源涵养功能时空变化[J/OL]. 草业科学. [2025-05-03]. http://kns.cnki.net/kcms/detail/62.1069.S.20250410.1000.004.html. |
| GU F, WANG H, REN C P, et al., 2025. Temporal and spatial changes of water conservation function in Sichuan section of the Yellow River Basin based on InVEST model[J/OL]. Pratacultural Science. [2025-05-03]. http://kns.cnki.net/kcms/detail/62.1069.S.20250410.1000.004.html. | |
| [18] | 韩朝辉, 朱一龙, 徐多勋, 等, 2025. 基于InVEST模型的汉江流域陕西段丰、枯水年水源涵养功能评价[J/OL]. 中国地质, [2025-05-03]. http://kns.cnki.net/kcms/detail/11.1167.P.20250415.1712.013.html. |
| HAN C H, ZHU Y L, XU D X, et al., 2025. Evaluation of water conservation function in wet and dry years in Shaanxi section of Han River Basin based on InVEST model[J/OL]. Geology in China, [2025-05-03]. http://kns.cnki.net/kcms/detail/11.1167.P.20250415.1712.013.html. | |
| [19] | 何秋琴, 王京伟, 毕旭, 等, 2024. 2005-2020年山西省水源涵养功能时空格局及其演变驱动力分析[J]. 环境科学研究, 37(4): 862-873. |
| HE Q Q, WANG J W, BI X, et al., 2024. Temporal and spatial dynamics of water conservation in Shanxi province (2005-2020): Patterns and influence analysis[J]. Research of Environmental Sciences, 37(4): 862-873. | |
| [20] |
蓝永超, 鲁承阳, 喇承芳, 等, 2013. 黄河源区气候向暖湿转变的观测事实及其水文响应[J]. 冰川冻土, 35(4): 920-928.
DOI |
| LAN Y C, LU C Y, LA C F, et al., 2013. The fact of climate shift to warm-humid in the source regions of the Yellow River and its hydrologic response[J]. Journal of Glaciology and Geocryology, 35(4): 920-928. | |
| [21] |
李乃强, 徐贵阳, 2020. 基于自然间断点分级法的土地利用数据网格化分析[J]. 测绘通报 (4): 106-110, 156.
DOI |
|
LI N Q, XU G Y, 2020. Grid analysis of land use based on natural breaks (jenks) classification[J]. Bulletin of Surveying and Mapping (4): 106-110, 156.
DOI |
|
| [22] | 吕明轩, 张红, 贺桂珍, 等, 2024. 黄河流域水源涵养服务功能动态演变及驱动因素[J]. 生态学报, 44(7): 2761-2771. |
| LÜ M X, ZHANG H, HE G Z, et al., 2024. Dynamic evolution and driving factors of water conservation service function in the Yellow River Basin[J]. Acta Ecologica Sinica, 44(7): 2761-2771. | |
| [23] | 毛娜, 黄来明, 邵明安, 2019. 黄土区坡面尺度不同植被类型土壤饱和导水率坡面分布及影响因素[J]. 土壤, 51(2): 381-389. |
| MAO N, HUANG L M, SHAO M A, 2019. Profile distribution of soil saturated hydraulic conductivity and controlling factors under different vegetations on slope in Loess Region[J]. Soils, 51(2): 381-389. | |
| [24] | 秦甲, 施发祥, 崔峻豪, 等, 2025. 黄河源区冻土变化对流域地表径流和水源涵养量的影响[J]. 水利水运工程学报 (2): 1-11. |
| QIN J, SHI F X, CUI J H, et al., 2025. The impact of permafrost changes in the Yellow River source region on surface runoff and water conservation capacity[J]. Hydro-Science and Engineering (2): 1-11. | |
| [25] | 司梦可, 曹建生, 阳辉, 2019. 微地形变化对地表水文过程影响的研究进展[J]. 中国生态农业学报(中英文), 27(10): 1587-1595. |
| SI M K, CAO J S, YANG H, 2019. Advances in research on the effects of micro-topography changes on surface hydrological proc-esses[J]. Chinese Journal of Eco-Agriculture, 27(10): 1587-1595. | |
| [26] | 石培礼, 李文华, 2001. 森林植被变化对水文过程和径流的影响效应[J]. 自然资源学报, 16(5): 481-487. |
|
SHI P L, LI W H, 2001. Influence of forest cover change on hydrological process and watershed runoff[J]. Journal of Natural Resources, 16(5): 481-487.
DOI |
|
| [27] |
孙文义, 邵全琴, 刘纪远, 2014. 黄土高原不同生态系统水土保持服务功能评价[J]. 自然资源学报, 29(3): 365-376.
DOI |
| SUM W Y, SHAO Q Q, LIU J Y, 2014. Assessment of soil conservation function of the ecosystem services on the Loess Plateau[J]. Journal of Natural Resources, 29(3): 365-376. | |
| [28] | 田世民, 韩冰, 梁帅, 等, 2022. 黄河源区水源涵养有关问题探讨[J]. 水利水运工程学报 (1): 19-27. |
| TIAN S M, HAN B, LIANG S, et al., 2022. Discussion on water conservation capacity in the source area of the Yellow River[J]. Hydro-Science and Engineering (1): 19-27. | |
| [29] |
王劲峰, 徐成东, 2017. 地理探测器:原理与展望[J]. 地理学报, 72(1): 116-134.
DOI |
|
WANG J F, XU C D, 2017. Geodetector: Principle and prospective[J]. Acta Geographica Sinica, 72(1): 116-134.
DOI |
|
| [30] | 王乐, 刘德地, 李天元, 等, 2015. 基于多变量M-K检验的北江流域降水趋势分析[J]. 水文, 35(4): 85-90. |
| WANG L, LUI D D, LI T Y, et al., 2015. Trend analysis of precipitation in Beijiang River Basin based on multivariate Mann-Kendall test[J]. Journal of China Hydrology, 35(4): 85-90. | |
| [31] | 王绍业, 倪用鑫, 彭华, 等, 2023. 近20年延河流域生长季产水系数时空变化特征及影响因素[J]. 水土保持研究, 30(3): 423-429. |
| WANG S Y, NI Y X, PENG H, et al., 2023. Analysis on the temporal and spatial variation characteristics and influencing factors of water yield coefficient in the growth season of Yanhe River basin in the past 20 years[J]. Research of Soil and water Conservation, 30(3): 423-429. | |
| [32] | 王亚迪, 权全, 薛涛涛, 等, 2018. 气候变化对黄河源区的水文影响分析[J]. 水资源研究, 7(2): 135-143. |
|
WANG Y D, QUAN Q, XUE T T, et al., 2018. Hydrological impact of climate change on the source region of the Yellow River[J]. Journal of Water Resources Research, 7(2): 135-143.
DOI URL |
|
| [33] |
王亚慧, 戴尔阜, 马良, 等, 2020. 横断山区产水量时空分布格局及影响因素研究[J]. 自然资源学报, 35(2): 371-386.
DOI |
|
WANG Y H, DAI E F, MA L, et al., 2020. Spatiotemporal and influencing factors analysis of water yield in the Hengduan Mountain region[J]. Journal of Natural Resources, 35(2): 371-386.
DOI URL |
|
| [34] | 谢展, 李萍, 刘文倩, 等, 2024. 气候变化和植被恢复对黄土高原水源涵养功能时空变化的影响[J]. 生态学报, 44(23): 10915-10935. |
| XIE Z, LI P, LIU W Q, et al., 2024. Spatial and temporal changes in water conservation in the Loess Plateau under the influence of climate change and vegetation restoration[J]. Acta Ecologica Sinica, 44(23): 10915-10935. | |
| [35] |
杨洁, 谢保鹏, 张德罡, 2020. 基于InVEST模型的黄河流域产水量时空变化及其对降水和土地利用变化的响应[J]. 应用生态学报, 31(8): 2731-2739.
DOI |
|
YANG J, XIE B P, ZHANG D G, et al., 2020. Spatio-temporal variation of water yield and its response to precipitation and land use change in the Yellow River Basin based on InVEST model[J]. Chinese Journal of Applied Ecology, 31(8): 2731-2739.
DOI |
|
| [36] | 张彪, 李文华, 谢高地, 等, 2009. 森林生态系统的水源涵养功能及其计量方法[J]. 生态学杂志, 28(3): 529-534. |
| ZHANG B, LI W H, XIE G D, et al., 2009. Water conservation function and its measurement methods of forest ecosystem[J]. Chinese Journal of Ecology, 28(3): 529-534. | |
| [37] | 张晨钰, 张攀, 王伟, 等, 2024. 基于多参数优化地理探测器的山洪灾害驱动力分析及风险评价[J]. 水利水电技术(中英文), 55(6): 1-15. |
| ZHANG C Y, ZHANG P, WANG W, et al., 2024. Driving force analysis and risk assessment of flash flood disaster based on multi-parameter optimized geographic detector[J]. Water Resources and Hydropower Engineering, 55(6): 1-15. | |
| [38] | 张福平, 李肖娟, 冯起, 等, 2018. 基于InVEST模型的黑河流域上游水源涵养量[J]. 中国沙漠, 38(6): 1321-1329. |
| ZHANG F P, LI X J, FENG Q, et al., 2018. Spatial and temporal variation of water conservation in the upper reaches of Heihe River basin based on InVEST model[J]. Journal of Desert Research, 38(6): 1321-1329. | |
| [39] | 张书齐, 左其亭, 巴音吉, 等, 2025. 伊洛河流域水源涵养能力时空变化及驱动因素分析[J]. 人民黄河, 47(6): 69-75. |
| ZHANG S Q, ZUO Q T, BA Y J, et al., 2025. Analysis of spatial-temporal changes and driving factors of water conservation capacity in the Yiluo River basin[J]. Yellow River, 47(6): 69-75. | |
| [40] | 赵亚茹, 周俊菊, 雷莉, 等, 2019. 基于InVEST模型的石羊河上游产水量驱动因素识别[J]. 生态学杂志, 38(12): 3789-3799. |
| ZHAO Y R, ZHOU J J, LEI L, et al., 2019. Identification of drivers for water yield in the upstream of Shiyang River based on InVEST model[J]. Chinese Journal of Ecology, 38(12): 3789-3799. | |
| [41] | 张志强, 余新晓, 赵玉涛, 等, 2003. 森林对水文过程影响研究进展[J]. 应用生态学报, 14(1): 113-116. |
| ZHANG Z Q, YU X X, ZHAO Y T, et al., 2003. Advance in researches on the effect of forest on hydrological process[J]. Chinese Journal of Applied Ecology, 14(1): 113-116. | |
| [42] | 郑子彦, 吕美霞, 马柱国, 2020. 黄河源区气候水文和植被覆盖变化及面临问题的对策建议[J]. 中国科学院院刊, 35(1): 61-72. |
| ZHENG Z Y, LÜ M X, MA Z G, 2020. Climate, hydrology, and vegetation coverage changes in source region of Yellow River and countermeasures for challenges[J]. Bulletin of Chinese Academy of Sciences, 35(1): 61-72. | |
| [43] | 左其亭, 王娇阳, 杨峰, 等, 2022. 水源涵养相关概念辨析及水源涵养能力计算方法[ J]. 水利水电科技进展, 42(2): 13-19. |
| ZUO Q T, WANG J Y, YANG F, et al., 2022. Concept analysis of water conservation and calculation methods of water conservation capacity[J]. Advances in Science and Technology of Water Resources, 42(2): 13-19. |
| [1] | 文少强, 胡宝清, 包婷, 谢薇薇, 劳茵茵, 高劲松. 国土空间功能与土地利用碳排放的脱钩效应及驱动机制研究——以平陆运河经济带为例[J]. 生态环境学报, 2026, 35(5): 725-737. |
| [2] | 付智华, 张捍卫, 王晶. 山东省矿区多维度土地利用转型对生态系统服务的空间异质驱动效应[J]. 生态环境学报, 2026, 35(4): 563-574. |
| [3] | 周致泺, 杨秋, 刘晓煌, 刘润, 刘玖芬, 马敏, 祝萍, 李朝柱. 海南岛乡镇尺度上“三生空间”时空分布变化与耦合协调分析[J]. 生态环境学报, 2026, 35(4): 654-664. |
| [4] | 王悦, 于福东, 张月, 相恒星, 焉恒琦, 毛德华. 基于PLUS-InVEST模型的东北黑土区景观格局与碳储量变化多情景模拟[J]. 生态环境学报, 2026, 35(2): 178-189. |
| [5] | 唐淑兰, 张旻曦. 结合GF-1多尺度特征与Sentinel-1结构特征的土地利用分类及碳储量估测[J]. 生态环境学报, 2026, 35(2): 190-198. |
| [6] | 侯慧敏, 李浩浩, 王辉, 王鹏全, 包志强, 任志伟. 石羊河流域氮保持功能评估与未来情景预测[J]. 生态环境学报, 2026, 35(2): 232-244. |
| [7] | 温羽婧, 李铌. 基于地形梯度的丘陵地区碳储量时空分异及分区研究——以长株潭城市群为例[J]. 生态环境学报, 2025, 34(9): 1373-1385. |
| [8] | 王秀玲, 金翠, 王浩然, 候明璇. 辽宁省植被时空变化特征及其对极端气候的响应[J]. 生态环境学报, 2025, 34(9): 1410-1420. |
| [9] | 梁秋燕, 宋明洁, 张豆, 李士成. 基于生态安全格局的昆明市2030年和2050年土地利用模拟[J]. 生态环境学报, 2025, 34(9): 1463-1472. |
| [10] | 丁馨, 刘健, 魏俐宏, 解德威, 郑昭佩. 基于GSMSR模型的山东省植被NEP时空格局及影响因素[J]. 生态环境学报, 2025, 34(7): 1079-1089. |
| [11] | 石镕瑞, 杨小雄, 马骥, 黄珊珊, 杨玥, 卢盛权, 吴广. 滇桂黔石漠化片区生态环境质量时空演变及驱动力分析[J]. 生态环境学报, 2025, 34(7): 1147-1162. |
| [12] | 王天雯, 罗明良, 白雷超. 嘉陵江流域生态系统服务动态变化及权衡协同分析[J]. 生态环境学报, 2025, 34(6): 888-901. |
| [13] | 杨昊彧, 黄康江, 陈晓东, 赵劼, 熊军, 田康. 贵州省生态空间效率演变及景观格局的影响归因[J]. 生态环境学报, 2025, 34(6): 902-913. |
| [14] | 吴雨桐, 於冉, 余祺琪, 王成, 张紫涵. 皖江流域生境质量评价及多情景优化研究[J]. 生态环境学报, 2025, 34(6): 961-973. |
| [15] | 赵志轩, 魏芳菲, 吴皓天, 王怡宁, 王澎喆. 澜沧江-湄公河流域生态系统服务价值对土地利用变化的响应[J]. 生态环境学报, 2025, 34(5): 688-698. |
| 阅读次数 | ||||||
|
全文 |
|
|||||
|
摘要 |
|
|||||