生态环境学报 ›› 2026, Vol. 35 ›› Issue (1): 99-111.DOI: 10.16258/j.cnki.1674-5906.2026.01.009
陈燕玲1,2( ), 周媛1,2,*(), 钱悦1,2, 吴燕良3, 邓力琛1,2, 吴琼4, 占龙飞4
收稿日期:2025-02-28
修回日期:2025-09-15
接受日期:2025-11-14
出版日期:2026-01-18
发布日期:2026-01-05
通讯作者:
* E-mail: 作者简介:陈燕玲(1993年生),女,工程师,硕士,从事生态遥感监测、空气污染研究。E-mail: 863692055@qq.com
基金资助:
CHEN Yanling1,2(), ZHOU Yuan1,2,*(), QIAN Yue1,2, WU Yanliang3, DENG Lichen1,2, WU Qiong4, ZHAN Longfei4
Received:2025-02-28
Revised:2025-09-15
Accepted:2025-11-14
Online:2026-01-18
Published:2026-01-05
摘要: 为全面了解江西省臭氧(O3)长期时空分布特征,基于臭氧监测仪(OMI)整层O3柱浓度数据以及臭氧监测仪-微波临边探测仪(OMI-MLS)对流层O3柱浓度数据,利用相关性分析、趋势分析法分析了江西省2005-2023年整层O3柱浓度和2005-2020年对流层O3柱浓度时空分布特征及影响因素。结果表明,时间上,2005-2023年江西省整层O3柱浓度呈波动上升的变化态势,年均值为273 DU,年均增长0.39 DU,最低值、最高值分别出现在2008、2022年;2019-2023年期间整层O3柱浓度上升速率是2005-2018年的5倍多;季节差异明显,均值为春季>夏季>秋季>冬季。空间上,江西省整层O3柱浓度高值区主要位于鄱阳湖平原一带的九江、南昌和上饶西部所在的赣北低海拔地区,低值区集中在赣南地区。2005-2020年对流层O3柱浓度呈上升趋势,年均增长0.29 DU,2019年达到峰值;季均值为春季>夏季>秋季>冬季。从气象因素分析来看,整层O3柱浓度、对流层O3柱浓度与气温、降水量、日照时数呈显著正相关,与气温正相关性最好,与气压呈显著负相关;从人为因素分析来看,两者与生产总值、第一、二、三产业及能源消耗总量均呈显著正相关,与第二产业正相关性最好,与NOx排放量呈显著负相关。
中图分类号:
陈燕玲, 周媛, 钱悦, 吴燕良, 邓力琛, 吴琼, 占龙飞. 基于OMI的江西省臭氧柱浓度时空分布特征及影响因素研究[J]. 生态环境学报, 2026, 35(1): 99-111.
CHEN Yanling, ZHOU Yuan, QIAN Yue, WU Yanliang, DENG Lichen, WU Qiong, ZHAN Longfei. Spatiotemporal Distribution of Ozone Column Concentrations and Associated Affecting Factors in Jiangxi Province Based on OMI[J]. Ecology and Environmental Sciences, 2026, 35(1): 99-111.

图1 江西省站点分布 底图采用自然资源部标准底图制作,审图号为GS(2024)0650号,对底图边界无修改
Figure 1 Distribution of observation stations in Jiangxi Province
| 地区 | 整层O3柱浓度 | 对流层O3柱浓度 |
|---|---|---|
| 江西省 | 0.60** 1) | 0.67** |
| 九江 | 0.52** | |
| 景德镇 | 0.64** | |
| 上饶 | 0.56** | |
| 南昌 | 0.60** | |
| 鹰潭 | 0.55** | |
| 宜春 | 0.49** | |
| 新余 | 0.56** | |
| 萍乡 | 0.52** | |
| 抚州 | 0.51** | |
| 吉安 | 0.54** | |
| 赣州 | 0.54** |
表1 整层、对流层O3柱浓度与地面站点O3-8h质量浓度 相关系数
Table 1 Correlation coefficients between total and tropospheric O3 column concentrations and O3-8h mass concentrations at monitoring sites
| 地区 | 整层O3柱浓度 | 对流层O3柱浓度 |
|---|---|---|
| 江西省 | 0.60** 1) | 0.67** |
| 九江 | 0.52** | |
| 景德镇 | 0.64** | |
| 上饶 | 0.56** | |
| 南昌 | 0.60** | |
| 鹰潭 | 0.55** | |
| 宜春 | 0.49** | |
| 新余 | 0.56** | |
| 萍乡 | 0.52** | |
| 抚州 | 0.51** | |
| 吉安 | 0.54** | |
| 赣州 | 0.54** |
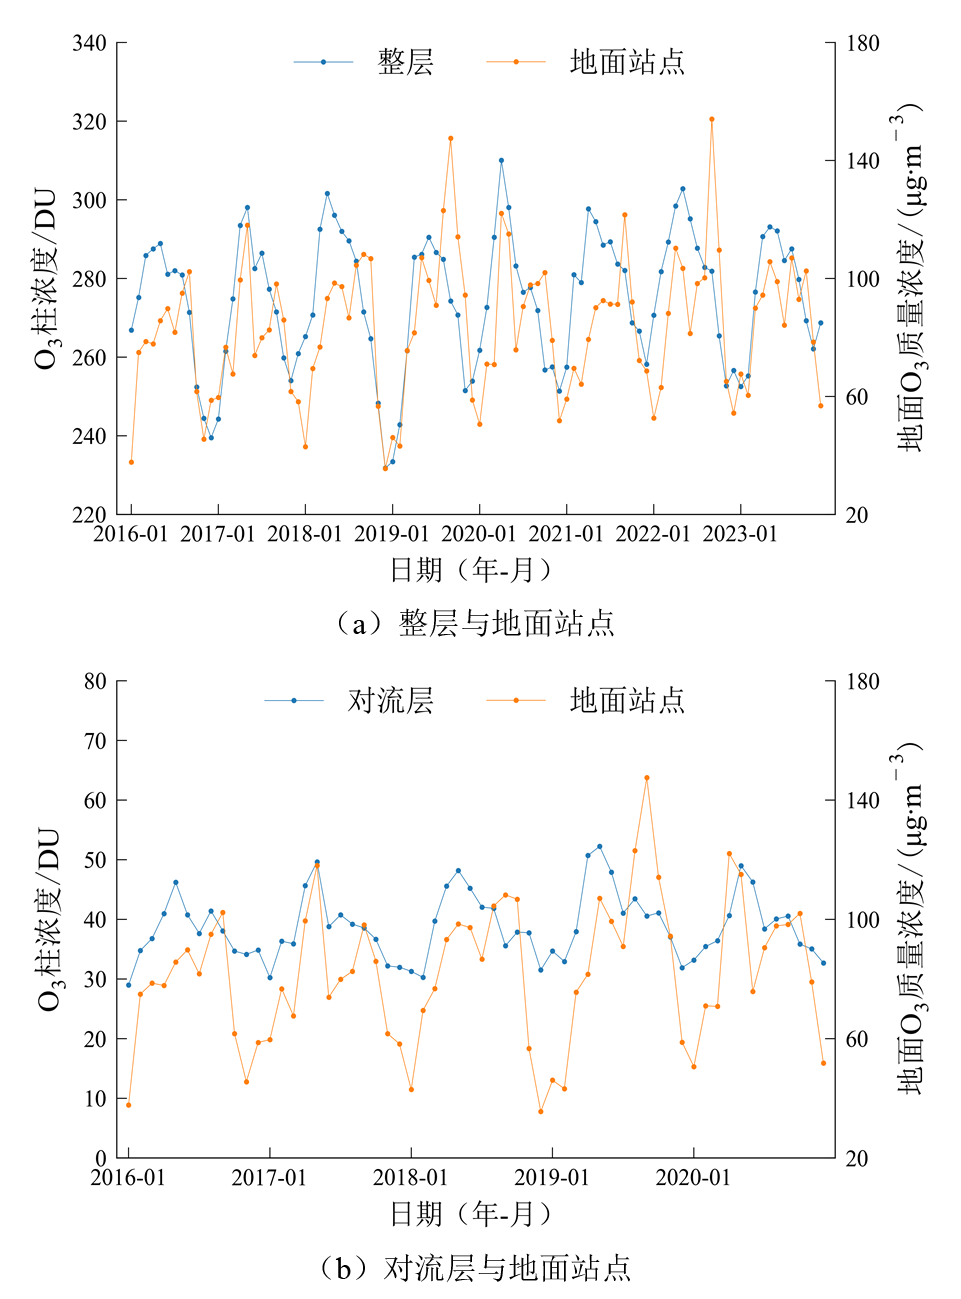
图2 整层、对流层O3柱浓度与地面站点O3-8h质量浓度对比
Figure 2 Comparison between total and tropospheric O3 column concentrations and O3-8h mass concentrations at monitoring sites
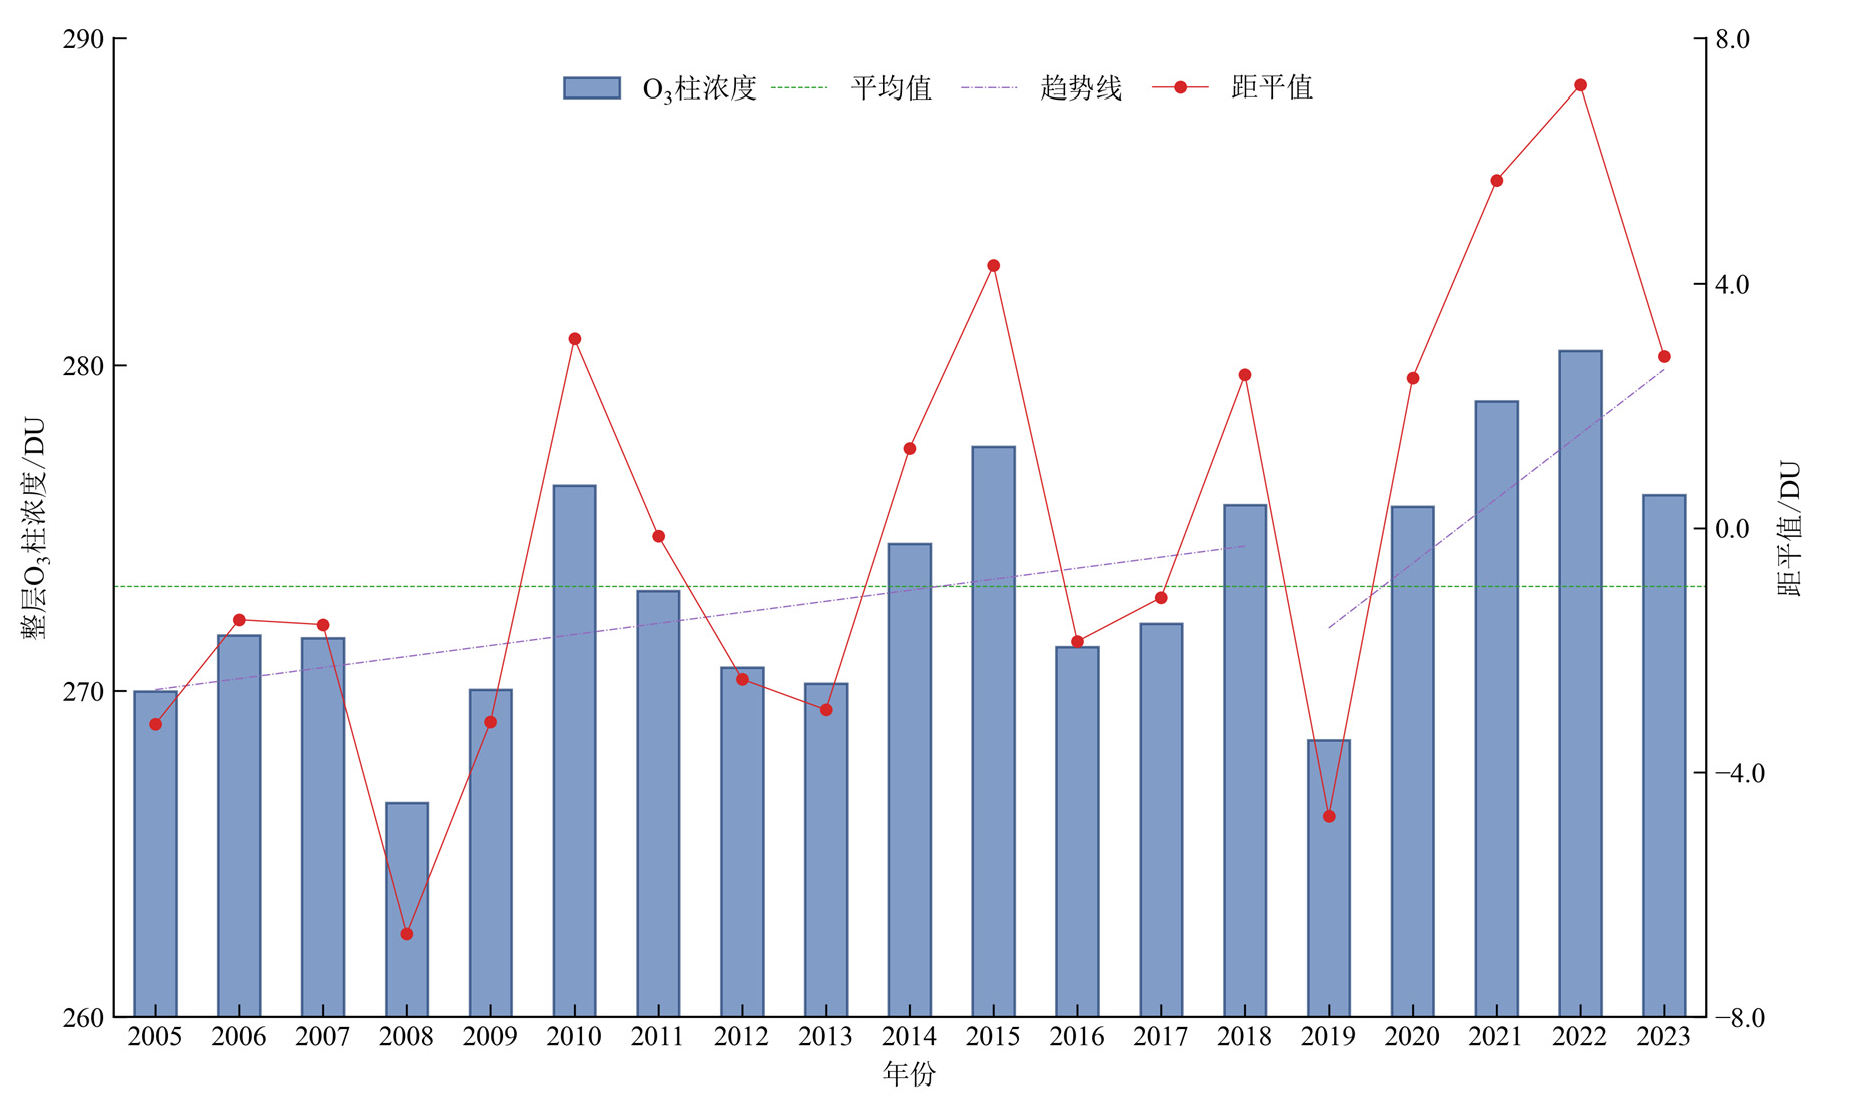
图3 2005-2023年江西省整层O3柱浓度年均值变化趋势
Figure 3 Variations in annual-mean total O3 column concentrations in Jiangxi Province from 2005 to 2023
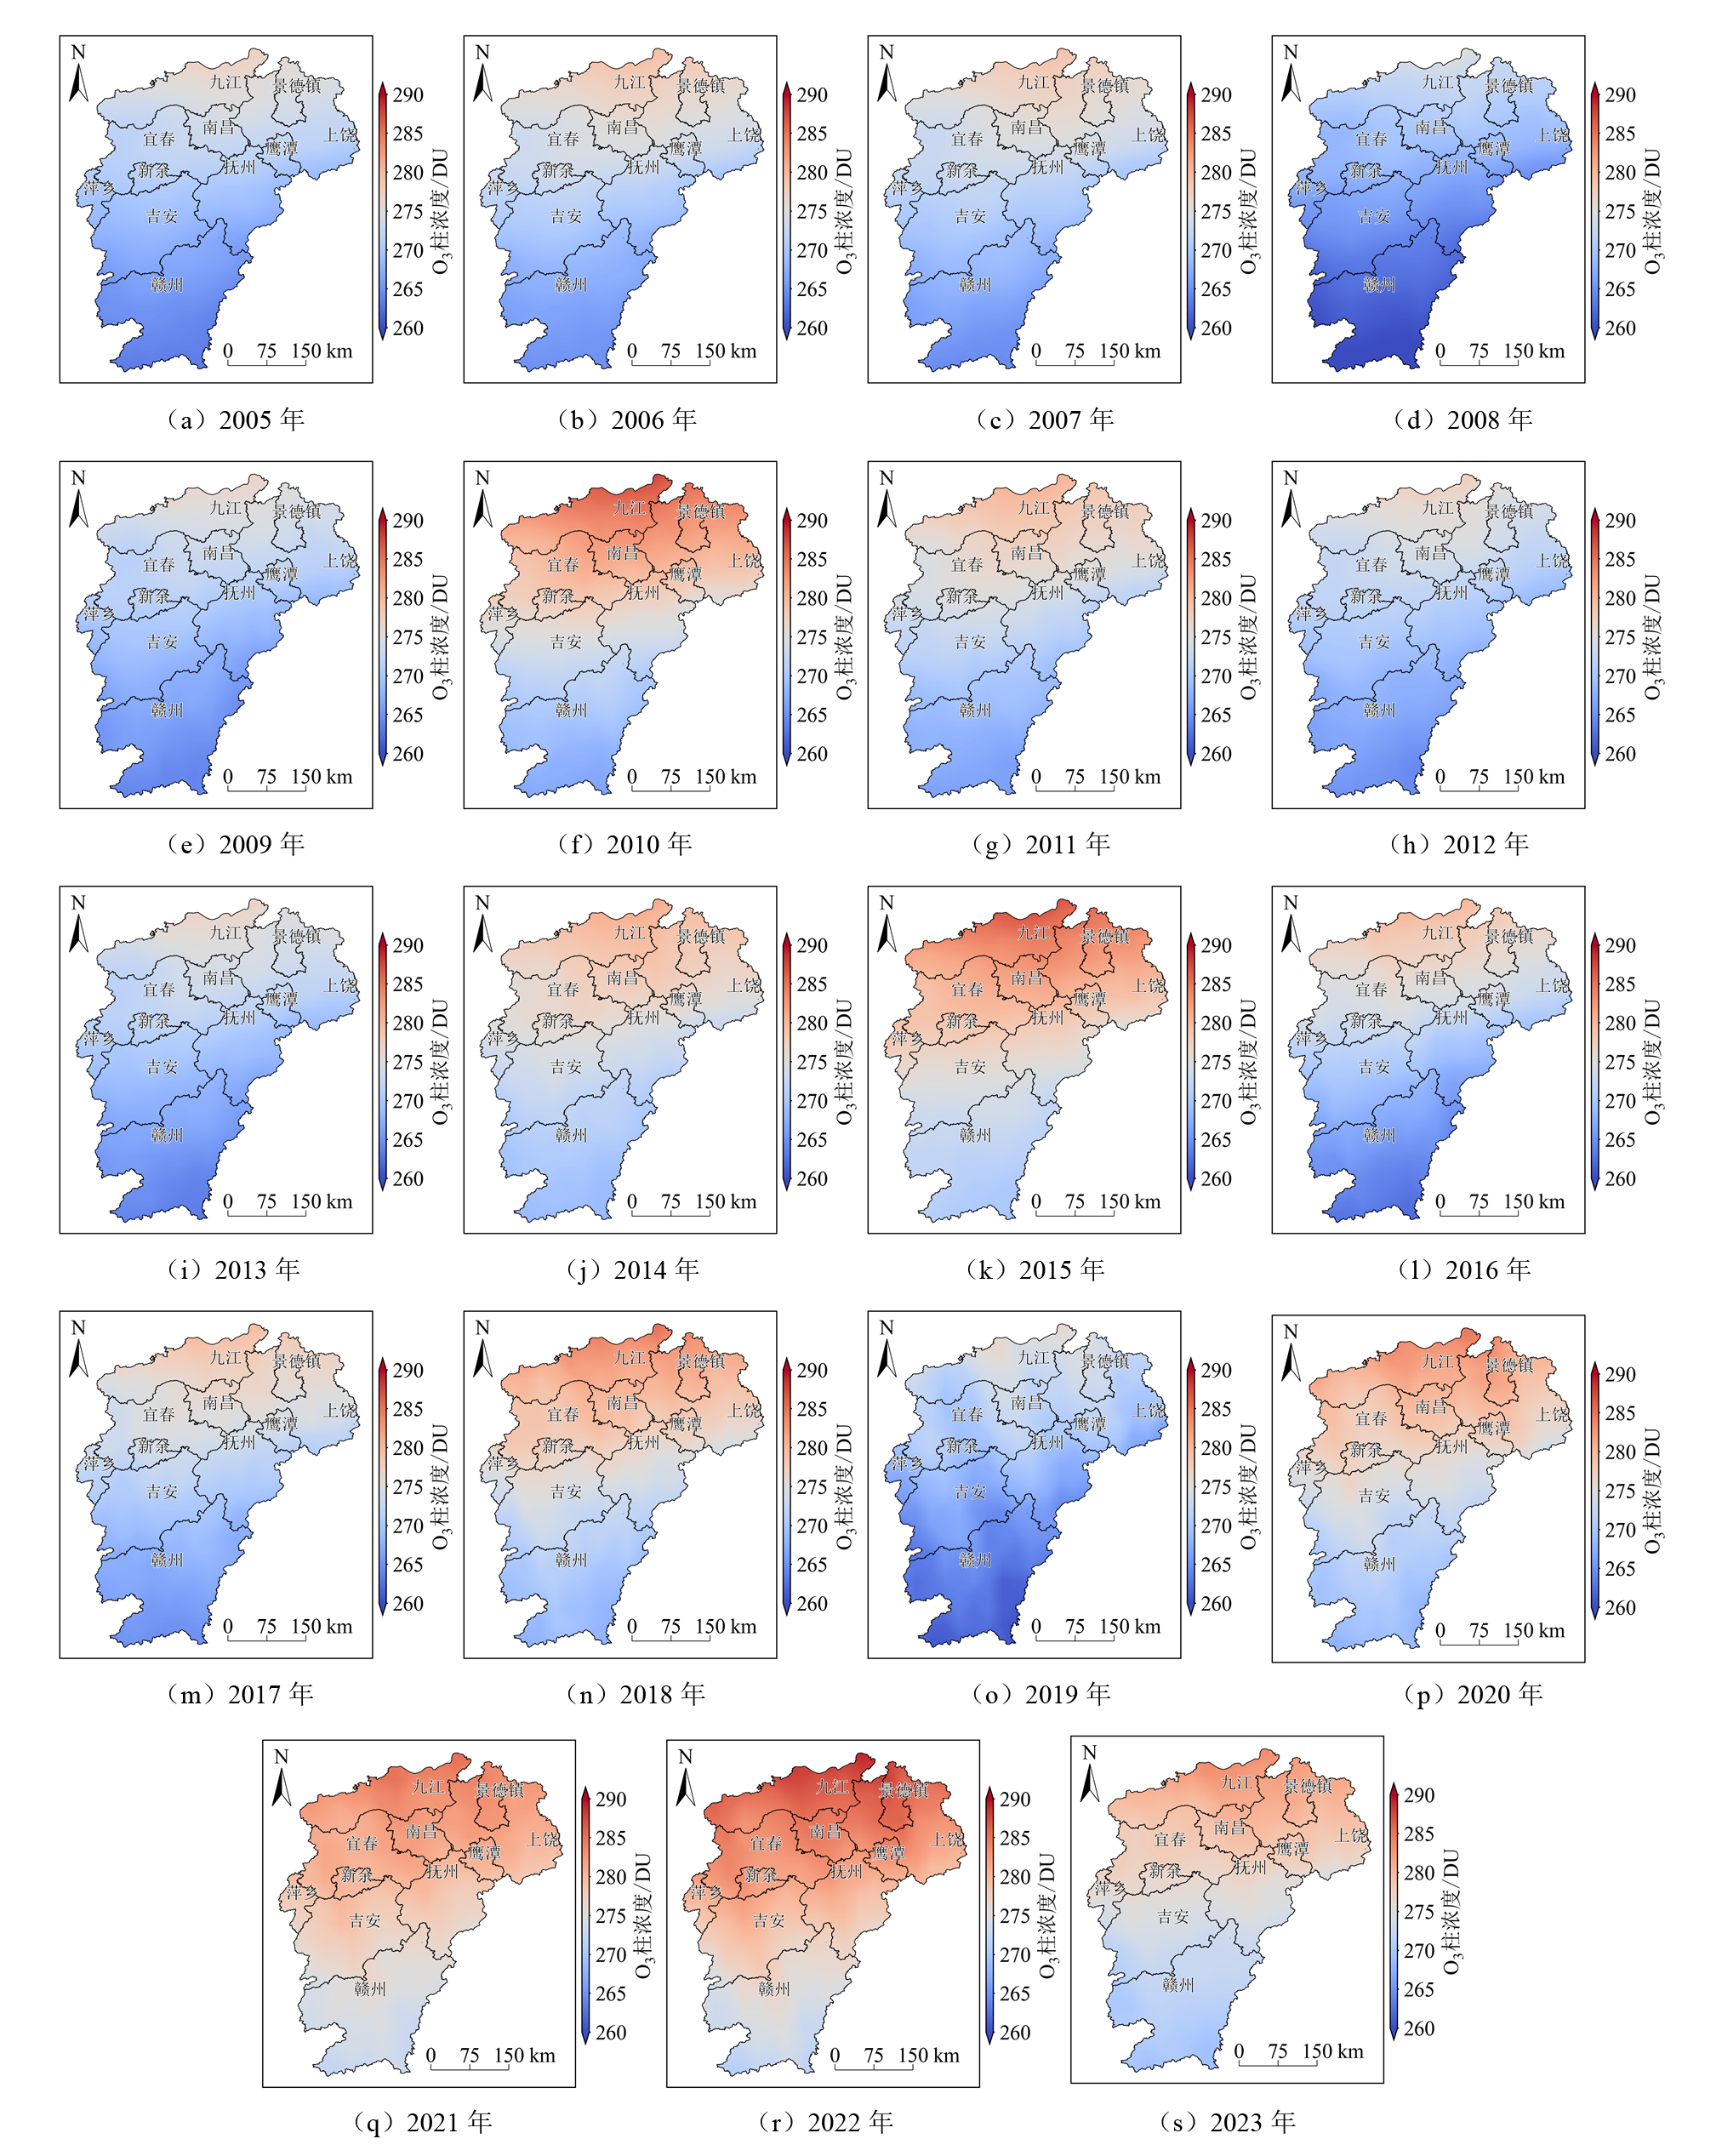
图4 2005-2023年江西省整层O3柱浓度年均值空间分布
Figure 4 Annual distributions of total O3 column concentrations in Jiangxi Province from 2005 to 2023
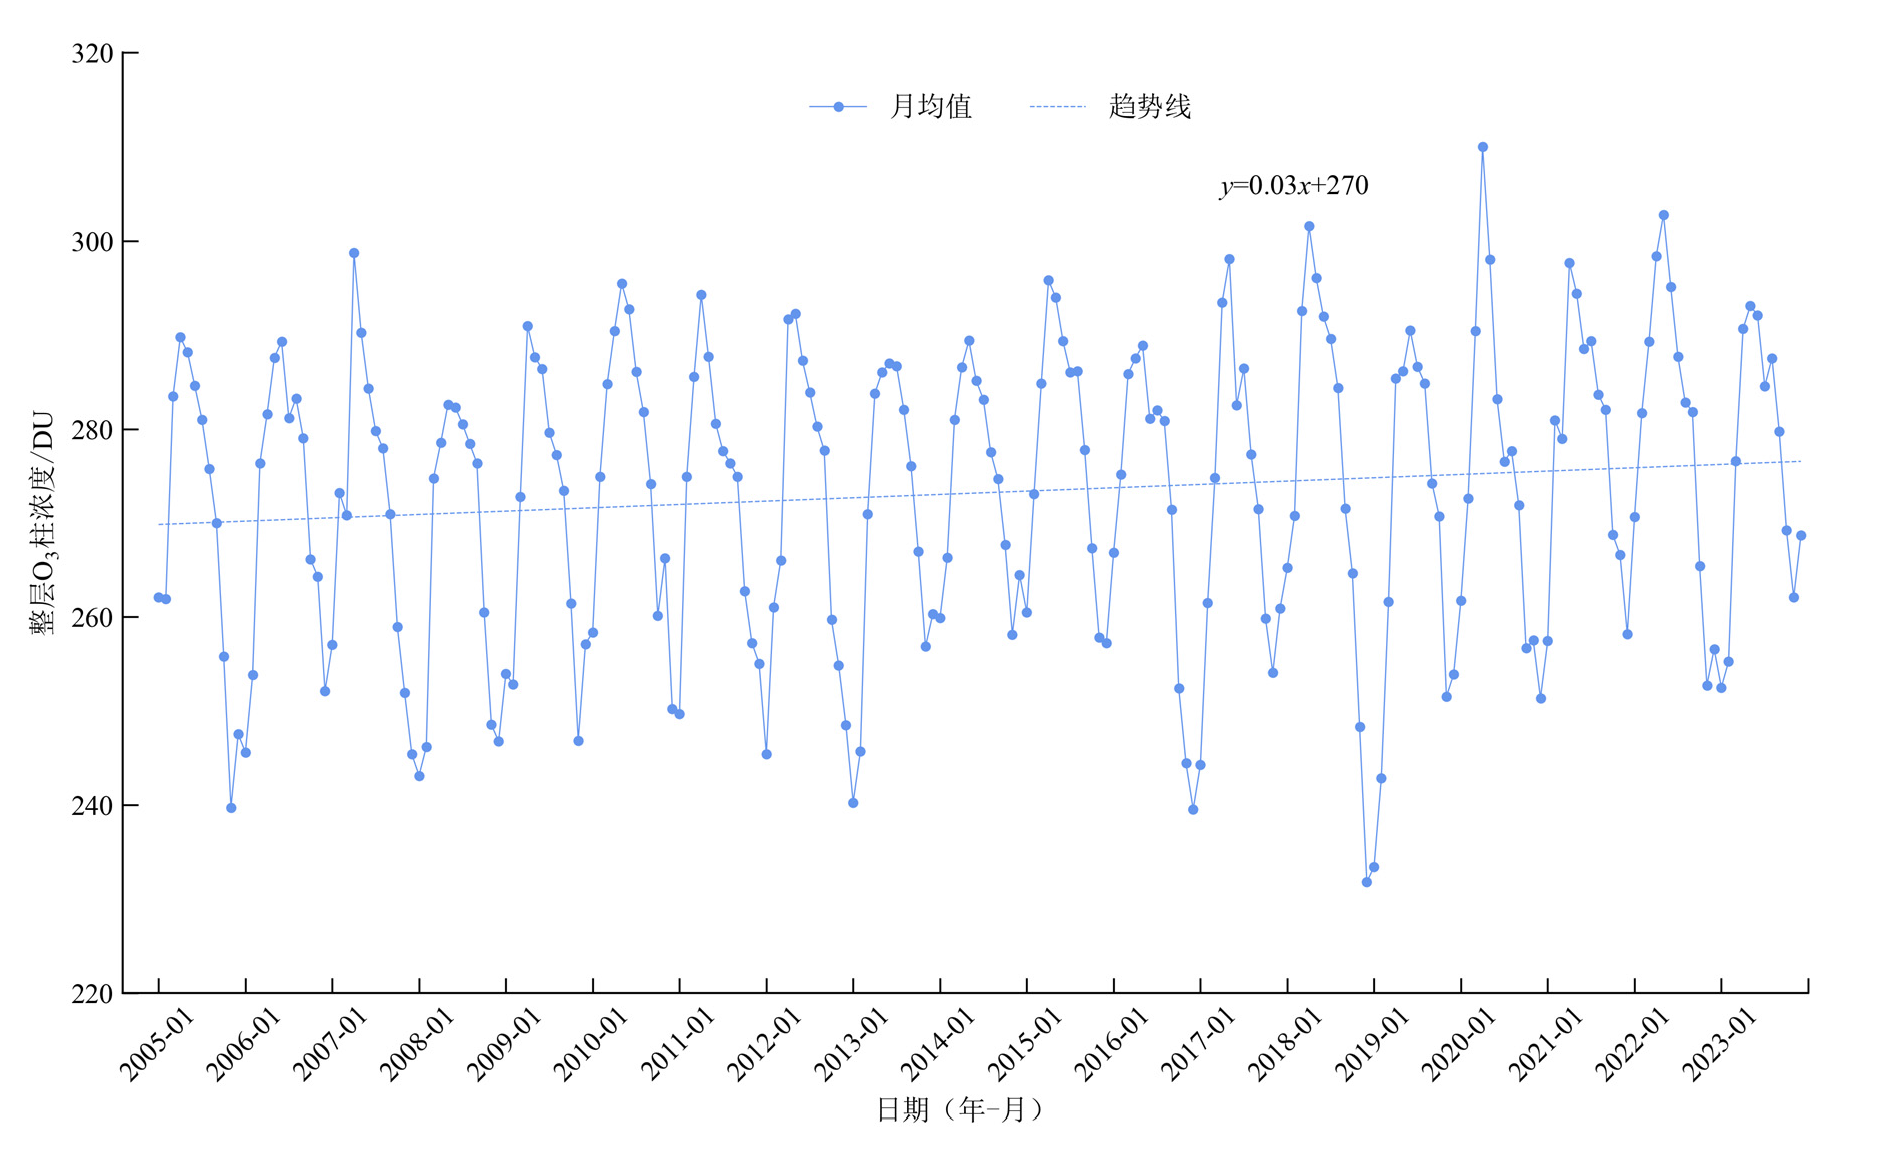
图5 2005-2023年江西省整层O3柱浓度月均值变化趋势
Figure 5 Variations in monthly-mean total O3 column concentrations in Jiangxi Province from 2005 to 2023

图6 2005-2023年江西省整层O3柱浓度月均值空间分布
Figure 6 Distributions in monthly-mean total O3 column concentrations in Jiangxi Province from 2005 to 2023

图7 2005-2023年江西省整层O3柱浓度逐年季均值变化 y1-y4分别对应春季、夏季、秋季、冬季
Figure 7 Seasonal variations in total O3 column concentrations in Jiangxi Province from 2005 to 2023

图8 2005-2023年江西省整层O3柱浓度季均值空间分布
Figure 8 Seasonal distributions of total O3 column concentrations in Jiangxi Province from 2005 to 2023

图9 2005-2020年江西省对流层O3柱浓度年均值变化趋势
Figure 9 Variations in annual-mean tropospheric O3 column concentrations in Jiangxi Province from 2005 to 2020

图10 2005-2020年对流层O3柱浓度月均值变化趋势
Figure 10 Variations in monthly-mean tropospheric O3 column concentrations in Jiangxi Province from 2005 to 2020

图11 2005-2020年对流层O3柱浓度逐年季均值变化 y1-y4分别对应春季、夏季、秋季、冬季
Figure 11 Seasonal variations in tropospheric O3 column concentrations in Jiangxi Province from 2005 to 2020
| O3柱层次 | 气象要素 | |||||
|---|---|---|---|---|---|---|
| 气温 | 降水量 | 气压 | 日照时数 | 相对湿度 | 风速 | |
| 整层 | 0.64** | 0.56** | −0.73** | 0.31** | 0.06** | 0.10** |
| 对流层 | 0.63** | 0.49** | −0.68** | 0.28** | 0.09** | 0.02** |
表2 整层、对流层O3柱浓度与地面站点气象因子相关系数
Table 2 Correlation coefficients between total and tropospheric O3 column concentrations and surface meteorological factors at monitoring sites
| O3柱层次 | 气象要素 | |||||
|---|---|---|---|---|---|---|
| 气温 | 降水量 | 气压 | 日照时数 | 相对湿度 | 风速 | |
| 整层 | 0.64** | 0.56** | −0.73** | 0.31** | 0.06** | 0.10** |
| 对流层 | 0.63** | 0.49** | −0.68** | 0.28** | 0.09** | 0.02** |
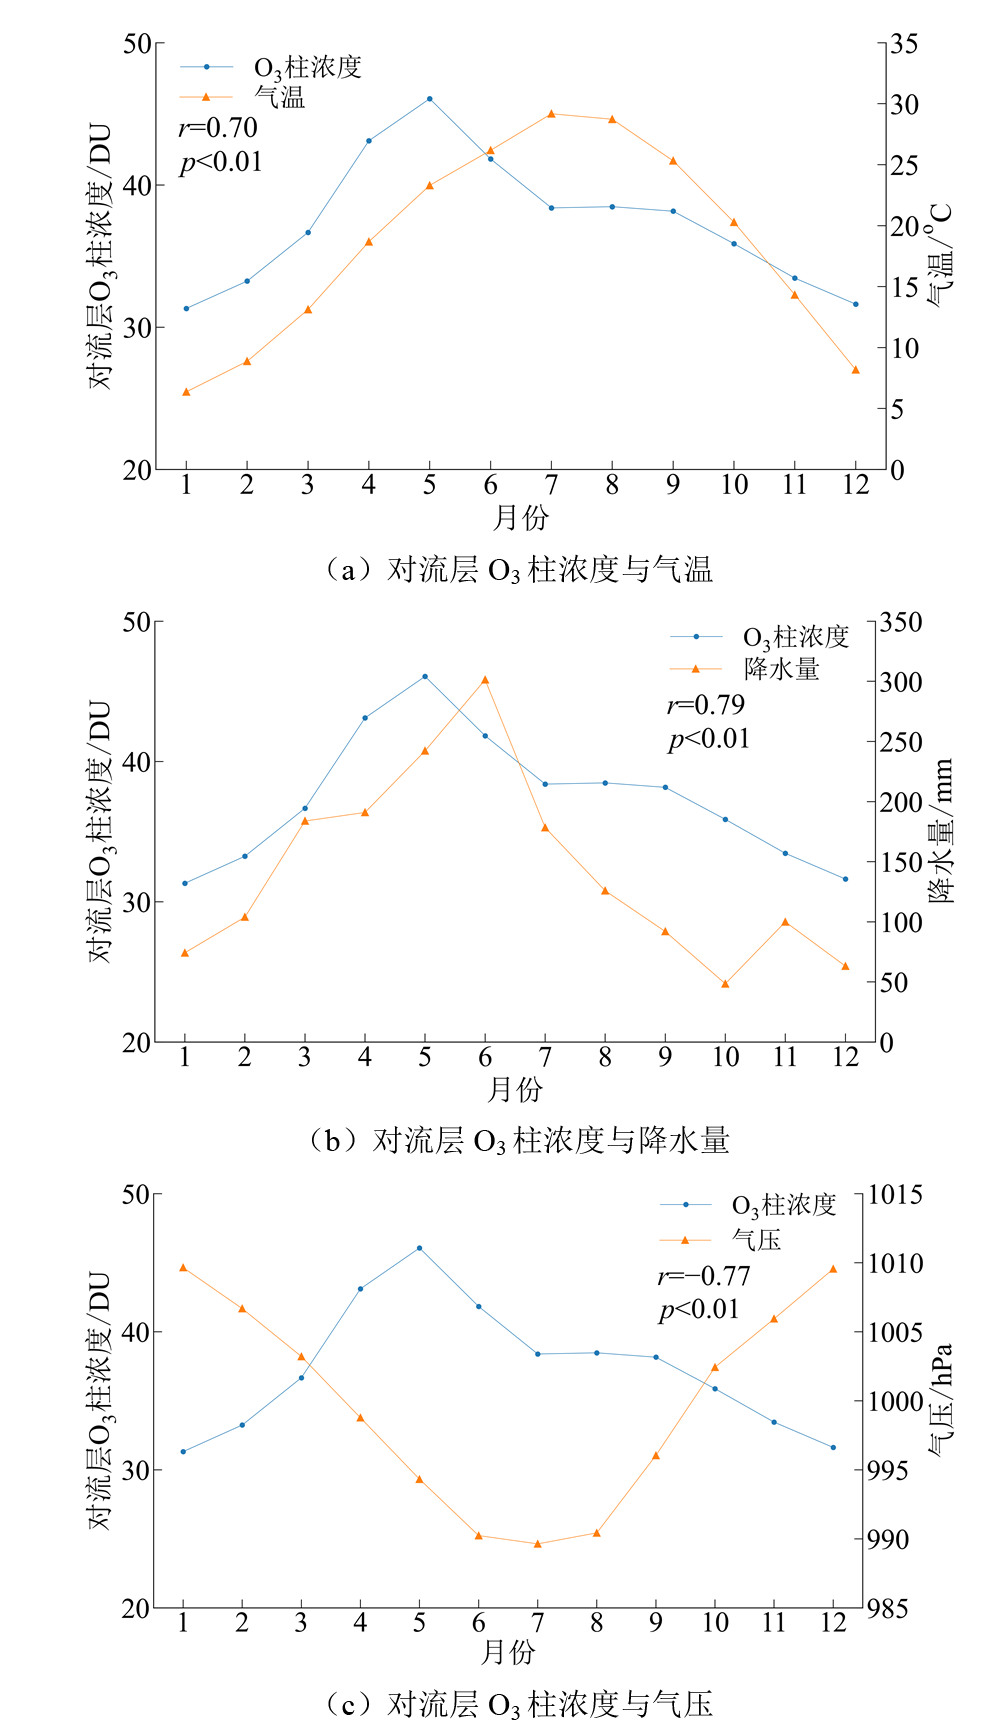
图12 2005-2020年江西省对流层O3柱浓度与气温、降水量、气压月均值变化趋势图
Figure 12 Trends in monthly-mean tropospheric O3 column concentrations and surface meteorological variables (temperature, precipitation, pressure) in Jiangxi Province from 2005 to 2020
| O3柱层次 | 人为因素 | ||||||||
|---|---|---|---|---|---|---|---|---|---|
| 生产总值 | 第一产业 | 第二产业 | 第三产业 | 人口数 | 能源消费总量 | NOx排放量 | NOx排放量(工业) | NOx排放量(机动车) | |
| 整层 | 0.61** | 0.59** | 0.62** | 0.60** | 0.50** | 0.59** | −0.46** | −0.41** | −0.50** |
| 对流层 | 0.87** | 0.86** | 0.87** | 0.85** | 0.77** | 0.86** | −0.53** | −0.63** | −0.13** |
表3 整层、对流层O3柱浓度与人为因素相关系数
Table 3 Correlation coefficients between total and tropospheric O3 column concentrations and human factors
| O3柱层次 | 人为因素 | ||||||||
|---|---|---|---|---|---|---|---|---|---|
| 生产总值 | 第一产业 | 第二产业 | 第三产业 | 人口数 | 能源消费总量 | NOx排放量 | NOx排放量(工业) | NOx排放量(机动车) | |
| 整层 | 0.61** | 0.59** | 0.62** | 0.60** | 0.50** | 0.59** | −0.46** | −0.41** | −0.50** |
| 对流层 | 0.87** | 0.86** | 0.87** | 0.85** | 0.77** | 0.86** | −0.53** | −0.63** | −0.13** |
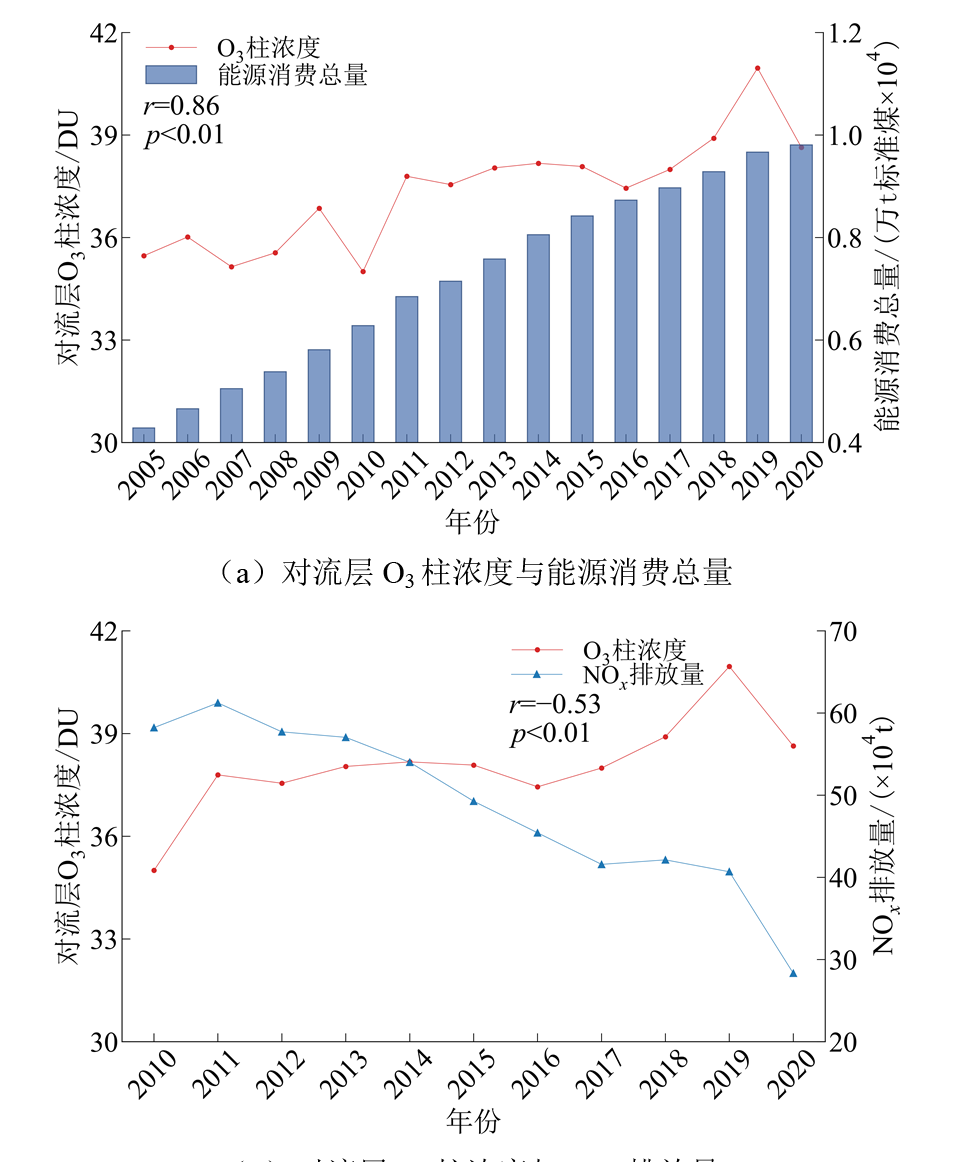
图13 江西省对流层O3柱浓度与能源消费总量、NOx排放量年均值变化趋势
Figure 13 Trends in annual-mean tropospheric O3 column concentrations, total energy consumption, and nitrogen oxide emissions in Jiangxi Province
| [1] |
CHANG K L, PETROPAVLOVSKIKH I, COOPER O R, et al., 2017. Regional trend analysis of surface ozone observations from monitoring networks in eastern North America, Europe and East Asia[J]. Elementa: Science of the Anthropocene, 5: 50.
DOI URL |
| [2] |
CHEN X, ZHONG B Q, HUANG F X, et al., 2020. The role of natural factors in constraining long-term tropospheric ozone trends over Southern China[J]. Atmospheric Environment, 220: 117060.
DOI URL |
| [3] |
FLEMING Z L, DOHERTY R M, SCHNEIDEMESSER E V, et al., 2018. Tropospheric ozone assessment report: Present-day ozone distribution and trends relevant to human health[J]. Elementa: Science of the Anthropocene, 6: 12.
DOI URL |
| [4] | LEFOHN A S, MALLEY C S, SMITH L, et al., 2018. Tropospheric ozone assessment report: Global ozone metrics for climate change, human health, and crop/ecosystem research[J]. Elementa: Science of the Anthropocene, 6: 27. |
| [5] |
LI J, 2020. Pollution trends in China from 2000 to 2017: A multi-sensor view from space[J]. Remote Sensing, 12(2): 208.
DOI URL |
| [6] |
LI X, LI Y J, MA Q M, et al., 2019. Spatial and temporal variation of total and tropospheric ozone columns over China[J]. The International Archives of the Photogrammetry, Remote Sensing and Spatial Information Sciences, XLII-3/W9: 113-118.
DOI URL |
| [7] | LIAO Z H, LING Z H, GAO M, et al., 2021. Tropospheric ozone variability over Hong Kong based on recent 20 years (2000-2019) ozonesonde observation[J]. Journal of Geophysical Research: Atmospheres, 126(3): e2020JD033054. |
| [8] | LIU J H, STRODE S A, LIANG Q, et al., 2022. Change in tropospheric ozone in the recent decades and its contribution to global total ozone[J]. Journal of Geophysical Research: Atmospheres, 127(22): e2022JD037170. |
| [9] | LU X, HONG J Y, ZHANG L, et al., 2018. Severe surface ozone pollution in China: A global perspective[J]. Environmental Science & Technology Letters, 5(8): 487-494. |
| [10] |
MATYSSEK R, KARNOSKY D F, WIESER G, et al., 2010. Advances in understanding ozone impact on forest trees: Messages from novel phytotron and free-air fumigation studies[J]. Environmental Pollution, 158(6): 1990-2006.
DOI PMID |
| [11] |
MONKS P S, 2000. A review of the observations and origins of the spring ozone maximum[J]. Atmospheric Environment, 34(21): 3545-3561.
DOI URL |
| [12] | ORTE P F, LUCCINI E, WOLFRAM E, et al., 2020. Comparison of OMI-DOAS total ozone column with ground-based measurements in Argentina[J]. Revista De Teledetección, 57: 13-23. |
| [13] |
QIN M M, HU A Q, MAO J J, et al., 2022. PM2.5 and O3 relationships affected by the atmospheric oxidizing capacity in the Yangtze River Delta, China[J]. Science of The Total Environment, 810: 152268.
DOI URL |
| [14] |
SUN H T, SHIN Y M, XIA M T, et al., 2022. Spatial resolved surface ozone with urban and rural differentiation during 1990-2019: A space-time bayesian neural network downscaler[J]. Environmental Science & Technology, 56(11): 7337-7349.
DOI URL |
| [15] |
WANG T, XUE L K, BRIMBLECOMBE P, et al., 2017. Ozone pollution in China: A review of concentrations, meteorological influences, chemical precursors, and effects[J]. Science of The Total Environment, 575: 1582-1596.
DOI URL |
| [16] |
WU K, YANG X Y, CHEN D A, et al., 2020. Estimation of biogenic VOC emissions and their corresponding impact on ozone and secondary organic aerosol formation in China[J]. Atmospheric Research, 231: 104656.
DOI URL |
| [17] |
XIANG S L, LIU J F, TAO W, et al., 2020. Control of both PM2.5 and O3 in Beijing-Tianjin-Hebei and the surrounding areas[J]. Atmospheric Environment, 224: 117259.
DOI URL |
| [18] |
ZHU L, LIU M X, SONG J Y, 2022. Spatiotemporal variations and influent factors of tropospheric ozone concentration over China based on OMI data[J]. Atmosphere, 13(2): 253.
DOI URL |
| [19] | ZIEMKE J R, CHANDRA S, DUNCAN B N, et al., 2006. Tropospheric ozone determined from Aura OMI and MLS: Evaluation of measurements and comparison with the Global Modeling Initiative’s chemical transport model[J]. Journal of Geophysical Research: Atmospheres, 111(D19): 2006JD007089. |
| [20] |
ZIEMKE J R, OLSEN M A, WITTE J C, et al., 2014. Assessment and applications of NASA ozone data products derived from Aura OMI/MLS satellite measurements in context of the GMI chemical transport model[J]. Journal of Geophysical Research: Atmospheres, 119(9): 5671-5699.
DOI URL |
| [21] | 曹侃, 应旻, 魏峻山, 等, 2021. 江西省臭氧污染特征及其与气象条件的关系[J]. 中国环境监测, 37(2): 44-59. |
| CAO K, YING M, WEI J S, et al., 2021. Characteristics of ozone pollution in Jiangxi Province and its relationship with meteorological factors[J]. Environmental Monitoring in China, 37(2): 44-59. | |
| [22] | 曹培豪, 刘镇, 储险峰, 等, 2024. 江西省极端干旱下臭氧污染特征及成因分析[J]. 中国环境监测, 40(3): 98-106. |
| CAO P H, LIU Z, CHU X F, et al., 2024. Characteristics and mechanisms of the ozone pollution episode during the extreme drought in Jiangxi Province[J]. Environmental Monitoring in China, 40(3): 98-106. | |
| [23] | 曹晓云, 祁栋林, 肖建设, 等, 2021. 基于卫星观测的青海高原对流层臭氧时空分布特征研究[J]. 环境科学学报, 41(5): 1640-1648. |
| CAO X Y, QI D L, XIAO J S, et al., 2021. Temporal and spatial distribution characteristics of tropospheric ozone in Qinghai Plateau based on satellite observations[J]. Acta Scientiae Circumstantiae, 41(5): 1640-1648. | |
| [24] | 陈希, 黄富祥, 夏学齐, 等, 2015. 华北地区对流层臭氧长期变化趋势及影响因子分析[J]. 科学通报, 60(27): 2659-2666. |
| CHEN X, HUANG F X, XIA X Q, et al., 2015. Analysis of tropospheric ozone long-term changing trends and affecting factors over northern China[J]. Chinese Science Bulletin, 60(27): 2659-2666. | |
| [25] | 方小珍, 刘诚, 邓力琛, 等, 2024. 江西省近地面臭氧污染特征及成因分析[J]. 东华理工大学学报(自然科学版), 47(4): 381-390. |
| FANG X Z, LIU C, DENG L C, et al., 2024. Analysis on characteristics and causes of ground-level ozone pollution in Jiangxi Province[J]. Journal of East China University of Technology (Natural Science Edition), 47(4): 381-390. | |
| [26] | 郭云飞, 包云轩, 刘端阳, 2022. 基于卫星和地面观测的中国典型城市群对流层内臭氧时空变化特征[J]. 环境科学研究, 35(3): 719-730. |
| GUO Y F, BAO Y X, LIU D Y, 2022. Spatial-temporal variations of tropospheric ozone over typical urban agglomerations in China based on satellite and surface observations[J]. Research of Environmental Sciences, 35(3): 719-730. | |
| [27] | 侯鑫, 张霄羽, 张红, 等, 2024. 中国对流层臭氧的时空变化及影响因素研究[J]. 环境科学研究, 37(9): 1911-1919. |
| HOU X, ZHANG X Y, ZHANG H, et al., 2024. Spatiotemporal dynamics and driving factors of tropospheric ozone in China[J]. Research of Environmental Sciences, 37(9): 1911-1919. | |
| [28] | 钱悦, 许彬, 夏玲君, 等, 2021. 2016-2019年江西省臭氧污染特征与气象因子影响分析[J]. 环境科学, 42(5): 2190-2201. |
| QIAN Y, XU B, XIA L J, et al., 2021. Characteristics of ozone pollution and relationships with meteorological factors in Jiangxi Province[J]. Environmental Science, 42(5): 2190-2201. | |
| [29] | 宋佳颖, 刘旻霞, 孙瑞弟, 等, 2020. 基于OMI数据的东南沿海大气臭氧浓度时空分布特征研究[J]. 环境科学学报, 40(2): 438-449. |
| SONG J Y, LIU M X, SUN R D, et al., 2020. Temporal and spatial distribution characteristics of atmospheric ozone concentration in Southeast Coast based on OMI data[J]. Acta Scientiae Circumstantiae, 40(2): 438-449. | |
| [30] | 王扬, 刘旻霞, 宋宜凯, 等, 2023. 黄河流域大气对流层O3和NO2时空变化及来源解析[J]. 环境科学学报, 43(7): 273-285. |
| WANG Y, LIU M X, SONG Y K, et al., 2023. Spatiotemporal succession and source analysis of O3 and NO2 in troposphere over the Yellow River Basin[J]. Acta Scientiae Circumstantiae, 43(7): 273-285. | |
| [31] | 王跃启, 江洪, 肖钟湧, 等, 2009. 基于OMI数据的中国臭氧总量时空动态信息提取[J]. 环境科学与技术, 32(6): 177-180, 184. |
|
WANG Y Q, JIANG H, XIAO Z Y, et al., 2009. Extracting temporal and spatial distribution information about total ozone amount in China based on OMI satellite data[J]. Environmental Science & Technology, 32(6): 177-180, 184.
DOI URL |
|
| [32] |
翁雷霆, 王鹏, 肖荣波, 等, 2025. 2000-2022年珠三角城市群PM2.5与O3时空分布特征及其影响因素[J]. 生态环境学报, 34(2): 268-278.
DOI |
| WENG L T, WANG P, XIAO R B, et al., 2025. Spatial-temporal distribution characteristics of PM2.5 and O3 in the Pearl River Delta urban agglomeration and corresponding influence factors[J]. Ecology and Environmental Sciences, 34(2): 268-278. | |
| [33] | 肖仕锐, 刘旻霞, 李乐, 等, 2022. 河套平原O3浓度时空分布、传输路径及潜在源贡献分析[J]. 环境科学学报, 42(6): 237-249. |
| XIAO S R, LIU M X, LI L, et al., 2022. Temporal and spatial distribution, transmission path and potential source contribution of O3 concentration in Hetao Plain[J]. Acta Scientiae Circumstantiae, 42(6): 237-249. | |
| [34] |
许健, 张卓, 饶兰兰, 等, 2024. 对流层臭氧卫星遥感反演综述[J]. 地球科学进展, 39(1): 56-70.
DOI |
| XU J, ZHANG Z, RAO L L, et al., 2024. Tropospheric ozone retrieval from satellite remote sensing-A review[J]. Advances in Earth Science, 39(1): 56-70. | |
| [35] | 于瑞新, 刘旻霞, 李亮, 等, 2021. 长三角地区近15年大气臭氧柱浓度时空变化及影响因素[J]. 环境科学学报, 41(3) : 770-784. |
| YU R X, LIU M X, LI L, et al., 2021. Spatial and temporal variation of atmospheric ozone column concentration and influencing factors in the Yangtze River Delta region in recent 15 years[J]. Acta Scientiae Circumstantiae, 41(3): 770-784. | |
| [36] | 张涵, 姜华, 高健, 等, 2022. PM2.5与臭氧污染形成机制及协同防控思路[J]. 环境科学研究, 35(3): 611-620. |
| ZHANG H, JIANG H, GAO J, et al., 2022. Formation mechanism and management strategy of cooperative control of PM2.5 and O3[J]. Research of Environmental Sciences, 35(3): 611-620. | |
| [37] | 张倩倩, 张兴赢, 2019. 基于卫星和地面观测的2013年以来我国臭氧时空分布及变化特征[J]. 环境科学, 40(3): 1132-1142. |
| ZHANG Q Q, ZHANG X Y, 2019. Ozone spatial-temporal distribution and trend over China since 2013: Insight from satellite and surface observation[J]. Environmental Science, 40(3): 1132-1142. | |
| [38] |
张莹, 高玚, 祝善友, 等, 2014. 近30 a中国上空臭氧总量时空变化遥感监测分析[J]. 地球信息科学学报, 16(6): 971-978.
DOI |
| ZHANG Y, GAO Y, ZHU S Y, et al., 2014. Variation of total ozone over China for 30 years analyzed by multi-source satellite remote sensing data[J]. Journal of Geo-information Science, 16(6): 971-978. | |
| [39] | 中华人民共和国环境保护部, 2012. 环境空气质量指数 (AQI) 技术规定 (试行): HJ 633—2012 [S]. 北京: 中国环境科学出版社. |
| Ministry of Environmental Protection of the People’s Republic of China, 2012. Technical regulation on ambient air quality index (on trial): HJ 633—2012 [S]. Beijing: China Environmental Science Press. |
| [1] | 程虎, 李逸, 陈子墨, 黄言秋, 闵炬, 施卫明, 张龙江, 纪荣婷. 新型城镇化与美丽中国建设协调度研究——以江苏省为例[J]. 生态环境学报, 2026, 35(1): 29-39. |
| [2] | 李伊涵, 王火根, 肖小玮. 基于系统动力学的江西省碳排放预测与减排路径研究[J]. 生态环境学报, 2025, 34(9): 1351-1360. |
| [3] | 祁珣, 冯鑫鑫, 陈颖军, 冯艳丽, 陈田, 李军, 张干. 轻型汽油卡车尾气颗粒物中氨和有机胺的排放特征及影响因素[J]. 生态环境学报, 2025, 34(7): 997-1006. |
| [4] | 郝晓燕, 董超, 薛阳, 韩丽萍. 能源禀赋优势区能源供给与生态安全共生效应及影响因素[J]. 生态环境学报, 2025, 34(6): 974-985. |
| [5] | 陈洁茹, 叶长盛, 魏嶶, 蔡鑫, 汪礼丽. 环鄱阳湖城市群县域“三生空间”耦合协调性及影响因素分析[J]. 生态环境学报, 2025, 34(5): 807-818. |
| [6] | 郭铭彬, 龚建周, 王丽娟, 王时宽. 2019-2023年粤港澳大湾区NO2浓度变化的自然主控因子解析[J]. 生态环境学报, 2025, 34(4): 534-547. |
| [7] | 翁雷霆, 王鹏, 肖荣波, 白晋晶, 钟俊宏. 2000-2022年珠三角城市群PM2.5与O3时空分布特征及其影响因素[J]. 生态环境学报, 2025, 34(2): 268-278. |
| [8] | 王春梅, 姜炳棋, 胡俊, 陈代文, 黄丽华, 程湾湾. 核电厂周边大气环境总放射性多尺度变化及影响因素[J]. 生态环境学报, 2025, 34(12): 1900-1908. |
| [9] | 夏依宁, 刘鹏翱, 何柯润, 田朝晖, 曾丽婷, 侯珂伦. 基于土地利用的长株潭都市圈碳储量时空格局与情景模拟[J]. 生态环境学报, 2025, 34(11): 1661-1674. |
| [10] | 孔小云, 张永坤, 李润杰, 李颖, 林成清, 马占明, 辛继林, 杨晓璇, 党怡乐, 赵家艺, 冯玲正, 周燕. 湟水河流域耕地土壤团聚体有机碳空间变异特征及其驱动因素分析[J]. 生态环境学报, 2025, 34(11): 1715-1727. |
| [11] | 尤琪, 杨艺, 张寅清, 祝凌燕. 纳米银颗粒在水环境中的化学转化及影响因素[J]. 生态环境学报, 2025, 34(1): 156-166. |
| [12] | 张维琛, 王惺琪, 王博杰. 塔布河流域生态系统服务时空格局及影响因素分析[J]. 生态环境学报, 2024, 33(7): 1142-1152. |
| [13] | 李程, 程志鹏, 刘育金, 姚义鸣, 李春雷. 全(多)氟烷基化合物生态风险及其管控政策研究[J]. 生态环境学报, 2024, 33(6): 980-996. |
| [14] | 梁燕, 刘家齐, 肖凡, 潘民萍, 韦凯文, 张楚雯, 段敏. 氮沉降形态对西南岩溶区森林土壤有效磷来源的影响[J]. 生态环境学报, 2024, 33(2): 192-201. |
| [15] | 罗小玲, 刘军, 王琦, 刘同旭, 梁耀杰, 谢志宜, 王中伟, 陈多宏. 2016年以来广东省不同土地利用类型土壤pH和有机质时空变化及其影响因素分析[J]. 生态环境学报, 2024, 33(12): 1849-1861. |
| 阅读次数 | ||||||
|
全文 |
|
|||||
|
摘要 |
|
|||||