生态环境学报 ›› 2026, Vol. 35 ›› Issue (1): 112-123.DOI: 10.16258/j.cnki.1674-5906.2026.01.010
杜若愚( ), 马潇瑶, 陈江耀*()
收稿日期:2025-04-24
修回日期:2025-09-15
接受日期:2025-10-20
出版日期:2026-01-18
发布日期:2026-01-05
通讯作者:
* E-mail: 作者简介:杜若愚(2000年生),男,硕士研究生,主要研究方向为大气环境。E-mail: 852709866@qq.com
基金资助:
DU Ruoyu(), MA Xiaoyao, CHEN Jiangyao*()
Received:2025-04-24
Revised:2025-09-15
Accepted:2025-10-20
Online:2026-01-18
Published:2026-01-05
摘要: 挥发性有机物(VOCs)作为臭氧(O3)和二次有机气溶胶(SOA)的关键前体物,其在大气中的光化学行为对城市空气质量影响至关重要。然而,传统基于观测体积分数(VOCM)的环境效应评估方法因忽略VOCs的光化学损耗,往往导致其环境贡献被低估。于2024年8-10月在广州大学城采用NO+ PTR-QMS技术对VOCs进行了高时间分辨率的在线监测,克服了传统PTR-MS对烷烃检测的局限性。结果表明,观测期间广州市大气VOCs平均体积分数为(29.0±0.73)×10−9,主要组分为烷烃(33.6%)、芳香烃(26.6%)和OVOCs(24.7%),其日间变化呈现与早晚交通高峰活动一致的双峰型特征。VOCs的整体光化学损失率(VOCL)高达22.3%,其中烯烃损失率最高(50.5%)。考虑光化学损失后,基于VOCM的传统评估方法显著低估了VOCs的真实环境效应:臭氧生成潜势(OFP)被低估了35.5%,主要由高活性烯烃(丁二烯44.2%、丁烯17.5%)驱动;二次有机气溶胶生成潜势(SOAP)被低估了33.7%,主要由高SOA产率芳烃(苯乙烯73.4%、C9/C8芳香烃)驱动。研究强调,准确评估VOCs环境效应需考虑光化学损失,优先控制高活性烯烃可有效削减O3生成,而控制高产率芳香烃是降低SOA污染的关键,这为广州市制定精准VOCs减排策略及O3与PM2.5协同控制提供了科学依据。
中图分类号:
杜若愚, 马潇瑶, 陈江耀. 基于NO+ PTR-QMS在线观测评估广州市夏季大气VOCs的光化学损失及二次环境效应[J]. 生态环境学报, 2026, 35(1): 112-123.
DU Ruoyu, MA Xiaoyao, CHEN Jiangyao. Photochemical Loss and Secondary Environmental Effects of Summer Atmospheric VOCs in Guangzhou: An Assessment via NO+ PTR-QMS Online Observations[J]. Ecology and Environmental Sciences, 2026, 35(1): 112-123.
| 参数 | 2024-08-06-2024-08-13 | 2024-09-24-2024-09-30 | 2024-10-15-2024-10-21 |
|---|---|---|---|
| AQI | 44.76±9.55 | 39.13±12.57 | 40.92±9.96 |
| PM2.5质量浓度/(μg∙m−3) | 29.33±9.37 | 21.44±7.87 | 22.84±6.69 |
| PM10质量浓度/(μg∙m−3) | 48.33±8.02 | 36.63±12.26 | 40.37±11.29 |
| NO2质量浓度/(μg∙m−3) | 29.05±10.46 | 28.82±10.94 | 26.60 ±11.61 |
| SO2质量浓度/(μg∙m−3) | 5.75±0.55 | 6.24±0.85 | 6.27±0.68 |
| O3质量浓度/(μg∙m−3) | 70.79±47.54 | 63.77±51.45 | 67.28±40.10 |
| CO质量浓度/(μg∙m−3) | 0.72±0.08 | 0.72±0.09 | 0.71±0.05 |
| 温度/℃ | 31.51±3.03 | 30.66±2.78 | 29.67±2.53 |
| 相对湿度/% | 74.51±13.05 | 82.48±10.63 | 79.51±12.54 |
| 紫外线强度/(W∙m−2) | 12.55±15.58 | 9.05±11.66 | 10.33±13.35 |
| 大气压/hPa | 1002.86±3.03 | 1004.56±1.75 | 1003.63±3.27 |
| 风速/(m∙s−1) | 0.86±0.42 | 0.96 ± 0.63 | 0.91±0.54 |
表1 观测期间常规污染物浓度及气象参数
Table 1 Concentrations of conventional pollutants and meteorological parameters during the observation period
| 参数 | 2024-08-06-2024-08-13 | 2024-09-24-2024-09-30 | 2024-10-15-2024-10-21 |
|---|---|---|---|
| AQI | 44.76±9.55 | 39.13±12.57 | 40.92±9.96 |
| PM2.5质量浓度/(μg∙m−3) | 29.33±9.37 | 21.44±7.87 | 22.84±6.69 |
| PM10质量浓度/(μg∙m−3) | 48.33±8.02 | 36.63±12.26 | 40.37±11.29 |
| NO2质量浓度/(μg∙m−3) | 29.05±10.46 | 28.82±10.94 | 26.60 ±11.61 |
| SO2质量浓度/(μg∙m−3) | 5.75±0.55 | 6.24±0.85 | 6.27±0.68 |
| O3质量浓度/(μg∙m−3) | 70.79±47.54 | 63.77±51.45 | 67.28±40.10 |
| CO质量浓度/(μg∙m−3) | 0.72±0.08 | 0.72±0.09 | 0.71±0.05 |
| 温度/℃ | 31.51±3.03 | 30.66±2.78 | 29.67±2.53 |
| 相对湿度/% | 74.51±13.05 | 82.48±10.63 | 79.51±12.54 |
| 紫外线强度/(W∙m−2) | 12.55±15.58 | 9.05±11.66 | 10.33±13.35 |
| 大气压/hPa | 1002.86±3.03 | 1004.56±1.75 | 1003.63±3.27 |
| 风速/(m∙s−1) | 0.86±0.42 | 0.96 ± 0.63 | 0.91±0.54 |
| 序号 | 质荷比(m/z) | VOCs组分 | 离子式 | 类别 | 灵敏度(cps) | 相关性(r2) | 背景值(cps) | 检测限/(μg∙m−3) |
|---|---|---|---|---|---|---|---|---|
| 1 | 54 | 丁二烯 | C4H6+ | 烯烃 | 70.68 | 0.999 | 11.30 | 0.021 |
| 2 | 56 | 丁烯 | C4H8+ | 烯烃 | 131.23 | 0.998 | 5.13 | 0.011 |
| 3 | 57 | 丁烷 | C4H9+ | 烷烃 | 540.16 | 0.991 | 11.82 | 0.003 |
| 4 | 59 | 异丙醇 | C3H7O+ | OVOCs | 202.97 | 0.951 | 21.70 | 0.007 |
| 5 | 70 | 戊烯 | C5H10+ | 烯烃 | 94.49 | 0.999 | 4.07 | 0.015 |
| 6 | 71 | 戊烷 | C5H11+ | 烷烃 | 330.59 | 0.993 | 16.96 | 0.005 |
| 7 | 78 | 苯 | C6H6+ | 芳香烃 | 44.16 | 0.994 | 2.72 | 0.034 |
| 8 | 83 | 甲基环戊烷 | C6H11+ | 烷烃 | 32.77 | 0.988 | 3.23 | 0.046 |
| 9 | 84 | 己烯 | C6H12+ | 烯烃 | 10.77 | 0.997 | 2.41 | 0.139 |
| 10 | 85 | 甲基戊烷 | C6H13+ | 烷烃 | 95.8 | 0.989 | 4.31 | 0.016 |
| 11 | 88 | 丙酮 | C3H6NO2+ | OVOCs | 16.36 | 0.982 | 3.76 | 0.092 |
| 12 | 92 | 甲苯 | C7H8+ | 芳香烃 | 81.19 | 0.995 | 3.44 | 0.018 |
| 13 | 97 | 甲基环己烷 | C7H13+ | 烷烃 | 35.86 | 0.998 | 4.27 | 0.042 |
| 14 | 99 | 甲基己烷 | C7H15+ | 烷烃 | 13.51 | 0.974 | 4.00 | 0.111 |
| 15 | 102 | 丁酮 | C4H8NO2+ | 烯烃 | 15.59 | 0.995 | 2.57 | 0.096 |
| 16 | 104 | 苯乙烯 | C8H8+ | 芳香烃 | 33.02 | 0.998 | 4.04 | 0.045 |
| 17 | 106 | C8芳香烃 | C8H10+ | 烷烃 | 312.17 | 0.991 | 5.64 | 0.005 |
| 18 | 113 | 甲基庚烷 | C8H17+ | OVOCs | 13.47 | 0.985 | 2.94 | 0.111 |
| 19 | 120 | C9芳香烃 | C9H12+ | 芳香烃 | 479.03 | 0.990 | 12.94 | 0.003 |
| 20 | 130 | 己酮 | C6H12NO2+ | OVOCs | 31.02 | 0.998 | 2.16 | 0.048 |
| 21 | 134 | C10芳香烃 | C10H14+ | 芳香烃 | 59.2 | 0.995 | 2.45 | 0.025 |
表2 NO+ PTR-QMS检测物质名称、类别、灵敏度和检测限
Table 2 Names, categories, sensitivities, and detection limits of substances detected by NO? PTR-QMS
| 序号 | 质荷比(m/z) | VOCs组分 | 离子式 | 类别 | 灵敏度(cps) | 相关性(r2) | 背景值(cps) | 检测限/(μg∙m−3) |
|---|---|---|---|---|---|---|---|---|
| 1 | 54 | 丁二烯 | C4H6+ | 烯烃 | 70.68 | 0.999 | 11.30 | 0.021 |
| 2 | 56 | 丁烯 | C4H8+ | 烯烃 | 131.23 | 0.998 | 5.13 | 0.011 |
| 3 | 57 | 丁烷 | C4H9+ | 烷烃 | 540.16 | 0.991 | 11.82 | 0.003 |
| 4 | 59 | 异丙醇 | C3H7O+ | OVOCs | 202.97 | 0.951 | 21.70 | 0.007 |
| 5 | 70 | 戊烯 | C5H10+ | 烯烃 | 94.49 | 0.999 | 4.07 | 0.015 |
| 6 | 71 | 戊烷 | C5H11+ | 烷烃 | 330.59 | 0.993 | 16.96 | 0.005 |
| 7 | 78 | 苯 | C6H6+ | 芳香烃 | 44.16 | 0.994 | 2.72 | 0.034 |
| 8 | 83 | 甲基环戊烷 | C6H11+ | 烷烃 | 32.77 | 0.988 | 3.23 | 0.046 |
| 9 | 84 | 己烯 | C6H12+ | 烯烃 | 10.77 | 0.997 | 2.41 | 0.139 |
| 10 | 85 | 甲基戊烷 | C6H13+ | 烷烃 | 95.8 | 0.989 | 4.31 | 0.016 |
| 11 | 88 | 丙酮 | C3H6NO2+ | OVOCs | 16.36 | 0.982 | 3.76 | 0.092 |
| 12 | 92 | 甲苯 | C7H8+ | 芳香烃 | 81.19 | 0.995 | 3.44 | 0.018 |
| 13 | 97 | 甲基环己烷 | C7H13+ | 烷烃 | 35.86 | 0.998 | 4.27 | 0.042 |
| 14 | 99 | 甲基己烷 | C7H15+ | 烷烃 | 13.51 | 0.974 | 4.00 | 0.111 |
| 15 | 102 | 丁酮 | C4H8NO2+ | 烯烃 | 15.59 | 0.995 | 2.57 | 0.096 |
| 16 | 104 | 苯乙烯 | C8H8+ | 芳香烃 | 33.02 | 0.998 | 4.04 | 0.045 |
| 17 | 106 | C8芳香烃 | C8H10+ | 烷烃 | 312.17 | 0.991 | 5.64 | 0.005 |
| 18 | 113 | 甲基庚烷 | C8H17+ | OVOCs | 13.47 | 0.985 | 2.94 | 0.111 |
| 19 | 120 | C9芳香烃 | C9H12+ | 芳香烃 | 479.03 | 0.990 | 12.94 | 0.003 |
| 20 | 130 | 己酮 | C6H12NO2+ | OVOCs | 31.02 | 0.998 | 2.16 | 0.048 |
| 21 | 134 | C10芳香烃 | C10H14+ | 芳香烃 | 59.2 | 0.995 | 2.45 | 0.025 |
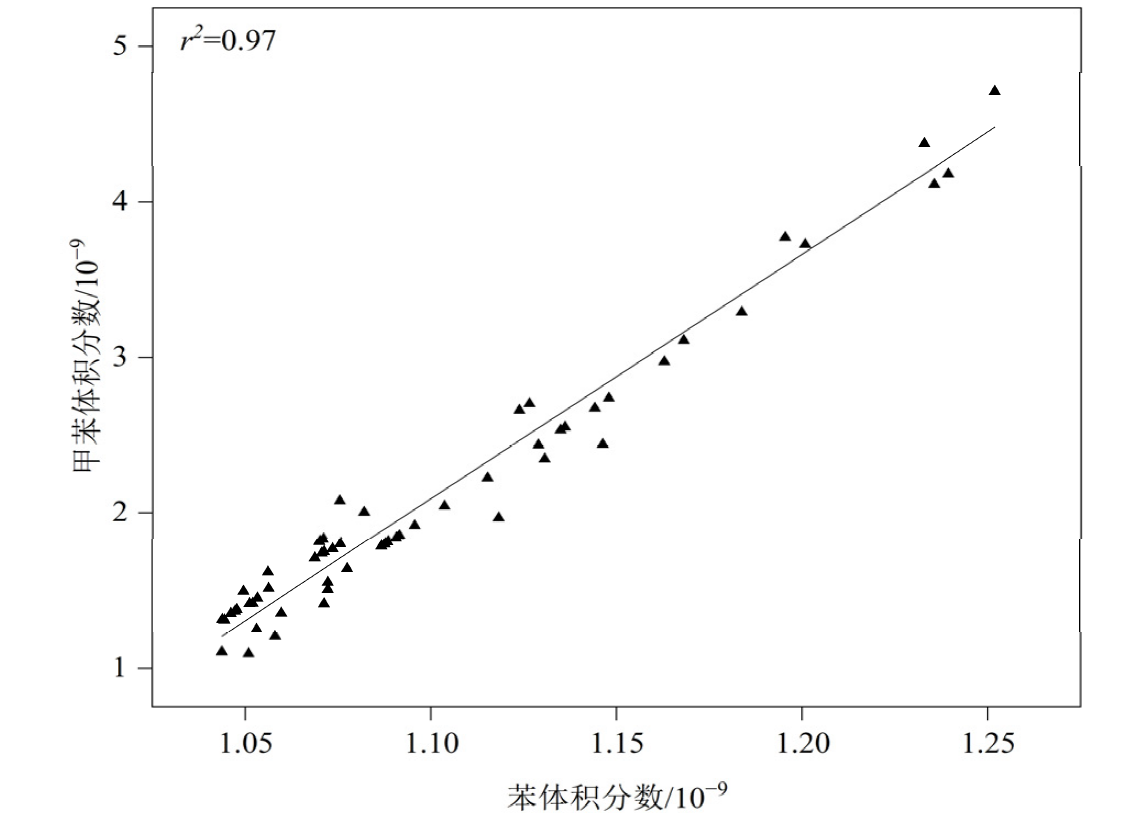
图1 观测点甲苯和苯体积分数的相关性
Figure 1 The correlation between the volume fractions of toluene and benzene at the observation point
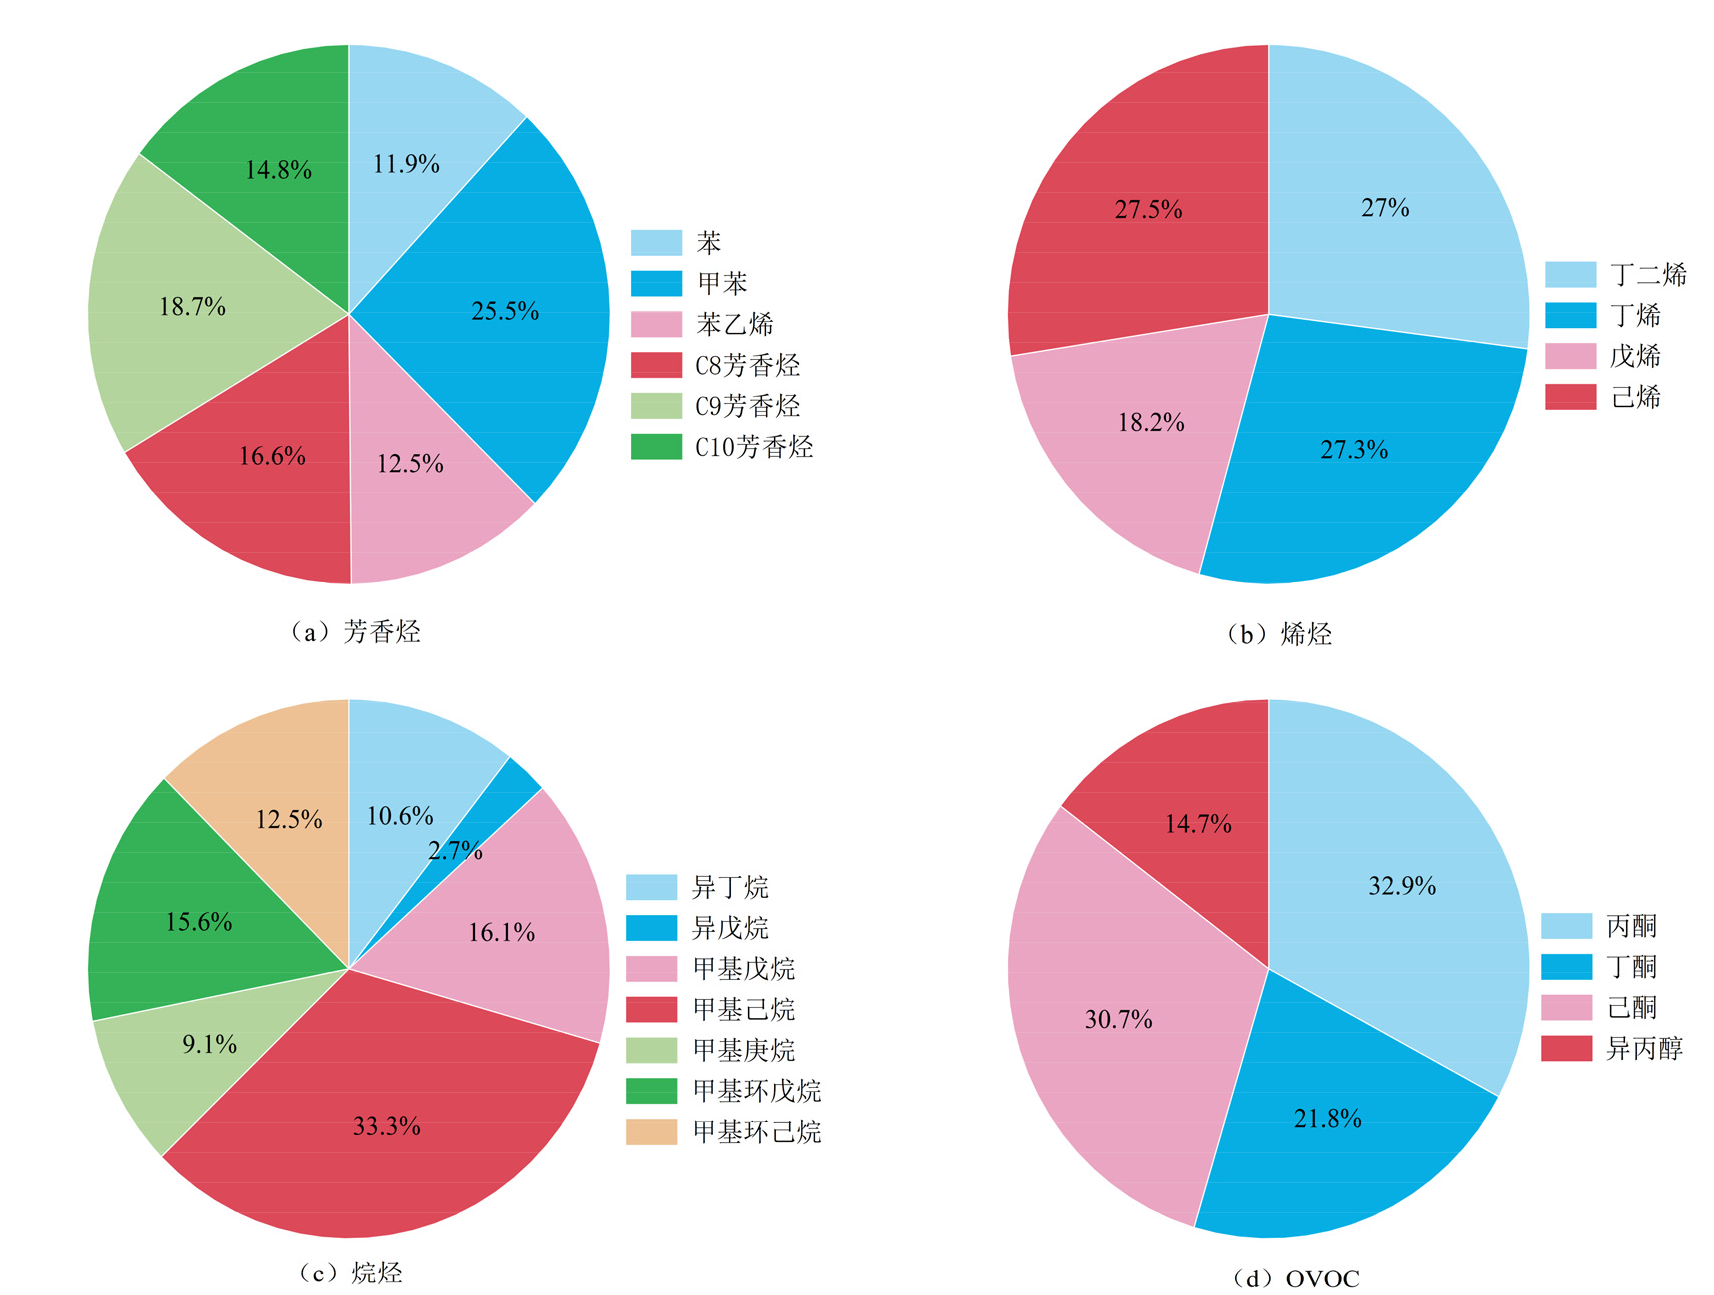
图2 观测期间不同类别VOCs组成成分和体积分数贡献
Figure 2 Compositional and concentration contributions of different VOCs categories during the observation period

图3 观测期间不同类别VOCs在8:00-20:00白间12 h变化特征
Figure 3 Variation characteristics of different categories of VOCs during the 12hour daytime period from 8:00 to 20:00 during the observation period
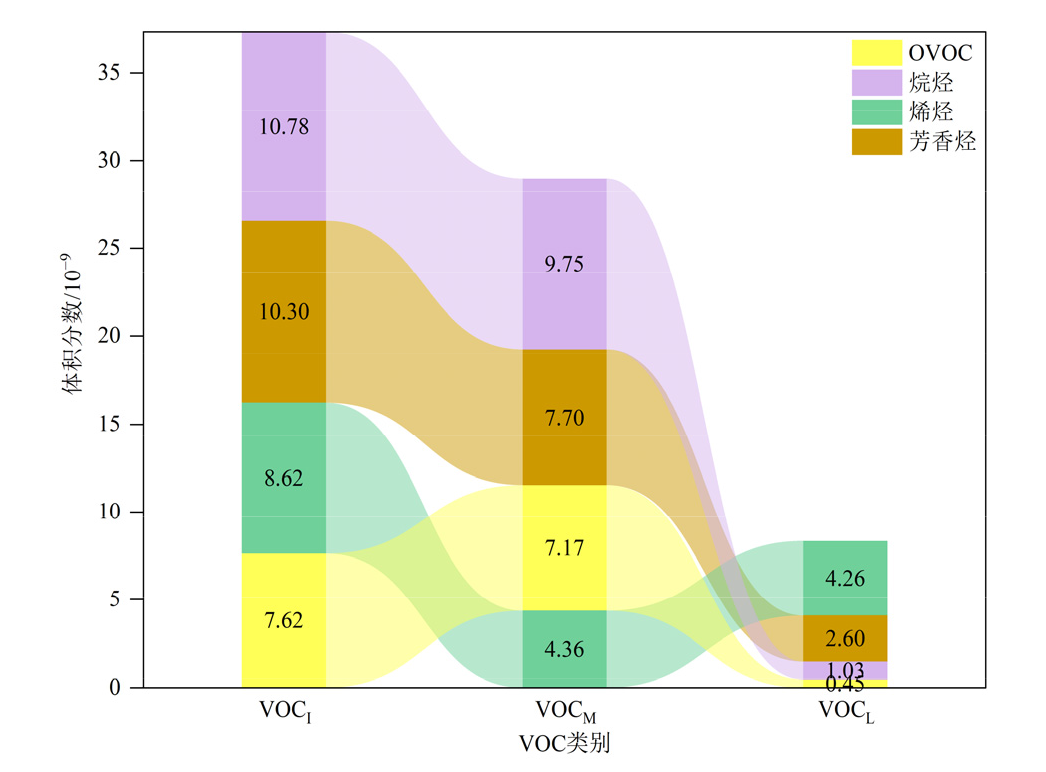
图4 VOCI、VOCM和VOCL之间的关系
Figure 4 Relationship between VOCI, VOCM and VOCL
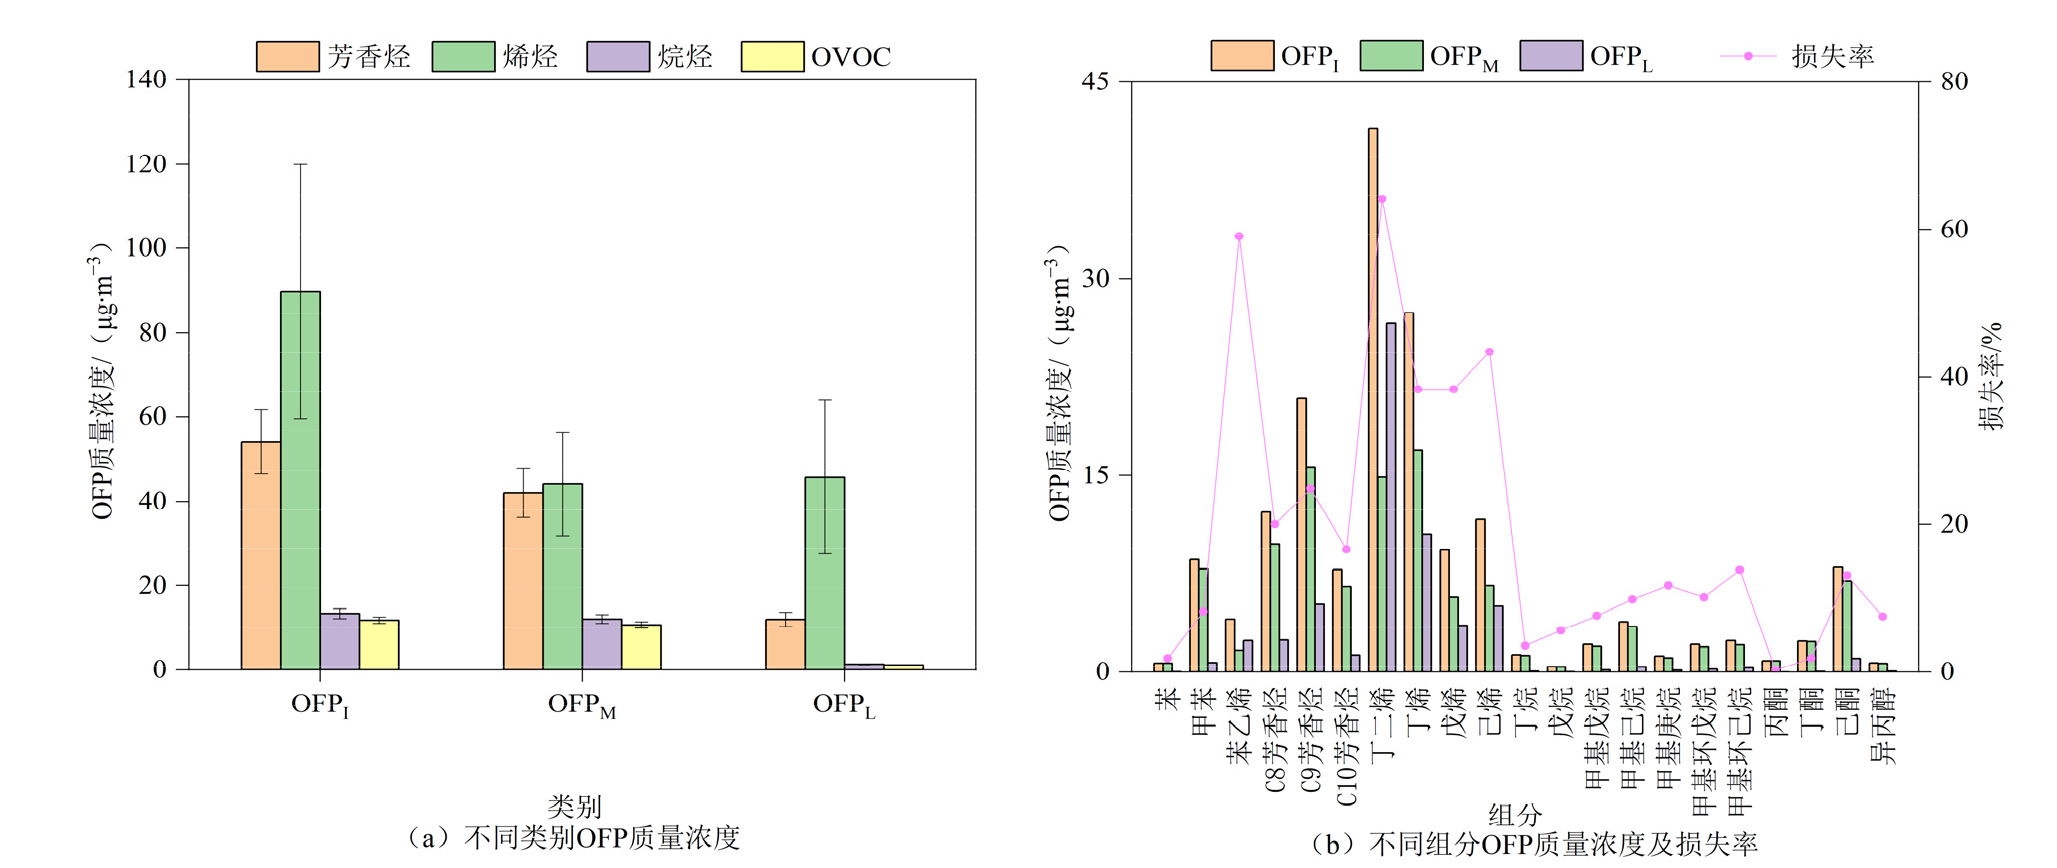
图5 不同类别和组分VOCs的OFP及其光化学损失
Figure 5 OFP and its photochemical loss for different classes and component of VOCs

图6 不同类别和组分VOCs的SOAP及其光化学损失
Figure 6 SOAP and its photochemical loss for different classes and component of VOCs
| [1] |
AMADOR-MUÑOZ O, MISZTAL P K, WEBER R, et al., 2016. Sensitive detection of n-alkanes using a mixed ionization mode proton-transfer- reaction mass spectrometer[J]. Atmospheric Measurement Techniques, 9(11): 5315-5329.
DOI URL |
| [2] |
AN T, LI J, LIN Q, et al., 2024. Ozone formation potential related to the release of volatile organic compounds (VOCs) and nitrogen oxide (NOX) from a typical industrial park in the Pearl River Delta[J]. Environmental Science: Atmospheres, 4(11):1229-1238.
DOI URL |
| [3] |
AN Z, HUANG R J, ZHANG R, et al., 2019. Severe haze in northern China: A synergy of anthropogenic emissions and atmospheric processes[J]. Proceedings of the National Academy of Sciences, 116(18): 8657-8666.
DOI URL |
| [4] |
ATKINSON R, AREY J, 2003. Atmospheric degradation of volatile organic compounds[J]. Chemical Reviews, 103(12): 4605-4638.
PMID |
| [5] |
CAO T H, WANG H C, CHEN X R, et al., 2024. Rapid increase in spring ozone in the Pearl River Delta, China during 2013-2022[J]. npj Climate and Atmospheric Science, 7(1): 1-11.
DOI |
| [6] | CARTER W P L, 1994. Development of ozone reactivity scales for volatile organic compounds[J]. Air & waste, 44(7): 881-899. |
| [7] |
CHEN Y B, YUAN B, WANG C M, et al., 2022. Online measurements of cycloalkanes based on NO+ chemical ionization in proton transfer reaction time-of-flight mass spectrometry (PTR-ToF-MS)[J]. Atmospheric Measurement Techniques, 15(23): 6935-6947.
DOI URL |
| [8] |
CHEN Z W, TING Y C, HUANG C H, et al., 2023. Sources-oriented contributions to ozone and secondary organic aerosol formation potential based on initial VOCs in an urban area of Eastern Asia[J]. Science of the Total Environment, 892: 164392.
DOI URL |
| [9] |
DERWENT R G, JENKIN M E, UTEMBE S R, et al., 2010. Secondary organic aerosol formation from a large number of reactive man-made organic compounds[J]. Science of the Total Environment, 408(16): 3374-3381.
DOI URL |
| [10] |
DISKIN A M, WANG T, SMITH D, et al., 2002. A selected ion flow tube (SIFT), study of the reactions of H3O+, NO+ and O2+ ions with a series of alkenes; in support of SIFT-MS[J]. International Journal of Mass Spectrometry, 218(1): 87-101.
DOI URL |
| [11] |
FEDERER W, DOBLER W, HOWORKA F, et al., 1985. Collisional relaxation of vibrationally excited NO+ ions[J]. The Journal of Chemical Physics, 83(3): 1032-1038.
DOI URL |
| [12] |
GAO J, ZHANG J, LI H, et al., 2018. Comparative study of volatile organic compounds in ambient air using observed mixing ratios and initial mixing ratios taking chemical loss into account: A case study in a typical urban area in Beijing[J]. Science of the Total Environment, 628-629: 791-804.
DOI URL |
| [13] | GAO W, XIE H, WANG W, et al., 2021. Unorganized source spectrum analysis of volatile organic compounds (VOCs) in atmospheric and vacuum unit of refining-chemical plant[J]. China Environmental Science, 41(12): 5561-5569. |
| [14] |
GUENERON M, ERICKSON M H, VANDERSCHELDEN G S, et al., 2015. PTR-MS fragmentation patterns of gasoline hydrocarbons[J]. International Journal of Mass Spectrometry, 379: 97-109.
DOI URL |
| [15] |
GUO Q, WANG Y Z, ZHENG J Y, et al., 2024. Temporal evolution of speciated volatile organic compound (VOC) emissions from solvent use sources in the Pearl River Delta Region, China (2006-2019)][J]. Science of The Total Environment, 933: 172888.
DOI URL |
| [16] |
HAN Y, HUANG X F, WANG C, et al., 2019. Characterizing oxygenated volatile organic compounds and their sources in rural atmospheres in China[J]. Journal of Environmental Sciences, 81: 148-155.
DOI PMID |
| [17] |
HE C Q, ZOU Y, LV S J, et al., 2024. The importance of photochemical loss to source analysis and ozone formation potential: Implications from in-situ observations of volatile organic compounds (VOCs) in Guangzhou, China[J]. Atmospheric Environment, 320: 120320.
DOI URL |
| [18] |
HUI L R, LIU X G, TAN Q W, et al., 2018. Characteristics, source apportionment and contribution of VOCs to ozone formation in Wuhan, Central China[J]. Atmospheric Environment, 192: 55-71.
DOI URL |
| [19] |
INOMATA S, TANIMOTO H, YAMADA H, 2014. Mass spectrometric detection of alkanes using NO+ chemical ionization in proton- transfer-reaction plus switchable reagent ion mass spectrometry[J]. Chemistry Letters, 43(4): 538-540.
DOI URL |
| [20] |
JI X T, XU K, LIAO D, et al., 2022. Spatial-temporal characteristics and source apportionment of ambient VOCs in southeast mountain area of China[J]. Aerosol and Air Quality Research, 22(5): 220016.
DOI URL |
| [21] |
JORDAN A, HAIDACHER S, HANEL G, et al., 2009. An online ultra-high sensitivity Proton-transfer-reaction mass-spectrometer combined with switchable reagent ion capability (PTR+SRI-MS)[J]. International Journal of Mass Spectrometry, 286(1): 32-38.
DOI URL |
| [22] | KARL T, HANSEL A, CAPPELLIN L, et al., 2012. Selective measurements of isoprene and 2-methyl-3-buten-2-ol based on NO+ionization mass spectrometry[J]. Atmospheric Chemistry and Physics, 12(24): 11877-11884. |
| [23] |
KNIGHTON W B, FORTNER E C, HERNDON S C, et al., 2009. Adaptation of a proton transfer reaction mass spectrometer instrument to employ NO+ as reagent ion for the detection of 1,3-butadiene in the ambient atmosphere[J]. Rapid Communications in Mass Spectrometry, 23(20): 3301-3308.
DOI URL |
| [24] |
KOSS A R, WARNEKE C, YUAN B, et al., 2016. Evaluation of NO+ reagent ion chemistry for online measurements of atmospheric volatile organic compounds[J]. Atmospheric Measurement Techniques, 9(7): 2909-2925.
DOI URL |
| [25] |
KROLL J H, SEINFELD J H, 2008. Chemistry of secondary organic aerosol: Formation and evolution of low-volatility organics in the atmosphere[J]. Atmospheric Environment, 42(16): 3593-3624.
DOI URL |
| [26] |
KUMAR A, SINGH D, KUMAR K, et al., 2018. Distribution of VOCs in urban and rural atmospheres of subtropical India: Temporal variation, source attribution, ratios, OFP and risk assessment[J]. Science of the Total Environment, 613-614: 492-501.
DOI URL |
| [27] |
LI H W, JIANG J C, HUA L, et al., 2021. Photoionization-induced NO+ chemical ionization time-of-flight mass spectrometry for rapid measurement of aldehydes and benzenes in vehicles[J]. Talanta, 235: 122722.
DOI URL |
| [28] |
LI Q Q, SU G J, LI C Q, et al., 2020. An investigation into the role of VOCs in SOA and ozone production in Beijing, China[J]. Science of the Total Environment, 720: 137536.
DOI URL |
| [29] |
LIAO D, WANG L, WANG Y Y, et al., 2024. Health risks and environmental influence of volatile organic compounds (VOCs) in a residential area near an industrial park in Southeast China[J]. Atmospheric Pollution Research, 15(1): 101966.
DOI URL |
| [30] |
LING Z H, GUO H, CHENG H R, et al., 2011. Sources of ambient volatile organic compounds and their contributions to photochemical ozone formation at a site in the Pearl River Delta, southern China[J]. Environmental Pollution, 159(10): 2310-2319.
DOI PMID |
| [31] |
LIU Z G, WANG B L, WANG C, et al., 2023. Characterization of photochemical losses of volatile organic compounds and their implications for ozone formation potential and source apportionment during summer in suburban Jinan, China[J]. Environmental Research, 238(Part 1): 117158.
DOI URL |
| [32] | MA W, FENG Z M, ZHAN J L, et al., 2022. Influence of photochemical loss of volatile organic compounds on understanding ozone formation mechanism[J]. Atmospheric Chemistry and Physics, 22(7): 4841-4851. |
| [33] |
SHAO M, WANG B, LU S, et al., 2011. Effects of Beijing Olympics control measures on reducing reactive hydrocarbon species[J]. Environmental Science & Technology, 45(2): 514-519.
DOI URL |
| [34] |
ZHAO M, ZHANG Y N, PEI C L, et al., 2022. Worsening ozone air pollution with reduced NOx and VOCs in the Pearl River Delta region in autumn 2019: Implications for national control policy in China[J]. Journal of Environmental Management, 324: 116327.
DOI URL |
| [35] | NIU H, MO Z W, SHAO M, et al., 2016. Screening the emission sources of volatile organic compounds (VOCs) in China by multi-effects evaluation[J]. Frontiers of Environmental Science & Engineering, 10(5): 1. |
| [36] |
REN H R, XIA Z Y, YAO L B, et al., 2024. Investigation on ozone formation mechanism and control strategy of VOCs in petrochemical region: insights from chemical reactivity and photochemical loss[J]. Science of The Total Environment, 914: 169891.
DOI URL |
| [37] | SHAW J T, RICKARD A R, NEWLAND M J, et al., 2020. Rate coefficients for reactions of OH with aromatic and aliphatic volatile organic compounds determined by the multivariate relative rate technique[J]. Atmospheric Chemistry and Physics, 20(16): 9725-9736. |
| [38] |
SMITH D, ŠPANĚL P, DRYAHINA K, 2019. H3O+, NO+ and O2+ reactions with saturated and unsaturated monoketones and diones; focus on hydration of product ions[J]. International Journal of Mass Spectrometry, 435: 173-180.
DOI URL |
| [39] |
SMITH D, ŠPANĚL P, 2005. Selected ion flow tube mass spectrometry (SIFT-MS) for on-line trace gas analysis[J]. Mass Spectrometry Review, 24: 661-700.
DOI URL |
| [40] |
SONG Y, SHAO M, LIU Y, et al., 2007. Source apportionment of ambient volatile organic compounds in Beijing[J]. Environmental Science & Technology, 41(12): 4348-4353.
DOI URL |
| [41] |
TAN Z F, LU K D, JIANG M Q, et al., 2018. Exploring ozone pollution in Chengdu, southwestern China: A case study from radical chemistry to O3-VOC-NOx sensitivity[J]. Science of the Total Environment, 636: 775-786.
DOI URL |
| [42] |
TANG J H, CHU K W, CHAN L Y, et al., 2014. Non-methane hydrocarbon emission profiles from printing and electronic industrial processes and its implications on the ambient atmosphere in the Pearl River Delta, South China[J]. Atmospheric Pollution Research, 5(1): 151-160.
DOI URL |
| [43] |
WANG S Y, ZHAO Y L, HAN Y, et al., 2022b. Spatiotemporal variation, source and secondary transformation potential of volatile organic compounds (VOCs) during the winter days in Shanghai, China[J]. Atmospheric Environment, 286: 119203.
DOI URL |
| [44] |
WANG T, XUE L K, FENG Z Z, et al., 2022a. Ground-level ozone pollution in China: A synthesis of recent findings on influencing factors and impacts[J]. Environmental Research Letters, 17(6): 063003.
DOI |
| [45] | WARNEKE C, MCKEEN S A, DE GOUW J A, et al., 2007. Determination of urban volatile organic compound emission ratios and comparison with an emissions database[J]. Journal of Geophysical Research: Atmospheres, 112: D10S47. |
| [46] | WU C H, WANG C M, WANG S H, et al., 2020. Measurement report: Important contributions of oxygenated compounds to emissions and chemistry of volatile organic compounds in urban air[J]. Atmospheric Chemistry and Physics, 20(23): 14769-14785. |
| [47] |
WU F K, YU Y, SUN J, et al., 2016. Characteristics, source apportionment and reactivity of ambient volatile organic compounds at Dinghu Mountain in Guangdong Province, China[J]. Science of the Total Environment, 548-549: 347-359.
DOI URL |
| [48] |
WU Y J, FAN X L, LIU Y, et al., 2023. Source apportionment of VOCs based on photochemical loss in summer at a suburban site in Beijing[J]. Atmospheric Environment, 293: 119459.
DOI URL |
| [49] |
YANG Z, CHENG H R, WANG Z W, et al., 2019. Chemical characteristics of atmospheric carbonyl compounds and source identification of formaldehyde in Wuhan, Central China[J]. Atmospheric Research, 228: 95-106.
DOI URL |
| [50] |
YAO S, FAN F J, JIA H Y, et al., 2025. Quantitative impacts of VOC sources on atmospheric oxidation capacity and O3 formation from a megacity in China[J]. Atmospheric Environment, 344: 121033.
DOI URL |
| [51] | YE C X, GUO S Z, LIN W L, et al., 2023. Measurement report: Source apportionment and environmental impacts of volatile organic compounds (VOCs) in Lhasa, a highland city in China[J]. Atmospheric Chemistry and Physics, 23(18): 10383-10397. |
| [52] |
YUAN B, KOSS A, WARNEKE C, et al., 2016. A high-resolution time-of-flight chemical ionization mass spectrometer utilizing hydronium ions (H3O+ToF-CIMS) for measurements of volatile organic compounds in the atmosphere[J]. Atmospheric Measurement Techniques, 9(6): 2735-2752.
DOI URL |
| [53] |
ZHAN J L, FENG Z M, LIU P F, et al., 2021. Ozone and SOA formation potential based on photochemical loss of VOCs during the Beijing summer[J]. Environmental Pollution, 285: 117444.
DOI URL |
| [54] | ZHANG K, LIU Z Q, ZHANG X J, et al., 2022. Insights into the significant increase in ozone during COVID-19 in a typical urban city of China[J]. Atmospheric Chemistry and Physics, 22(7): 4853-4866. |
| [55] |
ZHANG L L, XU T, WU G C, et al., 2024. Photochemical loss with consequential underestimation in active VOCs and corresponding secondary pollutions in a petrochemical refinery, China[J]. Science of the Total Environment, 918: 170613.
DOI URL |
| [56] | ZHANG Q, YUAN B, SHAO M, et al., 2014. Variations of ground-level O3 and its precursors in Beijing in summertime between 2005 and 2011[J]. Atmospheric Chemistry and Physics, 14(12): 6089-6101. |
| [57] |
ZHANG Y J, LI F, CHENG Q, et al., 2023. Characteristics and secondary transformation potential of volatile organic compounds in Wuhan, China[J]. Atmospheric Environment, 294: 119469.
DOI URL |
| [58] |
ZHAO N, ZHANG H Y, WANG G, 2025. Revealing the nonlinear responses of PM2.5 and O3 to VOC and NOx emissions from various sources in Shandong, China[J]. Journal of Hazardous Materials, 489: 137655.
DOI URL |
| [59] | ZHENG X D, 2025. Differences in the key volatile organic compound species between their emitted and ambient concentrations in ozone formation[J]. Atmospheric Chemistry and Physics, 25(6): 3807-3820. |
| [60] |
ZHU B, HAN Y, WANG C, et al., 2019. Understanding primary and secondary sources of ambient oxygenated volatile organic compounds in Shenzhen utilizing photochemical age-based parameterization method[J]. Journal of Environmental Sciences, 75: 105-114.
DOI PMID |
| [61] |
ZOU Y, YAN X L, FLORES R M, et al., 2023. Source apportionment and ozone formation mechanism of VOCs considering photochemical loss in Guangzhou, China[J]. Science of the Total Environment, 903: 166191.
DOI URL |
| [62] | 邓拓宇, 陈鸿展, 张金谱, 2023. 广州市大气VOCs污染特征及O3生成潜势分析[J]. 中国环境监测, 39(1): 51-59. |
| DENG T Y, CHEN H Z, ZHANG J P, 2023. Analysis of air VOCs pollution characteristics and O3 formation potential in Guangzhou[J]. Environmental Monitoring in China, 39(1): 51-59. | |
| [63] | 杜寒冰, 王男, 任万辉, 等, 2021. 沈阳市挥发性有机物污染特征及反应活性[J]. 环境科学, 42(12): 5656-5662. |
| DU B H, WANG N, REN W H, et al., 2021. Pollution characteristics and reactivity of volatile organic compounds in Shenyang[J]. Environmental Science, 42(12): 5656-5662. | |
| [64] | 刘俊, 楚碧武, 贺泓, 2018. 北京市二次有机气溶胶生成潜势的日变化规律[J]. 环境科学, 39(6): 2505-2511. |
| LIU J, CHU B W, HE H, 2018. Diurnal variation patterns of secondary organic aerosol formation potential in Beijing[J]. Environmental Science, 39(6): 2505-2511. | |
| [65] | 颜敏, 黄晓波, 张文忠, 等, 2021. 深圳大气挥发性有机物污染特征及臭氧生成潜势[J]. 环境科学与技术, 44(2): 57-65. |
| YAN M, HUANG X B, ZHANG W Z, et al., 2021. Pollution characteristics of atmospheric volatile organic compounds and ozone formation potential in Shenzhen[J]. Environmental Science and Technology, 44(2): 57-65. | |
| [66] | 朱少峰, 黄晓锋, 何凌燕, 等, 2012. 深圳大气VOCs浓度的变化特征与化学反应活性[J]. 中国环境科学, 32(12): 2140-2148. |
| ZHU S F, HUANG X F, HE L Y, et al., 2012. Variation characteristics and chemical reactivity of atmospheric VOCs in Shenzhen[J]. Chinese Environmental Science, 32(12): 2140-2148. |
| [1] | 付守琪, 余朝毅, 邬乐欢, 张琪, 袁筱茜, 杨钢洪, 潘月鹏. 基于WRF-CAMx模型的舟山群岛新区大气环境承载力测算及多污染物协同控制研究[J]. 生态环境学报, 2026, 35(1): 88-98. |
| [2] | 张蔷, 李令军, 鹿海峰, 刘保献, 李琪, 王涵霖. 北京地区9种典型绿化树种的BVOCs释放及二次污染生成潜势[J]. 生态环境学报, 2025, 34(9): 1432-1441. |
| [3] | 包雪儿, 包海, 赵玲玲, 昂给拉玛. 内蒙古高原农作物挥发性有机物排放特征[J]. 生态环境学报, 2025, 34(9): 1442-1451. |
| [4] | 陈思宇, 孙丽娟, 苏枞枞, 于兴娜. 太原市春夏季VOCs组成特征及其对二次有机气溶胶和臭氧的贡献[J]. 生态环境学报, 2025, 34(4): 548-555. |
| [5] | 高星星, 包海, 丁艳旭. 夏季呼和浩特市生物源挥发性有机物排放速率空间分布[J]. 生态环境学报, 2024, 33(12): 1902-1913. |
| [6] | 许肖云, 饶芝菡, 蒋红斌, 张巍, 陈超, 杨永安, 胡艳丽, 魏海川. 遂宁工业园区夏季VOCs污染特征及其对O3、SOA生成潜势研究[J]. 生态环境学报, 2023, 32(5): 956-968. |
| [7] | 李少宁, 李婷婷, 陶雪莹, 赵娜, 徐晓天, 鲁绍伟. 4种落叶树种释放有益挥发性有机物的比较研究[J]. 生态环境学报, 2023, 32(1): 123-128. |
| [8] | 李少宁, 陶雪莹, 李慧敏, 赵娜, 徐晓天, 鲁绍伟. 侧柏和垂柳释放有益BVOCs组分生长季动态变化特征研究[J]. 生态环境学报, 2022, 31(2): 257-264. |
| [9] | 谢邵文, 郭晓淞, 杨芬, 黄强, 陈曼佳, 魏兴琥, 刘承帅. 广州市城市公园土壤重金属累积特征、形态分布及其生态风险[J]. 生态环境学报, 2022, 31(11): 2206-2215. |
| [10] | 李少宁, 陶雪莹, 李绣宏, 赵娜, 徐晓天, 鲁绍伟. 植物释放有益挥发性有机物研究进展[J]. 生态环境学报, 2022, 31(1): 187-195. |
| [11] | 白建辉. 亚热带森林BVOCs排放和其影响因子之间的相互关系[J]. 生态环境学报, 2021, 30(5): 889-897. |
| 阅读次数 | ||||||
|
全文 |
|
|||||
|
摘要 |
|
|||||