Ecology and Environment ›› 2022, Vol. 31 ›› Issue (6): 1184-1192.DOI: 10.16258/j.cnki.1674-5906.2022.06.014
• Research Articles • Previous Articles Next Articles
JI Xiaoyan1( ), WANG Shanshan2,*(), YANG Kai1, REN Bei1
Received:2022-02-09
Online:2022-06-18
Published:2022-07-29
Contact:
WANG Shanshan
嵇晓燕1(), 王姗姗2,*(), 杨凯1, 任蓓1
通讯作者:
王姗姗
作者简介:嵇晓燕(1981年生),女,正高级工程师,博士,主要从事水环境质量监测和评价研究。E-mail: jixy@cnemc.cn
基金资助:CLC Number:
JI Xiaoyan, WANG Shanshan, YANG Kai, REN Bei. Temporal and Spatial Variation Characteristics of Total Nitrogen Concentration in Surface Water from 2016 to 2020 in China[J]. Ecology and Environment, 2022, 31(6): 1184-1192.
嵇晓燕, 王姗姗, 杨凯, 任蓓. 2016—2020年中国地表水中总氮浓度时空变化特征分析[J]. 生态环境学报, 2022, 31(6): 1184-1192.
Add to citation manager EndNote|Ris|BibTeX
URL: https://www.jeesci.com/EN/10.16258/j.cnki.1674-5906.2022.06.014
| 所属流域 Basin | 河流断面 River sections | 湖泊点位 Lake sites | 总计 Total |
|---|---|---|---|
| 长江流域 Yangtze River | 591 | 114 | 705 |
| 淮河流域 Huaihe River | 215 | 24 | 239 |
| 珠江流域 Pearl River | 212 | 13 | 225 |
| 海河流域 Haihe River | 166 | 11 | 177 |
| 黄河流域 Yellow River | 136 | 9 | 145 |
| 浙闽片河流 Zhejiang and Fujian area River | 126 | 9 | 135 |
| 辽河流域 Liaohe River | 112 | 4 | 116 |
| 松花江流域 Songhua River | 105 | 20 | 125 |
| 西南诸河 Southwest River | 63 | 2 | 65 |
Table 1 The distribution of surface water monitoring sections in each basin
| 所属流域 Basin | 河流断面 River sections | 湖泊点位 Lake sites | 总计 Total |
|---|---|---|---|
| 长江流域 Yangtze River | 591 | 114 | 705 |
| 淮河流域 Huaihe River | 215 | 24 | 239 |
| 珠江流域 Pearl River | 212 | 13 | 225 |
| 海河流域 Haihe River | 166 | 11 | 177 |
| 黄河流域 Yellow River | 136 | 9 | 145 |
| 浙闽片河流 Zhejiang and Fujian area River | 126 | 9 | 135 |
| 辽河流域 Liaohe River | 112 | 4 | 116 |
| 松花江流域 Songhua River | 105 | 20 | 125 |
| 西南诸河 Southwest River | 63 | 2 | 65 |
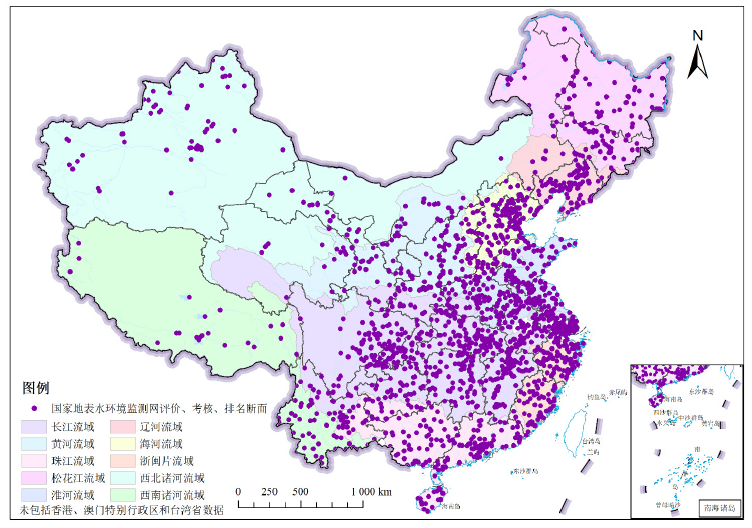
Figure 1 The distribution of surface water monitoring sections in each watershed Drawing Censor Number GS (2020) No.5815
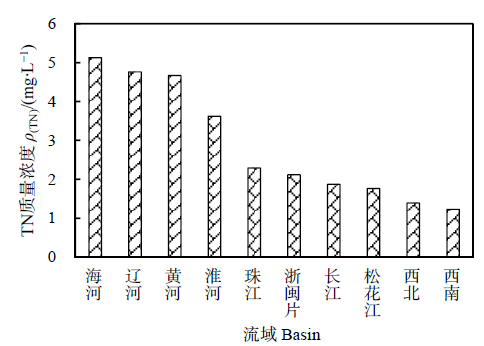
Figure 2 The average mass concentration of TN in each watershed during 2016—2020
| 年份 Year | 全国总体 Rivers and lakes and reservoirs | 河流 Rivers | 湖库 Lakes and reservoirs | ||||||||
|---|---|---|---|---|---|---|---|---|---|---|---|
| 均值 Mean | 中位数 Median | 范围 Range | 均值 Mean | 中位数 Median | 范围 Range | 均值 Mean | 中位数 Median | 范围 Range | |||
| 2016 | 2.80 | 2.04 | 0.01-40.82 | 3.05 | 2.04 | 0.01-40.82 | 1.26 | 2.03 | 0.055-9.66 | ||
| 2017 | 3.00 | 2.00 | 0.10-37.87 | 3.23 | 2.17 | 0.10-38.87 | 1.31 | 1.13 | 0.17-11.52 | ||
| 2018 | 2.96 | 1.89 | 0.13-83.30 | 3.18 | 2.17 | 0.33-83.30 | 1.28 | 1.12 | 0.13-8.34 | ||
| 2019 | 2.58 | 1.76 | 0.12-45.03 | 2.76 | 1.96 | 0.26-45.03 | 1.20 | 1.07 | 0.12-7.68 | ||
| 2020 | 2.54 | 1.54 | 0.12-32.22 | 2.72 | 2.05 | 0.27-32.22 | 1.19 | 1.06 | 0.12-8.00 | ||
Table 2 The annual mass concentration of TN in all surface water, rivers, lakes and reservoirs during 2016-2020 mg∙L-1
| 年份 Year | 全国总体 Rivers and lakes and reservoirs | 河流 Rivers | 湖库 Lakes and reservoirs | ||||||||
|---|---|---|---|---|---|---|---|---|---|---|---|
| 均值 Mean | 中位数 Median | 范围 Range | 均值 Mean | 中位数 Median | 范围 Range | 均值 Mean | 中位数 Median | 范围 Range | |||
| 2016 | 2.80 | 2.04 | 0.01-40.82 | 3.05 | 2.04 | 0.01-40.82 | 1.26 | 2.03 | 0.055-9.66 | ||
| 2017 | 3.00 | 2.00 | 0.10-37.87 | 3.23 | 2.17 | 0.10-38.87 | 1.31 | 1.13 | 0.17-11.52 | ||
| 2018 | 2.96 | 1.89 | 0.13-83.30 | 3.18 | 2.17 | 0.33-83.30 | 1.28 | 1.12 | 0.13-8.34 | ||
| 2019 | 2.58 | 1.76 | 0.12-45.03 | 2.76 | 1.96 | 0.26-45.03 | 1.20 | 1.07 | 0.12-7.68 | ||
| 2020 | 2.54 | 1.54 | 0.12-32.22 | 2.72 | 2.05 | 0.27-32.22 | 1.19 | 1.06 | 0.12-8.00 | ||
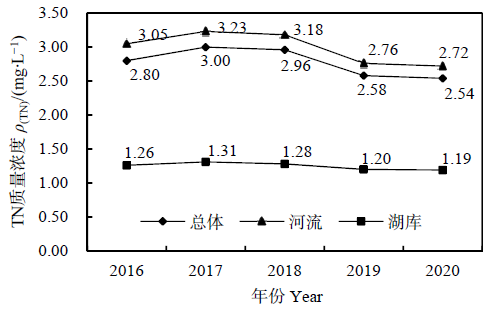
Figure 3 The variation of average mass concentration of TN in all surface water, rivers, lakes and reservoirs
| 年份 Year | 农业化肥施用总量 Total fertilizer application in agriculture/ (104 t) | 氮肥施用量 Nitrogen fertilizer application/ (104 t) | 氮肥施用占比 Nitrogen fertilizer application ratio/ % |
|---|---|---|---|
| 2016 | 5984.4 | 2310.5 | 38.6 |
| 2017 | 5859.4 | 2221.8 | 37.9 |
| 2018 | 5653.4 | 2065.4 | 36.5 |
| 2019 | 5403.6 | 1930.2 | 35.7 |
| 2020 | 5250.7 | 1833.9 | 34.9 |
Table 3 The amount of nitrogenous fertilizer application in 2016-2019
| 年份 Year | 农业化肥施用总量 Total fertilizer application in agriculture/ (104 t) | 氮肥施用量 Nitrogen fertilizer application/ (104 t) | 氮肥施用占比 Nitrogen fertilizer application ratio/ % |
|---|---|---|---|
| 2016 | 5984.4 | 2310.5 | 38.6 |
| 2017 | 5859.4 | 2221.8 | 37.9 |
| 2018 | 5653.4 | 2065.4 | 36.5 |
| 2019 | 5403.6 | 1930.2 | 35.7 |
| 2020 | 5250.7 | 1833.9 | 34.9 |
| 来源 Resources | 总氮排放量 Total nitrogen discharge/(×104 t) |
|---|---|
| 工业源 Industry resources | 15.57 |
| 农业源 Agriculture resources | 141.49 |
| 生活源 Domestic resources | 146.52 |
| 集中式污染治理设施 Centralized pollution control facilities | 0.56 |
Table 4 The emission source and amount of TN in China
| 来源 Resources | 总氮排放量 Total nitrogen discharge/(×104 t) |
|---|---|
| 工业源 Industry resources | 15.57 |
| 农业源 Agriculture resources | 141.49 |
| 生活源 Domestic resources | 146.52 |
| 集中式污染治理设施 Centralized pollution control facilities | 0.56 |
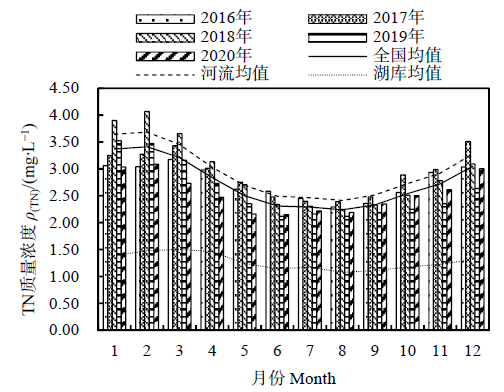
Figure 4 The variation of monthly average TN concentration in 2016-2020
| 5年月均 Monthly mean value of 5 years | 全国总体 Rivers and lakes and reservoirs | 河流 Rivers | 湖库 Lakes and reservoirs | |||||
|---|---|---|---|---|---|---|---|---|
| 范围 Range | 均值 Mean | 范围 Range | 均值 Mean | 范围 Range | 均值 Mean | |||
| 1月 January | 0.015-115 | 3.37 | 0.015-115 | 3.65 | 0.02-21 | 1.39 | ||
| 2月 February | 0.02-108 | 3.41 | 0.06-108 | 3.68 | 0.02-18.1 | 1.47 | ||
| 3月 March | 0.02-81.0 | 3.22 | 0.06-81.0 | 3.45 | 0.02-15.0 | 1.50 | ||
| 4月 April | 0.02-83.2 | 2.84 | 0.02-83.2 | 3.03 | 0.07-41.2 | 1.46 | ||
| 5月 May | 0.02-65.2 | 2.50 | 0.06-65.2 | 2.69 | 0.02-9.90 | 1.24 | ||
| 6月 June | 0.02-77.2 | 2.32 | 0.054-77.2 | 2.49 | 0.02-9.08 | 1.14 | ||
| 7月 July | 0.02-44.4 | 2.30 | 0.02-44.4 | 2.46 | 0.03-14.7 | 1.17 | ||
| 8月 August | 0.02-58.7 | 2.24 | 0.02-58.7 | 2.41 | 0.055-8.64 | 1.08 | ||
| 9月 September | 0.02-48.7 | 2.33 | 0.02-48.7 | 2.52 | 0.05-24.4 | 1.11 | ||
| 10月 October | 0.01-58.9 | 2.54 | 0.01-58.9 | 2.73 | 0.025-9.43 | 1.17 | ||
| 11月 November | 0.02-81.7 | 2.72 | 0.02-81.7 | 2.92 | 0.02-17.2 | 1.22 | ||
| 12月 December | 0.02-52.6 | 3.05 | 0.02-52.6 | 3.28 | 0.025-16.8 | 1.32 | ||
Table 5 The monthly mass concentration of TN in all surface water, rivers, lakes and reservoirs in 2016-2020 mg∙L-1
| 5年月均 Monthly mean value of 5 years | 全国总体 Rivers and lakes and reservoirs | 河流 Rivers | 湖库 Lakes and reservoirs | |||||
|---|---|---|---|---|---|---|---|---|
| 范围 Range | 均值 Mean | 范围 Range | 均值 Mean | 范围 Range | 均值 Mean | |||
| 1月 January | 0.015-115 | 3.37 | 0.015-115 | 3.65 | 0.02-21 | 1.39 | ||
| 2月 February | 0.02-108 | 3.41 | 0.06-108 | 3.68 | 0.02-18.1 | 1.47 | ||
| 3月 March | 0.02-81.0 | 3.22 | 0.06-81.0 | 3.45 | 0.02-15.0 | 1.50 | ||
| 4月 April | 0.02-83.2 | 2.84 | 0.02-83.2 | 3.03 | 0.07-41.2 | 1.46 | ||
| 5月 May | 0.02-65.2 | 2.50 | 0.06-65.2 | 2.69 | 0.02-9.90 | 1.24 | ||
| 6月 June | 0.02-77.2 | 2.32 | 0.054-77.2 | 2.49 | 0.02-9.08 | 1.14 | ||
| 7月 July | 0.02-44.4 | 2.30 | 0.02-44.4 | 2.46 | 0.03-14.7 | 1.17 | ||
| 8月 August | 0.02-58.7 | 2.24 | 0.02-58.7 | 2.41 | 0.055-8.64 | 1.08 | ||
| 9月 September | 0.02-48.7 | 2.33 | 0.02-48.7 | 2.52 | 0.05-24.4 | 1.11 | ||
| 10月 October | 0.01-58.9 | 2.54 | 0.01-58.9 | 2.73 | 0.025-9.43 | 1.17 | ||
| 11月 November | 0.02-81.7 | 2.72 | 0.02-81.7 | 2.92 | 0.02-17.2 | 1.22 | ||
| 12月 December | 0.02-52.6 | 3.05 | 0.02-52.6 | 3.28 | 0.025-16.8 | 1.32 | ||
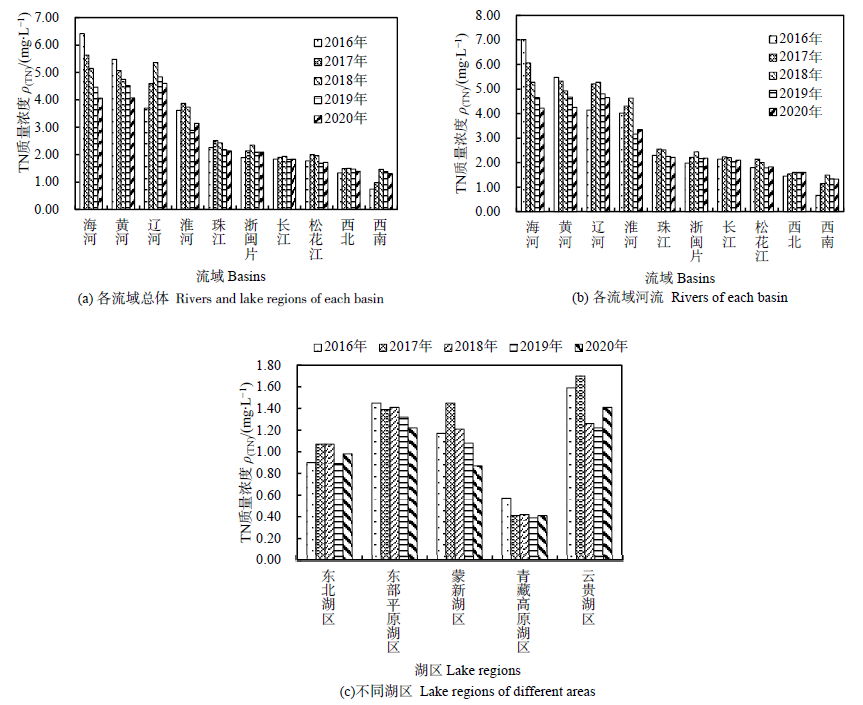
Figure 5 The annual variation of mass concentration of TN in each watershed
| 年份 Year | 入湖河流 Into-lake rivers | 湖库 Lakes and reservoirs | |||||
|---|---|---|---|---|---|---|---|
| 范围 Range | 均值 Mean | 中位值 Median | 范围 Range | 均值 Mean | 中位值 Median | ||
| 2016 | 0.64-17.7 | 4.50 | 3.16 | 0.055-9.66 | 1.26 | 2.03 | |
| 2017 | 0.27-47.4 | 4.69 | 3.35 | 0.17-11.52 | 1.31 | 1.13 | |
| 2018 | 0.32-108 | 4.38 | 3.45 | 0.13-8.34 | 1.28 | 1.12 | |
| 2019 | 0.40-20.5 | 4.10 | 3.51 | 0.12-7.68 | 1.20 | 1.07 | |
| 2020 | 0.61-37.1 | 4.28 | 3.42 | 0.12-8.00 | 1.19 | 1.06 | |
Table 6 The annual average mass concentration of TN in lakes and reservoirs and into-lake rivers mg∙L-1
| 年份 Year | 入湖河流 Into-lake rivers | 湖库 Lakes and reservoirs | |||||
|---|---|---|---|---|---|---|---|
| 范围 Range | 均值 Mean | 中位值 Median | 范围 Range | 均值 Mean | 中位值 Median | ||
| 2016 | 0.64-17.7 | 4.50 | 3.16 | 0.055-9.66 | 1.26 | 2.03 | |
| 2017 | 0.27-47.4 | 4.69 | 3.35 | 0.17-11.52 | 1.31 | 1.13 | |
| 2018 | 0.32-108 | 4.38 | 3.45 | 0.13-8.34 | 1.28 | 1.12 | |
| 2019 | 0.40-20.5 | 4.10 | 3.51 | 0.12-7.68 | 1.20 | 1.07 | |
| 2020 | 0.61-37.1 | 4.28 | 3.42 | 0.12-8.00 | 1.19 | 1.06 | |
| 序号 Number | 湖库 Lakes and reservoirs | 湖库总氮质量浓度 ρ/(mg∙L-1) | 入湖河流总氮 质量浓度 ρ/(mg∙L-1) | 相关系数 Correlation coefficient |
|---|---|---|---|---|
| 1 | 巢湖 | 1.18-1.65 | 5.03-10.23 | 0.957 |
| 2 | 滇池 | 1.26-2.15 | 5.73-8.43 | 0.313 |
| 3 | 丹江口水库 | 1.08-1.29 | 2.02-3.24 | 0.656 |
| 4 | 白洋淀 | 1.63-3.16 | 5.37-9.78 | 0.646 |
| 5 | 洱海 | 0.47-0.56 | 0.76-1.54 | 0.965 |
| 6 | 太湖 | 1.26-1.76 | 2.82-4.58 | 0.880 |
Table 7 Correlation coefficient of total nitrogen of typical lakes and reservoirs and into-lake rivers
| 序号 Number | 湖库 Lakes and reservoirs | 湖库总氮质量浓度 ρ/(mg∙L-1) | 入湖河流总氮 质量浓度 ρ/(mg∙L-1) | 相关系数 Correlation coefficient |
|---|---|---|---|---|
| 1 | 巢湖 | 1.18-1.65 | 5.03-10.23 | 0.957 |
| 2 | 滇池 | 1.26-2.15 | 5.73-8.43 | 0.313 |
| 3 | 丹江口水库 | 1.08-1.29 | 2.02-3.24 | 0.656 |
| 4 | 白洋淀 | 1.63-3.16 | 5.37-9.78 | 0.646 |
| 5 | 洱海 | 0.47-0.56 | 0.76-1.54 | 0.965 |
| 6 | 太湖 | 1.26-1.76 | 2.82-4.58 | 0.880 |
| 年份 Year | 超标指标种类 Types of indicators exceed the standard value | |||
|---|---|---|---|---|
| 渤海 Bohai Sea | 黄海 Yellow Sea | 东海 East China Sea | 南海 South China Sea | |
| 2016 | 无机氮 | 无机氮 | 无机氮、 活性磷酸盐 | pH、无机氮、 活性磷酸盐 |
| 2017 | 无机氮、 石油类 | 无机氮 | 无机氮、 活性磷酸盐 | — |
| 2018 | 无机氮、 活性磷酸盐 | 无机氮、 活性磷酸盐 | 无机氮、 活性磷酸盐 | 无机氮、 活性磷酸盐、 石油类 |
| 2019 | 无机氮、 活性磷酸盐 | 无机氮、活性磷酸盐 | 无机氮、 活性磷酸盐 | 无机氮、 活性磷酸盐 |
| 2020 | 无机氮、 活性磷酸盐 | 活性磷酸盐 | 无机氮、 活性磷酸盐 | 无机氮、 活性磷酸盐 |
Table 8 Exceeding indicators of major ocean regions in 2016-2020
| 年份 Year | 超标指标种类 Types of indicators exceed the standard value | |||
|---|---|---|---|---|
| 渤海 Bohai Sea | 黄海 Yellow Sea | 东海 East China Sea | 南海 South China Sea | |
| 2016 | 无机氮 | 无机氮 | 无机氮、 活性磷酸盐 | pH、无机氮、 活性磷酸盐 |
| 2017 | 无机氮、 石油类 | 无机氮 | 无机氮、 活性磷酸盐 | — |
| 2018 | 无机氮、 活性磷酸盐 | 无机氮、 活性磷酸盐 | 无机氮、 活性磷酸盐 | 无机氮、 活性磷酸盐、 石油类 |
| 2019 | 无机氮、 活性磷酸盐 | 无机氮、活性磷酸盐 | 无机氮、 活性磷酸盐 | 无机氮、 活性磷酸盐 |
| 2020 | 无机氮、 活性磷酸盐 | 活性磷酸盐 | 无机氮、 活性磷酸盐 | 无机氮、 活性磷酸盐 |
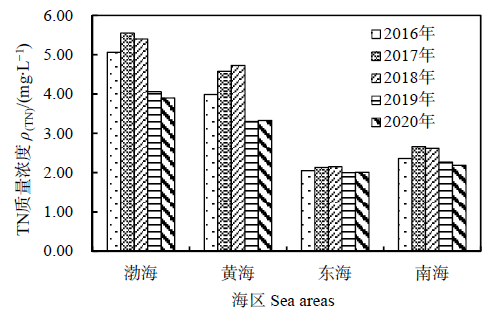
Figure 6 The annual variation of average mass concentration of TN of into-ocean rivers
| [1] | 陈水勇, 吴振明, 俞伟波, 等, 1999. 水体富营养化的形成、危害和防治[J]. 环境科学与技术 (2): 3-5. |
| CHEN S Y, WU Z M, YU W B, et al., 1999. Formation, harm, prevention and control of eutrophication of surface water[J]. Environmental Science and Technology (2): 3-5. | |
| [2] | 陈小锋, 2012. 我国湖泊富营养化区域差异性调查及氮素循环研究[D]. 南京: 南京大学. |
| CHEN X F, 2012. Investigation of the regional differences and nitrogeneous cycling in China's lakes[D]. Nanjing: Nanjing University. | |
| [3] | 陈小锋, 揣小明, 杨柳燕, 2014. 中国典型湖区湖泊富营养化现状、历史演变趋势及成因分析[J]. 生态与农村环境学报, 30(4): 438-443. |
| CHEN X F, CHUAI X M, YANG L Y, 2014. Status quo, historical evolution and causes of eutrophication in lakes in typical lake regions of China[J]. Journal of Ecology and Rural Environment, 30(4): 438-443. | |
| [4] | 崔嘉宇, 郭蓉, 宋兴伟, 等, 2021. 洪泽湖出入河流及湖体氮、磷浓度时空变化(2010-2019年)[J]. 湖泊科学, 33(6): 1727-1741. |
| CUI J Y, GUO R, SONG X W, et al., 2021. Spatio-temporal variations of total nitrogen and total phosphorus in lake and inflow/outflow rivers of Lake Hongze, 2010-2019[J]. Lake Science, 33(6): 1727-1741. | |
| [5] | 范清华, 沈红军, 张涛, 等, 2017. 1987-2016年太湖总氮浓度变化趋势分析[J]. 环境监控与预警, 9(6): 8-13. |
| FAN Q H, SHEN H J, ZHANG T, et al., 2017. Changes of total nitrogen concentration in Taihu Lake during 1987-2016[J]. Environmental Monitoring and Forewarning, 9(6):8-13. | |
| [6] | 国家环境保护总局, 2002. 地表水和污水监测技术规范: HJ/T 91-2002[S]. 北京: 中国环境出版社. |
| State Environmental Protection Administration, 2002. Technical specifications requirements for monitoring of surface water and waste water: HJ/T 91-2002[S]. Beijing: China Environmental Science Press. | |
| [7] | 国家环境保护总局, 2002. 地表水环境质量标准: GB3838-2002[S]. 北京: 中国环境科学出版社. |
| State Environmental Protection Administration, 2002. Environmental Quality Standards for Surface Water: GB 3838-2002[S]. Beijing: China Environmental Science Press. | |
| [8] | 国家统计局, 2021. 第七次全国人口普查主要数据情况[EB/OL]. [2021-05-11]. http://www.stats.gov.cn/tjsj./zxfb/202105/t20210510_1817176.html. |
| National Bureau of Statistics, 2021. Main data of the seventh National Census[EB/OL]. [2021-05-11]. http://www.stats.gov.cn/tjsj./zxfb/202105/t20210510_1817176.html. | |
| [9] | 何杨洋, 江浏光艳, 赵景峰, 2016. 博斯腾湖总氮总磷的时空分布[J]. 石河子大学学报, 34(2): 259-264. |
| HE Y Y, JIANG L G Y, ZHAO J F, 2016. Temporal and spatial variation of total nitrogen and total phosphorus of Bosten Lake[J]. Journal of Shihezi University, 34(2): 259-264. | |
| [10] | 环境保护部, 2011. 地表水环境质量评价办法 (试行)[Z]. 北京: 环办[2011] 22号. |
| Ministry of Environmental Protection, 2011. Evaluation Measures for Surface Water Environmental Quality (Trial)[Z]. Beijing: Huanban [2011] 22. | |
| [11] | 环境保护部, 2012. 水质总氮的测定碱性过硫酸钾消解紫外分光光度法: HJ 636-2012[S]. 北京: 中国环境出版社. |
| Ministry of Environmental Protection, 2012. Water quality-Determination of total nitrogen-Alkaline potassium persulfate digestion UV spectrophotometric method: HJ 636-2012[S]. Beijing: China Environmental Science Press. | |
| [12] | 环境保护部科技标准司, 中国环境科学学会, 2015. 湖泊水环境保护知识问答[M]. 北京: 中国环境出版社. |
| Science and Technology Standards Department of Ministry of Environmental Protection, Chinese Environmental Sciences Association, 2015. Q & A on lake water environment protection knowledge[M]. Beijing: China Statistics Press. | |
| [13] | 李璐, 贾维平, 陈萌萌, 2019. 河西走廊东段武威市总氮总磷时空污染分析[J]. 安徽农业科学, 47(19): 73-77. |
| LI L, JIA W P, CHEN M M, 2019. Spatial and temporal analysis of total nitrogen and total phosphorus pollution in Wuwei City, east of Hexi Corridor[J]. Journal of Anhui Agricultural Sciences, 47(19): 73-77. | |
| [14] | 刘维, 宋迎波, 2020. 2019年秋收作物生长季农业气象条件评价[J]. 中国农业气象, 41(3): 187-190. |
| LIU W, SONG Y B, 2020. Evaluation of agrometeorological conditions in the growing season of autumn crops in 2019[J]. Chinese Journal of Agrometeorology, 41(3): 187-190. | |
| [15] | 马自伟, 吴佳宁, 陈明, 等, 2017. 地表水中氨氮、总氮和总磷的污染程度及相关性分析[J]. 广州化学, 42(5): 8-11. |
| MA Z W, WU J N, CHEN M, et al., 2017. Pollution level and correlation analysis of ammonia nitrogen, total nitrogen and total phosphorus in surface water[J]. Guangzhou Chemistry, 42(5): 8-11. | |
| [16] | 牛莉萍, 2017. 地表水中氮磷的污染及其防治措施探讨[J]. 资源节约与环保 (11): 45-47. |
| NIU L P, 2017. Discussion on nitrogen and phosphorus pollution, prevention and control of surface water[J]. Resources Economization and Environmental Protection (11): 45-47. | |
| [17] | 任智慧, 赵春发, 王青青, 等, 2021. 复杂流域氮磷污染物输出特征及模拟--以南京市云台山河流域为例[J]. 农业环境科学学报, 40(1): 1-20. |
| REN Z H, ZHAO C F, WANG Q Q, et al., 2021. Research on the characteristics and simulation of nitrogen and phosphorus in complex watersheds: A case study in the Yuntaishan River Basin in Nanjing City[J]. Journal of Agro-Environment Science, 40(1): 1-20. | |
| [18] | 石敏, 2018. 辽宁省入海河流污染现状调查及其对近岸海域水质影响分析[J]. 农业与技术, 38(3): 167-169. |
| SHI M, 2018. Investigation on pollution status of rivers entering the sea in Liaoning Province and its impact on water quality of coastal waters[J]. Agriculture and Technology, 38(3): 167-169. | |
| [19] | 唐晓先, 蒋晨韵, 王璨, 等, 2017. 巢湖西半湖总磷浓度对入湖总磷负荷的响应[J]. 环境科学与技术, 40(S1): 176-180. |
| TANG X X, JIANG C Y, WANG C, et al., 2017. Responses of total phosphorus concentration to total phosphorus loading of inflow rivers in the western part of Chaohu Lake[J]. Environmental Science and Technology, 40(S1): 176-180. | |
| [20] | 王书航, 姜霞, 金相灿, 2011. 巢湖入湖河流分类及污染特征分析[J]. 环境科学, 32(10): 2834-2839. |
| WANG S H, JIANG X, JIN X C, 2011. Classification and pollution characteristics analysis for inflow rivers of Chaohu Lake[J]. Environmental Science, 32(10): 2834-2839. | |
| [21] | 王新兰, 2006. 入海河流对近岸海域海湾影响分析[J]. 辽宁城乡环境科技, 26(1): 21-23. |
| WANG X L, 2006. Analysis of inflow rivers impact on offshore bay[J]. Liaoning Urban and Rural Environmental Science and Technology, 26(1): 21-23. | |
| [22] | 文秋红, 李丹凤, 田望舒, 等, 2015. 地表水的氮磷污染及其检测方法研究[J]. 绿色科技 (6): 255-257. |
| WEN Q H, LI D F, TIAN W S, et al., 2015. Research on nitrogen and phosphorus pollution and testing methods of surface water[J]. Journal of Green Science and Technology (6): 255-257. | |
| [23] | 严春丽, 赵明, 李泽坤, 等, 2020. 洱海北部入湖河流水质特征及其对北部湖区的影响[J]. 环境工程, 38(12): 59-63. |
| YAN C L, ZHAO M, LI Z K, et al., 2020. Characteristics of inflow rivers in northern Erhai Lake and their impact on the northern lake area[J]. Environmental Engineering, 38(12): 59-63. | |
| [24] | 闫兴成, 王明玥, 许晓光, 等, 2018. 富营养化湖泊沉积物有机质矿化过程中碳、氮、磷的迁移特征[J]. 湖泊科学, 30(2): 306-313. |
| YAN X C, WANG M Y, XU X G, et al., 2018. Migration of carbon, nitrogen and phosphorus during organic matter mineralization in eutrophic lake sediments[J]. Lake Science, 30(2): 306-313. | |
| [25] | 杨盼, 卢路, 向晨光, 等, 2019. 长江干流氮、磷浓度变化趋势分析[J]. 环境工程, 37(2): 178-181. |
| YANG P, LU L, XIANG C G, et al., 2019. Analysis of variation trend of nitrogen and phosphorus concentration in the main stream of the Yangtze River[J]. Environmental Engineering, 37(2): 178-181. | |
| [26] | 曾莉, 张鑫, 张水清, 等, 2020. 不同施氮量下潮土中小麦秸秆腐解特性及其养分释放和结构变化特征[J]. 植物营养与肥料学报, 26(9): 1565-1577. |
| ZENG L, ZHANG X, ZHANG S Q, et al., 2020. Characteristics of decomposition, nutrient release and structure change of wheat straw in a fluvo-aquic soil under different nitrogen application rates[J]. Journal of Plant Nutrition and Fertilizers, 26(9): 1565-1577. | |
| [27] | 张光贵, 卢少勇, 田琪, 2016. 近20年洞庭湖总氮和总磷浓度时空变化及其影响因素分析[J]. 环境化学, 35(11): 2377-2385. |
| ZHANG G G, LU S Y, TIAN Q, 2016. Analysis of spatial-temporal variations of total nitrogen and total phosphorus concentration and their influencing factors in Dongting Lake in the past two decades[J]. Environmental Chemistry, 35(11): 2377-2385. | |
| [28] | 张鹏, 魏良如, 赖进余, 等, 2019. 湛江湾夏季陆源入海氮磷污染物浓度、组成和通量[J]. 广东海洋大学学报, 39(4): 63-72. |
| ZHANG P, WEI L R, LAI J Y, et al., 2019. Concentration, composition and fluxes of land-based nitrogen and phosphorus source into Zhanjiang Bay in summer[J]. Journal of Guangdong Ocean University, 39(4): 63-72. | |
| [29] | 赵凯, 2019. 刘大水库总磷污染特征分析与控制[J]. 水资源开发与管理 (8): 57-60. |
| ZHAO K, 2019. Analysis and control of total phosphorus pollution in Liuda reservoir[J]. Water Resources Development and Management (8): 57-60. | |
| [30] | 赵丽, 陈俊伊, 姜霞, 等, 2020. 岱海水体氮、磷时空分布特征及其差异性分析[J]. 环境科学, 41(4): 167-174. |
| ZHAO L, CHEN J Y, JIANG X, et al., 2020. Temporal and spatial distribution characteristics and difference analysis of nitrogen and phosphorus in Daihai Lake[J]. Environmental Science, 41(4): 167-174. | |
| [31] | 赵永宏, 邓祥征, 战金艳, 等, 2010. 我国湖泊富营养化防治与控制策略研究进展[J]. 环境科学与技术, 33(3): 92-98. |
| ZHAO Y H, DENG X Z, ZHAN J Y, et al., 2010. Progress on preventing and controlling strategies of lake eutrophication in China[J]. Environmental Science and Technology, 33(3): 92-98. | |
| [32] | 郑尧文, 魏建兵, 张娜, 等, 2020. 浑河上游清原流域河流氮素污染时空变异及其与土地利用的关系[J]. 沈阳大学学报, 32(2): 123-131. |
| ZHENG R W, WEI J B, ZHANG N, et al., 2020. Spatial and temporal variation of nitrogen pollution and its relationship with land use in Qingyuan watershed of upper Hunhe River[J]. Journal of Shenyang University, 32(2): 123-131. | |
| [33] | 中华人民共和国生态环境部, 2016-2020. 中国海洋生态环境状况公报[EB/OL]. [2016-2020]. https://www.mee.gov.cn/hjzl/sthjzk/jagb/. |
| Ministry of Ecology and Environment, PRC, 2016-2020. Bulletin on China's Marine Ecological environment[EB/OL]. [2016-2020]. https://www.mee.gov.cn/hjzl/sthjzk/jagb/. | |
| [34] | 中华人民共和国生态环境部, 2020. 第二次全国污染源普查公报[EB/OL]. [2020-06-09]. https://www.mee.gov.cn/xxgk2018/xxgk/xxgk01/202006/t20200610_783547.html. |
| Ministry of Ecology and Environment, PRC, 2020. Bulletin of the second National Survey of pollution sources[EB/OL]. [2020-06-09]. https://www.mee.gov.cn/xxgk2018/xxgk/xxgk01/202006/t20200610_783547.html. | |
| [35] | 中华人民共和国统计局, 2016-2020. 中国统计年鉴[M]. 北京: 中国统计出版社. |
| National Bureau of Statistics of China, 2016-2020. China Statistical Yearbook[M]. Beijing: China Statistics Press. |
| [1] | WANG Jiayi, SUN Tingting, SHA Runyu, CHEN Tinghong, XING Ran, QIN Boqiang, SHI Wenqing. Study on the Synergic Effect of Algae Salvage on Pollution Control and Carbon Emission Reduction in Eutrophic Lakes [J]. Ecology and Environment, 2023, 32(6): 1108-1114. |
| [2] | WANG Tiezheng, QU Xinyue, LIU Chunxiang, LI Youzhi. Spatial and Temporal Changes in Water Quality in the Dongjiang Lake and Their Relationships with Land Use in the Watershed [J]. Ecology and Environment, 2023, 32(4): 722-732. |
| [3] | ZHANG Hengyu, SUN Shuchen, WU Yuanzhi, AN Juan, SONG Hongli. Distribution Characteristics of Soil Water, Carbon and Nitrogen under Different Vegetation Densities in Loess Plateau [J]. Ecology and Environment, 2022, 31(5): 875-884. |
| [4] | DU Xue, WANG Haiyan, ZOU Jiahe, MENG Hai, ZHAO Han, CUI Xue, DONG Qiqi. Distribution Characteristics and Influencing Factors of Soil Organic Carbon in Spruce-fir broad-leaved Mixed Forest on North Slope of Changbai Mountains [J]. Ecology and Environment, 2022, 31(4): 663-669. |
| [5] | HU Jingda, ZHOU Haiju, HUANG Yongzhen, YAO Xianyu, YE Shaoming, YU Sufang. A Study on Plant Species Diversity and Soil Carbon and Nitrogen in Different Cunninghamia lanceolata Stand Types [J]. Ecology and Environment, 2022, 31(3): 451-459. |
| [6] | CUI Jian, DU Yi, DING Chengcheng, LI Jinfeng, GAO Fangshu, CHANG Yajun, ZHANG Jibiao, LIU Xiaojing, YAO Dongrui. Phosphorus Fraction and Abatement of Lakes in China: A Review [J]. Ecology and Environment, 2022, 31(3): 621-633. |
| [7] | SHI Lijiang, GAO Shan, YAO Xiaojun, ZHANG Xiaolong, LI Wengang, GAO Feng. Characteristics of Soil Carbon and Nitrogen Accumulation under Different Vegetation Restoration in the Loess Hilly Region of Northwest Shanxi Province [J]. Ecology and Environment, 2021, 30(9): 1787-1796. |
| [8] | HU Lin, LI Siyue. Scale Effects of Land Use Structure and Landscape Pattern on Water Quality in the Longchuan River Basin [J]. Ecology and Environment, 2021, 30(7): 1470-1481. |
| [9] | WANG Jin, CHEN Shutao, DING Sicheng, ZHANG Miaomiao, HU Zhenghua. Effects of the Soil and Climate Factors on the Mean Turnover Times of Soil Organic Carbon [J]. Ecology and Environment, 2021, 30(6): 1192-1201. |
| Viewed | ||||||
|
Full text |
|
|||||
|
Abstract |
|
|||||
Copyright © 2021 Editorial Office of ACTA PETROLEI SINICA
Address:No. 6 Liupukang Street, Xicheng District, Beijing, P.R.China, 510650
Tel: 86-010-62067128, 86-010-62067137, 86-010-62067139
Fax: 86-10-62067130
Email: syxb@cnpc.com.cn
Support byBeijing Magtech Co.ltd, E-mail:support@magtech.com.cn