Ecology and Environment ›› 2024, Vol. 33 ›› Issue (8): 1163-1173.DOI: 10.16258/j.cnki.1674-5906.2024.08.001
• Research Article [Ecology] • Next Articles
DAI Xiaoai1,2,3( ), MA Jiaxin2, TANG Yiling2, LI Weile1
Received:2024-04-29
Online:2024-08-18
Published:2024-09-25
戴晓爱1,2,3(), 马佳欣2, 唐艺菱2, 李为乐1
作者简介:戴晓爱(1979年生),女,教授,博士,主要从事生态环境监测与评价、生态系统服务等方面的教学和研究工作。E-mail: daixiaoa@cdut.edu.cn
基金资助:CLC Number:
DAI Xiaoai, MA Jiaxin, TANG Yiling, LI Weile. Spatio-temporal Dynamics and Attribution Analysis of Vegetation in Gansu Province[J]. Ecology and Environment, 2024, 33(8): 1163-1173.
戴晓爱, 马佳欣, 唐艺菱, 李为乐. 甘肃省植被时空动态变化及其归因分析[J]. 生态环境学报, 2024, 33(8): 1163-1173.
Add to citation manager EndNote|Ris|BibTeX
URL: https://www.jeesci.com/EN/10.16258/j.cnki.1674-5906.2024.08.001

Figure 1 Schematic diagram of the studied area
| 数据 | 缩写 | 数据源 | 加工方法 | 时间 | 分辨率 |
|---|---|---|---|---|---|
| 降雨量 | Pre | 国家青藏高原科学数据中心 ( | 由逐月降水数据处理后得 | 2000‒2020 | 1 km |
| 平均气温 | Tem | 国家青藏高原科学数据中心 ( | 由逐月降水数据处理后得 | 2000‒2020 | 1 km |
| 空气湿度 | Hum | 中国地面气候资料日值数据集V3.0处理生成 | 将逐日csv文件展点后投影, 采用反距离权重法对其进行插值 | 2000‒2020 | |
| 太阳辐射 | SR | 中国区域地面气象要素驱动数据集 | 2000‒2020 | 0.1° | |
| 风速 | WS | 国家环境信息中心(NCEI) | 将逐日csv文件展点后投影, 采用反距离权重法对其进行插值 | 2000‒2020 | |
| CO2浓度 | CO2 | 中国二氧化碳排放数据1997‒2017 ( | 2000、2005、 2010、2015 | ||
| 中国城市温室气体工作组 (CCG) | 2020 | ||||
| 海拔 | Alt | 美国太空总署 (NASA) 和国防部国家测绘局 (NIMA) 联合测量 ( | 90 m | ||
| 坡度 | SLP | ArcGIS Pro 3.0中坡度工具提取 | |||
| 坡向 | ASP | ArcGIS Pro 3.0中坡向工具提取 | |||
| 土壤类型 | Soilt | 世界土壤数据库 ( | |||
| 土壤有机碳含量 | SC | https://data.isric.org | 250 m | ||
| 到最近路的距离 | DNR | ArcGIS Pro中使用邻近分析工具计算 | |||
| 人口密度 | Popd | LandScan全球人口数据 ( | 2000‒2020 | 1 km | |
| GDP | GDP | 《中国县域统计年鉴》 | 2000‒2020 | ||
| 土地利用 | LUCC | 中国区1990‒2020逐年30 m分辨率土地利用分类数据 ( | 2000‒2020 | 30 m | |
| 夜间灯光密度 | NL | 中国长时间序列夜间灯光数据集 (2000‒2020) [J/DB/OL] ( | 200‒2020 | 1 km | |
| FVC | FVC | 国家青藏高原科学数据中心( | 2000‒2020 | 250 m | |
| 逐年造林数据 | 2000‒2020年统计年鉴 | 2000‒2020 |
Table 1 Data sources
| 数据 | 缩写 | 数据源 | 加工方法 | 时间 | 分辨率 |
|---|---|---|---|---|---|
| 降雨量 | Pre | 国家青藏高原科学数据中心 ( | 由逐月降水数据处理后得 | 2000‒2020 | 1 km |
| 平均气温 | Tem | 国家青藏高原科学数据中心 ( | 由逐月降水数据处理后得 | 2000‒2020 | 1 km |
| 空气湿度 | Hum | 中国地面气候资料日值数据集V3.0处理生成 | 将逐日csv文件展点后投影, 采用反距离权重法对其进行插值 | 2000‒2020 | |
| 太阳辐射 | SR | 中国区域地面气象要素驱动数据集 | 2000‒2020 | 0.1° | |
| 风速 | WS | 国家环境信息中心(NCEI) | 将逐日csv文件展点后投影, 采用反距离权重法对其进行插值 | 2000‒2020 | |
| CO2浓度 | CO2 | 中国二氧化碳排放数据1997‒2017 ( | 2000、2005、 2010、2015 | ||
| 中国城市温室气体工作组 (CCG) | 2020 | ||||
| 海拔 | Alt | 美国太空总署 (NASA) 和国防部国家测绘局 (NIMA) 联合测量 ( | 90 m | ||
| 坡度 | SLP | ArcGIS Pro 3.0中坡度工具提取 | |||
| 坡向 | ASP | ArcGIS Pro 3.0中坡向工具提取 | |||
| 土壤类型 | Soilt | 世界土壤数据库 ( | |||
| 土壤有机碳含量 | SC | https://data.isric.org | 250 m | ||
| 到最近路的距离 | DNR | ArcGIS Pro中使用邻近分析工具计算 | |||
| 人口密度 | Popd | LandScan全球人口数据 ( | 2000‒2020 | 1 km | |
| GDP | GDP | 《中国县域统计年鉴》 | 2000‒2020 | ||
| 土地利用 | LUCC | 中国区1990‒2020逐年30 m分辨率土地利用分类数据 ( | 2000‒2020 | 30 m | |
| 夜间灯光密度 | NL | 中国长时间序列夜间灯光数据集 (2000‒2020) [J/DB/OL] ( | 200‒2020 | 1 km | |
| FVC | FVC | 国家青藏高原科学数据中心( | 2000‒2020 | 250 m | |
| 逐年造林数据 | 2000‒2020年统计年鉴 | 2000‒2020 |

Figure 2 Flow chart
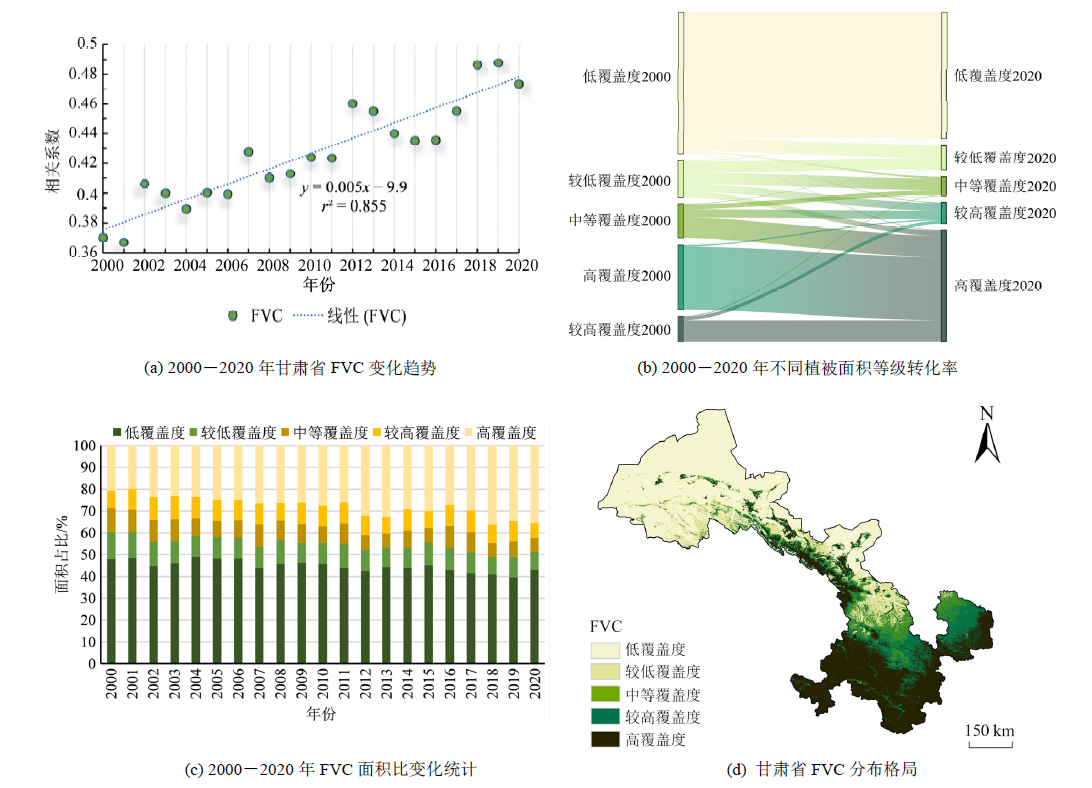
Figure 3 Temporal and spatial variations of vegetation cover in Gansu Province

Figure 4 Interannual variation, variation trend and significant area of FVC in arid, semi-arid, sub-humid and humid regions of Gansu Province
| 趋势斜率 | 标准正态分布Z值 | FVC趋势变化 | 面积占比/% |
|---|---|---|---|
| ≥5×10⁻⁴ | ≥1.96 | 明显改善 | 61.31 |
| ≥5×10⁻⁴ | −1.96‒1.96 | 轻微改善 | 22.90 |
| 1×10⁻³ | −1.96‒1.96 | 稳定不变 | 10.78 |
| <−5×10⁻⁴ | −1.96‒1.96 | 轻微退化 | 4.24 |
| <−5×10⁻⁴ | <−19.96 | 严重退化 | 0.77 |
Table 2 Area proportion of different FVC variation trends in Gansu Province
| 趋势斜率 | 标准正态分布Z值 | FVC趋势变化 | 面积占比/% |
|---|---|---|---|
| ≥5×10⁻⁴ | ≥1.96 | 明显改善 | 61.31 |
| ≥5×10⁻⁴ | −1.96‒1.96 | 轻微改善 | 22.90 |
| 1×10⁻³ | −1.96‒1.96 | 稳定不变 | 10.78 |
| <−5×10⁻⁴ | −1.96‒1.96 | 轻微退化 | 4.24 |
| <−5×10⁻⁴ | <−19.96 | 严重退化 | 0.77 |

Figure 5 Analysis results of geodetector for vegetation cover change in Gansu Province
| 干湿区 | 降水 | 气温 | 空气湿度 | 太阳辐射 | 风速 | CO2浓度 | 海拔 | 坡度 | 坡向 | 土壤类型 | 土壤有机碳含量 | 到最近道路距离 | 人口密度 | GDP | 土地利用 |
|---|---|---|---|---|---|---|---|---|---|---|---|---|---|---|---|
| 干旱区 | 0.452 | 0.151 | 0.300 | 0.133 | 0.007 | 0.124 | 0.235 | 0.091 | 0.027 | 0.467 | 0.284 | 0.230 | 0.082 | 0.247 | 0.777 |
| 半干旱区 | 0.866 | 0.251 | 0.849 | 0.476 | 0.639 | 0.372 | 0.091 | 0.102 | 0.015 | 0.500 | 0.546 | 0.313 | ‒ | 0.862 | 0.602 |
| 半湿润区 | 0.640 | 0.092 | 0.454 | 0.305 | 0.188 | 0.188 | 0.205 | 0.088 | 0.018 | 0.580 | 0.639 | ‒ | 0.002 | 0.105 | 0.277 |
| 湿润区 | 0.321 | ‒ | ‒ | ‒ | ‒ | ‒ | ‒ | ‒ | ‒ | ‒ | 0.302 | ‒ | ‒ | ‒ | 0.266 |
Table 3 Driving factors and their q values in different wet and dry regions of Gansu Province
| 干湿区 | 降水 | 气温 | 空气湿度 | 太阳辐射 | 风速 | CO2浓度 | 海拔 | 坡度 | 坡向 | 土壤类型 | 土壤有机碳含量 | 到最近道路距离 | 人口密度 | GDP | 土地利用 |
|---|---|---|---|---|---|---|---|---|---|---|---|---|---|---|---|
| 干旱区 | 0.452 | 0.151 | 0.300 | 0.133 | 0.007 | 0.124 | 0.235 | 0.091 | 0.027 | 0.467 | 0.284 | 0.230 | 0.082 | 0.247 | 0.777 |
| 半干旱区 | 0.866 | 0.251 | 0.849 | 0.476 | 0.639 | 0.372 | 0.091 | 0.102 | 0.015 | 0.500 | 0.546 | 0.313 | ‒ | 0.862 | 0.602 |
| 半湿润区 | 0.640 | 0.092 | 0.454 | 0.305 | 0.188 | 0.188 | 0.205 | 0.088 | 0.018 | 0.580 | 0.639 | ‒ | 0.002 | 0.105 | 0.277 |
| 湿润区 | 0.321 | ‒ | ‒ | ‒ | ‒ | ‒ | ‒ | ‒ | ‒ | ‒ | 0.302 | ‒ | ‒ | ‒ | 0.266 |
| 指标 | 2000 | 2010 | 2020 |
|---|---|---|---|
| 有效样本数 | 32892 | 32873 | 32870 |
| SRMR | 0.069 | 0.075 | 0.053 |
| d_ULS | 0.169 | 0.203 | 0.101 |
| d_G | 0.217 | 0.210 | 0.188 |
Table 4 Sample size and fitting results of PLE-SEM in different years
| 指标 | 2000 | 2010 | 2020 |
|---|---|---|---|
| 有效样本数 | 32892 | 32873 | 32870 |
| SRMR | 0.069 | 0.075 | 0.053 |
| d_ULS | 0.169 | 0.203 | 0.101 |
| d_G | 0.217 | 0.210 | 0.188 |

Figure 6 Conceptual Structural equation models for 2000, 2010 and 2020
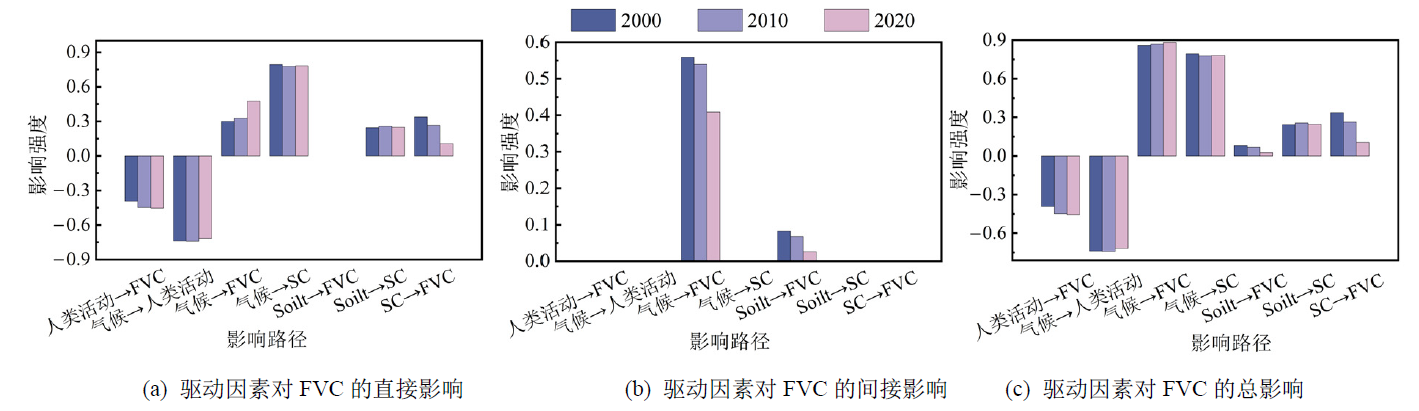
Figure 7 Direct, direct, and total effects of different potential and observable variables on annual FVC

Figure 8 Main vegetation changes in Gansu Province from 2000 to 2020
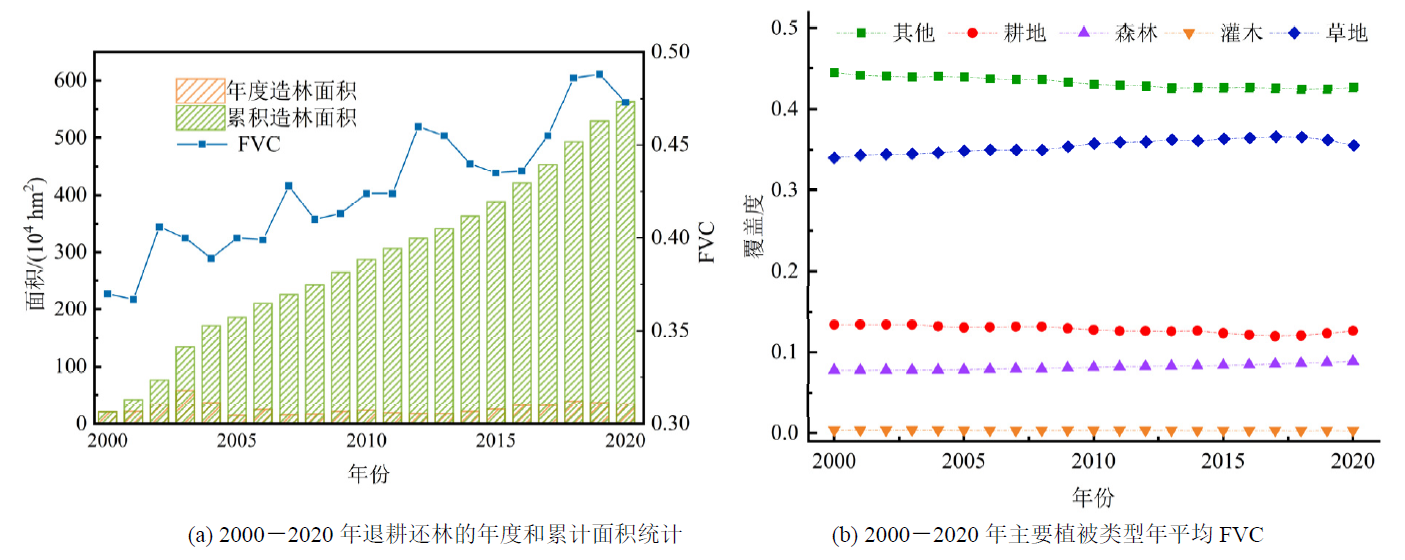
Figure 9 Gansu province afforestation and vegetation change statistics, 2000-2020
| [1] | A D, ZHAO W J, QU X Y, et al., 2016. Spatio-temporal variation of vegetation coverage and its response to climate change in North China plain in the last 33 years[J]. International Journal of Applied Earth Observation and Geoinformation, 53: 103-117. |
| [2] | BRYAN B A, GAO L, YE Y Q, et al., 2018. China’s response to a national land-system sustainability emergency[J]. Nature, 559(7713): 193-204. |
| [3] | CAI Y F, ZHANG F, DUAN P, et al., 2022. Vegetation cover changes in China induced by ecological restoration-protection projects and land-use changes from 2000 to 2020[J]. CATENA, 217: 106530. |
| [4] | CHU D, 2020. Remote sensing of land use and land cover in mountain region: A comprehensive study at the central Tibetan Plateau[M]. Singapore: Springer Singapore: XVI, 227. |
| [5] |
CLELAND E E, COLLINS S L, DICKSON T L, et al., 2013. Sensitivity of grassland plant community composition to spatial vs. temporal variation in precipitation[J]. Ecology, 94(8): 1687-1696.
PMID |
| [6] | CUI F Q, WANG B J, ZHANG Q, et al., 2021. Climate change versus land-use change—What affects the ecosystem services more in the forest-steppe ecotone?[J]. Science of The Total Environment, 759: 143525. |
| [7] | FENG D R, FU M C, SUN Y Y, et al., 2021. How large-scale anthropogenic activities influence vegetation cover change in China? A review[J]. Forests, 12(3): 320. |
| [8] | GAO W D, ZHENG C, LIU X H, et al., 2022. NDVI-based vegetation dynamics and their responses to climate change and human activities from 1982 to 2020: A case study in the Mu Us Sandy Land, China[J]. Ecological Indicators, 137: 108745. |
| [9] | GOCIC M, TRAJKOVIC S, 2013. Analysis of changes in meteorological variables using Mann-Kendall and Sen’s slope estimator statistical tests in Serbia[J]. Global and Planetary Change, 100(1): 172-182. |
| [10] | GUO X Y, WANG T, LI Z B, et al., 2023. Using PLE-SEM to quantify the impacts of natural and human factors on vegetation change: A case study of the Jialing River Basin[J]. Sustainability, 15(17): 13089. |
| [11] | HUANG K, ZHANG Y J, ZHU J T, et al., 2016. The influences of climate change and human activities on vegetation dynamics in the Qinghai-Tibet Plateau[J]. Remote Sensing, 8(10): 876. |
| [12] | JIANG L L, GULI J, BAO A M, et al., 2017. Vegetation dynamics and responses to climate change and human activities in Central Asia[J]. Science of The Total Environment, 599-600: 967-980. |
| [13] | LI S K, LI X B, GONG J R, et al., 2022. Quantitative analysis of natural and anthropogenic factors influencing vegetation NDVI changes in temperate drylands from a spatial stratified heterogeneity perspective: A case study of Inner Mongolia grasslands, China[J]. Remote Sensing, 14(14): 3320. |
| [14] | LOWRY P B, GASKIN J, 2014. Partial least squares (PLS) structural equation modeling (SEM) for building and testing behavioral causal theory: When to choose it and how to use it[J]. IEEE Transactions on Professional Communication, 57(2): 123-146. |
| [15] | OKIN G S, MURRAY B, SCHLESINGER W H, 2001. Degradation of sandy arid shrubland environments: Observations, process modelling, and management implications[J]. Journal of Arid Environments, 47(2): 123-144. |
| [16] | PIAO S L, YIN G D, TAN J G, et al., 2015. Detection and attribution of vegetation greening trend in China over the last 30 years[J]. Global Change Biology, 21(4): 1601-1609. |
| [17] | QU S, WANG L C, LIN A W, et al., 2018. What drives the vegetation restoration in Yangtze River basin, China: Climate change or anthropogenic factors?[J]. Ecological Indicators, 90: 438-450. |
| [18] |
SHENGPEI D, BO Z, HAIJUN W J, et al., 2011. Vegetation cover change and the driving factors over northwest China[J]. Journal of Arid Land, 3(1): 25-33.
DOI |
| [19] | SUN B, LI Z Y, GAO W T, et al., 2019. Identification and assessment of the factors driving vegetation degradation/regeneration in drylands using synthetic high spatiotemporal remote sensing Data: A case study in Zhenglanqi, Inner Mongolia, China[J]. Ecological Indicators, 107: 105614. |
| [20] | VIOLLE C, CHOLER P, BORGY B, et al., 2015. Vegetation ecology meets ecosystem science: Permanent grasslands as a functional biogeography case study[J]. Science of The Total Environment, 534: 43-51. |
| [21] | YU S X, WANG L, ZHAO J S, et al., 2021. Using structural equation modelling to identify regional socio-economic driving forces of soil erosion: A case study of Jiangxi Province, southern China[J]. Journal of Environmental Management, 279: 111616. |
| [22] | ZHANG X F, LIAO C H, LI J, et al., 2013. Fractional vegetation cover estimation in arid and semi-arid environments using HJ-1 satellite hyperspectral data[J]. International Journal of Applied Earth Observation and Geoinformation, 21(1): 506-512. |
| [23] | ZHAO X H, ZHANG F M, LIU Q, et al., 2023. Climate change overshadows human activities in enhancing vegetation activity in Inner Mongolia[J]. Theoretical and Applied Climatology, 154(1-2): 245-259. |
| [24] | 丁海勇, 丁昕玮, 2020. 基于SPOT_NDVI的甘肃省植被覆盖变化及其与气候、地形因子的关系[J]. 长江流域资源与环境, 29(12): 2665-2678. |
| DING H Y, DING X W, 2020. Vegetation cover change and its relationship with climate and topographic factors in Gansu Province based on SPOT_NDVI[J]. Resources and Environment in the Yangtze River Basin, 29(12): 2665-2678. | |
| [25] |
何国兴, 柳小妮, 张德罡, 等, 2021. 甘肃省草地NPP时空变化及对气候因子的响应[J]. 草地学报, 29(4): 788-797.
DOI |
| HE G X, LIU X N, ZHANG D G, et al., 2021. Spatio-temporal variation of NPP and its response to climate factors in grassland, Gansu Province[J]. Acta Grassland Sinica, 29(4): 788-797. | |
| [26] | 胡春艳, 卫伟, 王晓峰, 等, 2016. 甘肃省植被覆盖变化及其对退耕还林工程的响应[J]. 生态与农村环境学报, 32(4): 588-594. |
| HU C Y, WEI W, WANG X F, et al., 2016. Change in vegetation cover as affected by Grain for Green Project in Gansu[J]. Journal of Ecology and Rural Environment, 32(4): 588-594. | |
| [27] | 靳峰, 戈文艳, 秦伟, 等, 2023. 甘肃省植被时空变化及其未来发展潜力[J]. 中国水土保持科学(中英文), 21(1): 110-118. |
| JIN F, GE W Y, QIN W, et al., 2023. Spatiotemporal variation of vegetation and its future development potential in Gansu province[J]. Science of Soil and Water Conservation in China, 21(1): 110-118. | |
| [28] | 李双双, 延军平, 万佳, 2012. 近10年陕甘宁黄土高原区植被覆盖时空变化特征[J]. 地理学报, 67(7): 960-970. |
|
LI S S, YAN J P, WAN J, 2012. The spatial-temporal changes of vegetation restoration on Loess Plateau in Shaanxi-Gansu-Ningxia region[J]. Acta Geographica Sinica, 67(7): 960-970.
DOI |
|
| [29] | 吕泳洁, 丁文广, 邓喆, 等, 2022. 基于地理探测器的甘肃省植被覆盖时空变化及驱动力分析[J]. 地球环境学报, 13(2): 185-195. |
| LÜ Y J, DING W G, DENG Z, et al., 2022. Spatiotemporal variation of vegetation cover and its driving forces in Gansu Province based on geodetector[J]. Journal of Earth Environment, 13(2): 185-195. | |
| [30] |
李帅呈, 龚健, 杨建新, 等, 2023. 兰西城市群土地利用/覆被变化模式特征——基于强度分析框架[J]. 资源科学, 45(3): 480-493.
DOI |
| LI S C GONG J, YANG J X, et al., 2023. Characteristics of LUCC patterns of the Lanzhou-Xining urban agglomeration: Based on an intensity analysis framework[J]. Resources Science, 45(3): 480-493. | |
| [31] | 彭鸿嘉, 傅伯杰, 陈利顶, 等, 2004. 甘肃民勤荒漠区植被演替特征及驱动力研究——以民勤为例[J]. 中国沙漠, 24(5): 628-633. |
| PENG H J, FU B J, CHEN L D, et al., 2004. Study on features of vegetation succession and its driving force in Gansu desert areas: A case study at Minqin County[J]. Journal of Desert Research, 24(5): 628-633. | |
| [32] | 申建秀, 王秀红, 刘羽, 等, 2012. 退耕还林前后甘肃正宁县生态系统服务价值的时空变化特征[J]. 水土保持研究, 19(4): 59-64. |
| SHEN J X, WANG X H, LIU Y, et al., 2012. Spatio-temporal changes of ecosystem service value in Zhengning County, Gansu Province before and after the 'Grain-for-Green' policy[J]. Soil and Water Conservation Research, 19(4): 59-64. | |
| [33] |
王劲峰, 徐成东, 2017. 地理探测器: 原理与展望[J]. 地理学报, 72(1): 116-134.
DOI |
| WANG J F, XU C D, 2017. Geodetectors. Geodetector: Principle and prospective[J]. Journal of Geography, 72(1): 116-134. |
| Viewed | ||||||
|
Full text |
|
|||||
|
Abstract |
|
|||||
Copyright © 2021 Editorial Office of ACTA PETROLEI SINICA
Address:No. 6 Liupukang Street, Xicheng District, Beijing, P.R.China, 510650
Tel: 86-010-62067128, 86-010-62067137, 86-010-62067139
Fax: 86-10-62067130
Email: syxb@cnpc.com.cn
Support byBeijing Magtech Co.ltd, E-mail:support@magtech.com.cn