Ecology and Environment ›› 2024, Vol. 33 ›› Issue (7): 1130-1141.DOI: 10.16258/j.cnki.1674-5906.2024.07.014
• Research Article [Environmental Science] • Previous Articles Next Articles
WANG Xuerong( ), GONG Jianzhou*(), YU Fangyuan
Received:2024-04-10
Online:2024-07-18
Published:2024-09-04
Contact:
GONG Jianzhou
王雪融(), 龚建周*(), 俞方圆
通讯作者:
龚建周
作者简介:王雪融(2001年生),女,硕士,主要研究方向为生态系统服务与生物多样性。E-mail: 2112301032@e.gzhu.edu.cn
基金资助:CLC Number:
WANG Xuerong, GONG Jianzhou, YU Fangyuan. Mutual Feedback Relationships and Mechanisms of Ecosystem Four Regulating Services in the Greater Bay Area of Guangdong, Hongkong and Macao[J]. Ecology and Environment, 2024, 33(7): 1130-1141.
王雪融, 龚建周, 俞方圆. 粤港澳大湾区4种生态系统调节服务的互馈关系及机制[J]. 生态环境学报, 2024, 33(7): 1130-1141.
Add to citation manager EndNote|Ris|BibTeX
URL: https://www.jeesci.com/EN/10.16258/j.cnki.1674-5906.2024.07.014
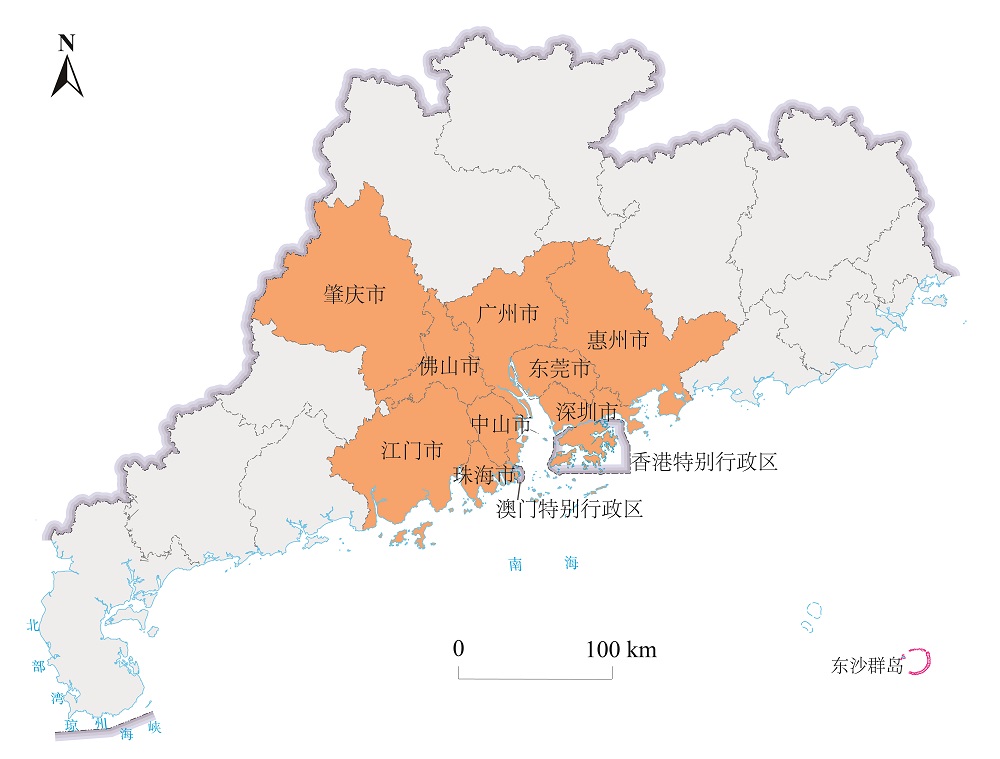
Figure 1 The overview map of Guangdong-Hong Kong-Macao Greater Bay Area
| 数据 | 年份 | 数据来源 | ||
|---|---|---|---|---|
| 类型 | 名称 | 格式 | ||
| 土地利用数据 | 到二级分类的土地利用数据 | 栅格数据 (30 m) | 2000、2010、2020 | 中国科学院资源环境科学数据中心 ( |
| 地形数据 | DEM数字高程数据 | 栅格数据 (30 m) | 中国科学院资源环境科学数据中心 ( | |
| 二级流域 | 矢量数据 | 中国科学院资源环境科学数据中心 ( | ||
| 气象数据 | 逐日降雨量数据 | txt文档 | 2000、2010、2020 | 国家气象信息中心 ( |
| 逐月潜在蒸散发数据 | 栅格数据 (1 km) | 2020 | 国家地球系统科学数据中心 ( | |
| 土地土壤数据 | 基于世界土壤数据库 (HWSD) 的 中国土壤数据集 (v1.1) | 栅格数据 (1 km) | 国家冰川冻土沙漠科学数据中心 ( | |
| 植被数据 | 归一化植被指数 | 栅格数据 (1 km) | 2020 | 国家地球系统科学数据中心 ( |
| 社会经济数据 | 人口密度空间分布数据 | 栅格数据 (1 km) | 2020 | 美国能源部橡树岭国家实验室 (ORNL) ( |
| 中国公里网格GDP数据集 (百万元) | 栅格数据 (1 km) | 2020 | 国家地球系统科学数据中心 ( | |
Table 1 Data sources
| 数据 | 年份 | 数据来源 | ||
|---|---|---|---|---|
| 类型 | 名称 | 格式 | ||
| 土地利用数据 | 到二级分类的土地利用数据 | 栅格数据 (30 m) | 2000、2010、2020 | 中国科学院资源环境科学数据中心 ( |
| 地形数据 | DEM数字高程数据 | 栅格数据 (30 m) | 中国科学院资源环境科学数据中心 ( | |
| 二级流域 | 矢量数据 | 中国科学院资源环境科学数据中心 ( | ||
| 气象数据 | 逐日降雨量数据 | txt文档 | 2000、2010、2020 | 国家气象信息中心 ( |
| 逐月潜在蒸散发数据 | 栅格数据 (1 km) | 2020 | 国家地球系统科学数据中心 ( | |
| 土地土壤数据 | 基于世界土壤数据库 (HWSD) 的 中国土壤数据集 (v1.1) | 栅格数据 (1 km) | 国家冰川冻土沙漠科学数据中心 ( | |
| 植被数据 | 归一化植被指数 | 栅格数据 (1 km) | 2020 | 国家地球系统科学数据中心 ( |
| 社会经济数据 | 人口密度空间分布数据 | 栅格数据 (1 km) | 2020 | 美国能源部橡树岭国家实验室 (ORNL) ( |
| 中国公里网格GDP数据集 (百万元) | 栅格数据 (1 km) | 2020 | 国家地球系统科学数据中心 ( | |
| 生态系统服务 | 模型模块 | 计算过程 |
|---|---|---|
| 碳储量 | InVEST模型碳储存和封存模块 | Ci_tot=Ci_above+Ci_below+Ci_soil+Ci_dead Ci_tot——第i种土地利用类型的碳总量 (t∙hm−2∙a−1); Ci_above、Ci_below、Ci_soil、Ci_dead——第i种土地利用类型地上植被的碳密度、地下根系植被的碳密度、土壤的碳密度和死亡有机物的碳密度。InVEST碳储量模型计算所需要的碳库数据参考InVEST官方手册和相关文献 (吴佩君等, |
| 氮输出量 | InVEST模型养分输送模块 | Xexport, i =Lsurf, i×Nsurf, i +Lsubs, i×Nsubs, i 式中: Xexport_tot——某区域上的氮输出总量 (t∙hm−2∙a−1); Xexport, i ——单位像素i上的氮输出量 (t∙hm−2∙a−1); Lsurf, i和Lsubs, i ——像素i上的地表和地下氮载荷量; Nsurf, i和Nsubs, i ——像素i上的氮输出载荷因子。该模块所需参数参考相关区域的文献整理确定 (吴哲等, |
| 土壤保持量 | InVEST模型泥沙输移比例模块 | Sconserv, x=Srkls, x−Susle, x=Rx×Kx×Lx×1−(Cx×Px) Sconserv, x——栅格x的土壤保持量, 计算结果的单位为t∙hm−2∙a−1; Srkls,x——栅格x的土壤潜在侵蚀量; Susle, x——栅格x的土壤实际侵蚀量; Rx——降雨侵蚀力因子 (MJ∙mm∙hm−2∙h−1∙a−1); Kx——土壤侵蚀因子 (t∙hm2∙h∙hm−2∙MJ−1∙mm−1); Cx——作物/植被覆盖和管理因子; Px——水土保持措施因子。其中土壤保持模块所需要的生物物理属性表的参数来源于官网提供的模型参考数据和相似地区的研究成果 (王万忠等, |
| 授粉者丰度 | InVEST模型授粉模块 | x——单元栅格; β——物种; Nj ——土地利用类型j筑巢的重要性; Fj ——土地利用类型j产生的花卉资源的相对数量; Dmx——单元格m和x之间的欧氏距离; αβ——传粉者β的预期觅食距离; Pxβ——传粉者类型β在栅格x上的供应量; Dox——栅格x到农业栅格o之间的距离; αβ——传粉者种类β的标准觅食距离。其中,模型所需要的土地利用属性表和传粉属性数据参考官网提供的模型参考数据和相似地区的研究成果 (Groff et al., |
Table 2 Models used to quantify ecosystem services
| 生态系统服务 | 模型模块 | 计算过程 |
|---|---|---|
| 碳储量 | InVEST模型碳储存和封存模块 | Ci_tot=Ci_above+Ci_below+Ci_soil+Ci_dead Ci_tot——第i种土地利用类型的碳总量 (t∙hm−2∙a−1); Ci_above、Ci_below、Ci_soil、Ci_dead——第i种土地利用类型地上植被的碳密度、地下根系植被的碳密度、土壤的碳密度和死亡有机物的碳密度。InVEST碳储量模型计算所需要的碳库数据参考InVEST官方手册和相关文献 (吴佩君等, |
| 氮输出量 | InVEST模型养分输送模块 | Xexport, i =Lsurf, i×Nsurf, i +Lsubs, i×Nsubs, i 式中: Xexport_tot——某区域上的氮输出总量 (t∙hm−2∙a−1); Xexport, i ——单位像素i上的氮输出量 (t∙hm−2∙a−1); Lsurf, i和Lsubs, i ——像素i上的地表和地下氮载荷量; Nsurf, i和Nsubs, i ——像素i上的氮输出载荷因子。该模块所需参数参考相关区域的文献整理确定 (吴哲等, |
| 土壤保持量 | InVEST模型泥沙输移比例模块 | Sconserv, x=Srkls, x−Susle, x=Rx×Kx×Lx×1−(Cx×Px) Sconserv, x——栅格x的土壤保持量, 计算结果的单位为t∙hm−2∙a−1; Srkls,x——栅格x的土壤潜在侵蚀量; Susle, x——栅格x的土壤实际侵蚀量; Rx——降雨侵蚀力因子 (MJ∙mm∙hm−2∙h−1∙a−1); Kx——土壤侵蚀因子 (t∙hm2∙h∙hm−2∙MJ−1∙mm−1); Cx——作物/植被覆盖和管理因子; Px——水土保持措施因子。其中土壤保持模块所需要的生物物理属性表的参数来源于官网提供的模型参考数据和相似地区的研究成果 (王万忠等, |
| 授粉者丰度 | InVEST模型授粉模块 | x——单元栅格; β——物种; Nj ——土地利用类型j筑巢的重要性; Fj ——土地利用类型j产生的花卉资源的相对数量; Dmx——单元格m和x之间的欧氏距离; αβ——传粉者β的预期觅食距离; Pxβ——传粉者类型β在栅格x上的供应量; Dox——栅格x到农业栅格o之间的距离; αβ——传粉者种类β的标准觅食距离。其中,模型所需要的土地利用属性表和传粉属性数据参考官网提供的模型参考数据和相似地区的研究成果 (Groff et al., |
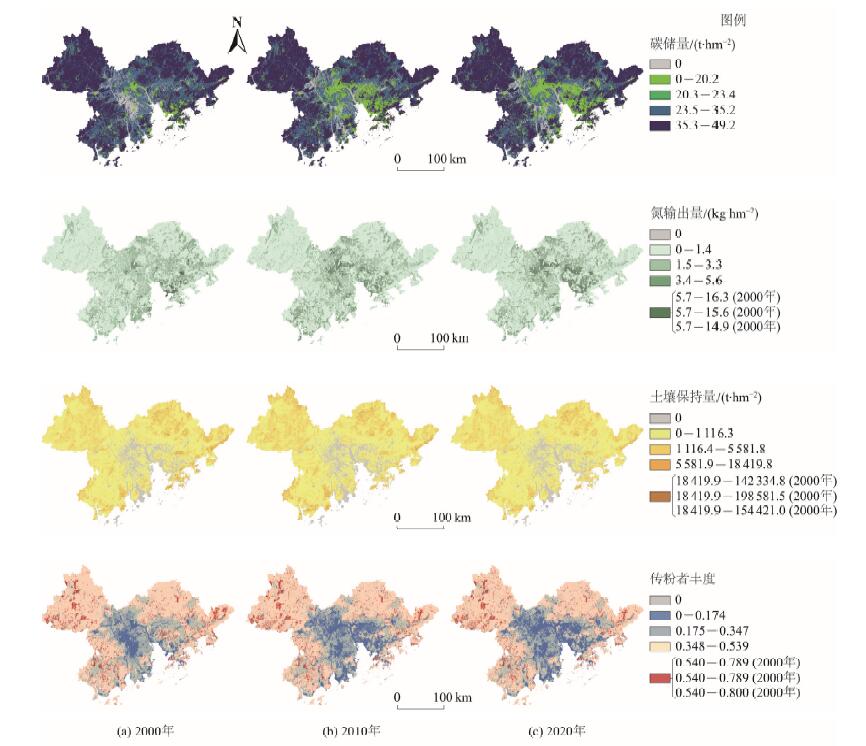
Figure 2 Spatial distribution of regulating services in the Guangdong-Hong Kong-Macao Greater Bay Area
| 生态系统服务 | 年份 | ||
|---|---|---|---|
| 2000年 | 2010年 | 2020年 | |
| 碳储量/(t∙hm−2) | 37.20 | 36.39 | 36.10 |
| 氮输出量/(kg∙hm−2) | 1.45 | 1.51 | 1.51 |
| 土壤保持量/(t∙hm−2) | 9161 | 9583 | 7958 |
| 授粉者丰度 | 0.36 | 0.35 | 0.34 |
Table 3 Statistics on the average value of regulating services in the Guangdong-Hong Kong-Macao Greater Bay Area
| 生态系统服务 | 年份 | ||
|---|---|---|---|
| 2000年 | 2010年 | 2020年 | |
| 碳储量/(t∙hm−2) | 37.20 | 36.39 | 36.10 |
| 氮输出量/(kg∙hm−2) | 1.45 | 1.51 | 1.51 |
| 土壤保持量/(t∙hm−2) | 9161 | 9583 | 7958 |
| 授粉者丰度 | 0.36 | 0.35 | 0.34 |
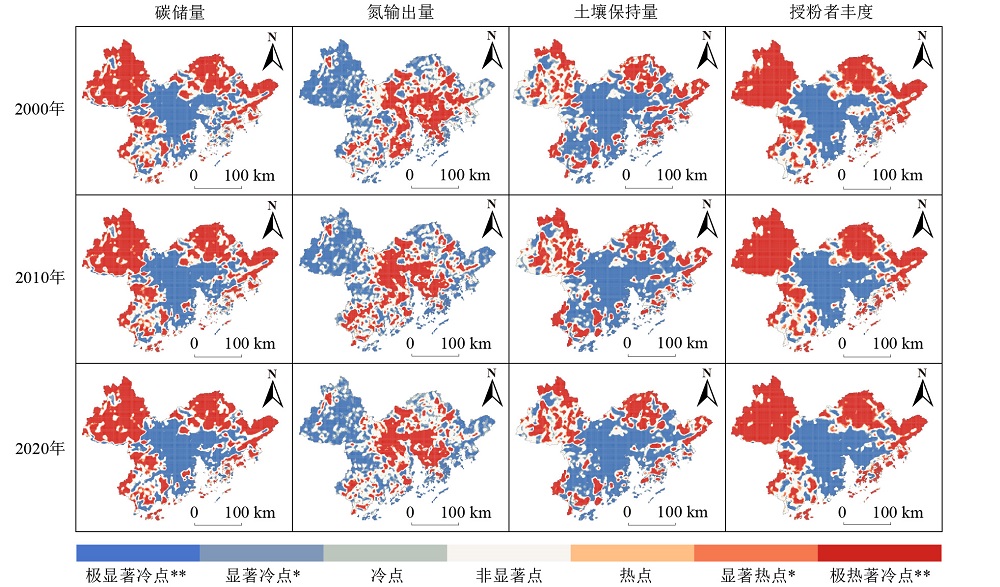
Figure 3 Cold and hot spots of four regulating services in the Guangdong-Hong Kong-Macao Greater Bay Area
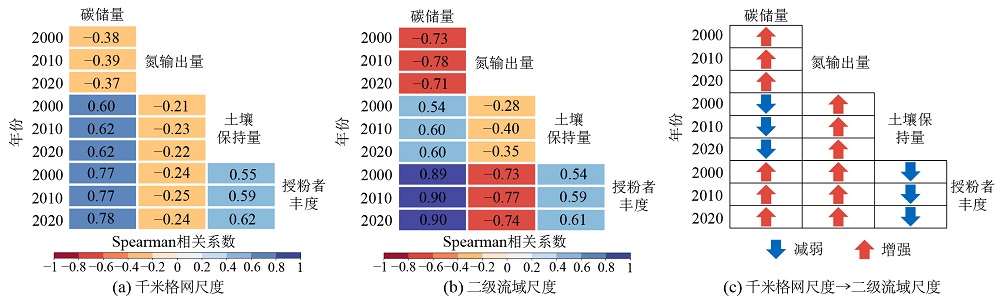
Figure 4 Trade-offs/synergies between types of regulating services in the Guangdong-Hong Kong-Macao Greater Bay Area at both grid and sub-watershed scales
| 因变量 | 自变量 | 空间回归系数均值 | 因变量 | 自变量 | 空间回归系数均值 | ||
|---|---|---|---|---|---|---|---|
| 千米格网尺度 | 二级流域尺度 | 千米格网尺度 | 二级流域尺度 | ||||
| 碳储量 | 氮输出量 | −0.641 | −2.863 | 氮输出量 | 碳储量 | −0.206 | −0.209 |
| 碳储量 | 土壤保持量 | 3.602 | 21.639 | 土壤保持量 | 碳储量 | 0.032 | 0.011 |
| 碳储量 | 授粉者丰度 | 1.172 | 1.313 | 授粉者丰度 | 碳储量 | 0.389 | 0.608 |
| 氮输出量 | 土壤保持量 | −1.143 | −3.840 | 土壤保持量 | 氮输出量 | −0.038 | −0.021 |
| 授粉者丰度 | 氮输出量 | −0.262 | −1.653 | 氮输出量 | 授粉者丰度 | −0.204 | −0.285 |
| 授粉者丰度 | 土壤保持量 | 1.490 | 12.055 | 土壤保持量 | 授粉者丰度 | 0.027 | 0.018 |
Table 4 Averages of spatial regression coefficients
| 因变量 | 自变量 | 空间回归系数均值 | 因变量 | 自变量 | 空间回归系数均值 | ||
|---|---|---|---|---|---|---|---|
| 千米格网尺度 | 二级流域尺度 | 千米格网尺度 | 二级流域尺度 | ||||
| 碳储量 | 氮输出量 | −0.641 | −2.863 | 氮输出量 | 碳储量 | −0.206 | −0.209 |
| 碳储量 | 土壤保持量 | 3.602 | 21.639 | 土壤保持量 | 碳储量 | 0.032 | 0.011 |
| 碳储量 | 授粉者丰度 | 1.172 | 1.313 | 授粉者丰度 | 碳储量 | 0.389 | 0.608 |
| 氮输出量 | 土壤保持量 | −1.143 | −3.840 | 土壤保持量 | 氮输出量 | −0.038 | −0.021 |
| 授粉者丰度 | 氮输出量 | −0.262 | −1.653 | 氮输出量 | 授粉者丰度 | −0.204 | −0.285 |
| 授粉者丰度 | 土壤保持量 | 1.490 | 12.055 | 土壤保持量 | 授粉者丰度 | 0.027 | 0.018 |
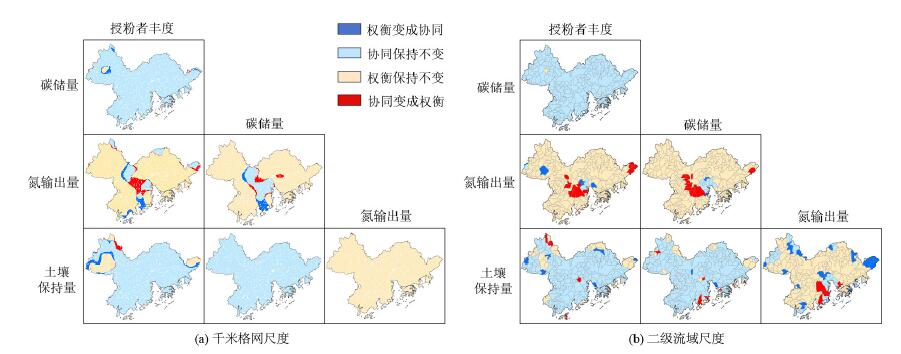
Figure 5 Spatial and temporal changes in regulating services trade-offs/synergies in the Guangdong-Hong Kong-Macao Greater Bay Area from 2000 to 2020
| 自变量-影响因子 (X) | 因变量 | |||||||||
|---|---|---|---|---|---|---|---|---|---|---|
| 千米格网尺度 | 二级流域尺度 | |||||||||
| 碳储量 | 氮输出量 | 土壤保持量 | 授粉者丰度 | 碳储量 | 氮输出量 | 土壤保持量 | 授粉者丰度 | |||
| 自然 因子 | 年均温度 | 0.329 | 0.098 | 0.143 | 0.441 | 0.749 | 0.326 | 0.625 | 0.756 | |
| 高程 | 0.431 | 0.160 | 0.183 | 0.459 | 0.820 | 0.368 | 0.802 | 0.801 | ||
| 年均降雨量 | 0.043 | 0.041 | 0.037 | 0.068 | 0.201 | 0.273 | 0.238 | 0.196 | ||
| 归一化植被指数 | 0.473 | 0.167 | 0.114 | 0.551 | 0.945 | 0.546 | 0.565 | 0.934 | ||
| 年均蒸发量 | 0.154 | 0.066 | 0.076 | 0.215 | 0.392 | 0.277 | 0.386 | 0.408 | ||
| 坡度 | 0.288 | 0.128 | 0.135 | 0.274 | 0.836 | 0.462 | 0.743 | 0.805 | ||
| 社会经济因子 | 年均生产总值 | 0.322 | 0.252 | 0.095 | 0.434 | 0.734 | 0.680 | 0.514 | 0.806 | |
| 人口密度 | 0.321 | 0.256 | 0.138 | 0.384 | 0.744 | 0.671 | 0.526 | 0.753 | ||
| 生态系统服务因子 | 碳储量 | - | 0.565 | 0.122 | 0.743 | - | 0.598 | 0.566 | 0.945 | |
| 氮输出量 | 0.589 | - | 0.137 | 0.344 | 0.641 | - | 0.343 | 0.636 | ||
| 土壤保持量 | 0.426 | 0.174 | - | 0.401 | 0.752 | 0.370 | - | 0.743 | ||
| 授粉者丰度 | 0.678 | 0.180 | 0.111 | - | 0.946 | 0.615 | 0.564 | - | ||
Table 5 Regulating services impact factor q value statistics
| 自变量-影响因子 (X) | 因变量 | |||||||||
|---|---|---|---|---|---|---|---|---|---|---|
| 千米格网尺度 | 二级流域尺度 | |||||||||
| 碳储量 | 氮输出量 | 土壤保持量 | 授粉者丰度 | 碳储量 | 氮输出量 | 土壤保持量 | 授粉者丰度 | |||
| 自然 因子 | 年均温度 | 0.329 | 0.098 | 0.143 | 0.441 | 0.749 | 0.326 | 0.625 | 0.756 | |
| 高程 | 0.431 | 0.160 | 0.183 | 0.459 | 0.820 | 0.368 | 0.802 | 0.801 | ||
| 年均降雨量 | 0.043 | 0.041 | 0.037 | 0.068 | 0.201 | 0.273 | 0.238 | 0.196 | ||
| 归一化植被指数 | 0.473 | 0.167 | 0.114 | 0.551 | 0.945 | 0.546 | 0.565 | 0.934 | ||
| 年均蒸发量 | 0.154 | 0.066 | 0.076 | 0.215 | 0.392 | 0.277 | 0.386 | 0.408 | ||
| 坡度 | 0.288 | 0.128 | 0.135 | 0.274 | 0.836 | 0.462 | 0.743 | 0.805 | ||
| 社会经济因子 | 年均生产总值 | 0.322 | 0.252 | 0.095 | 0.434 | 0.734 | 0.680 | 0.514 | 0.806 | |
| 人口密度 | 0.321 | 0.256 | 0.138 | 0.384 | 0.744 | 0.671 | 0.526 | 0.753 | ||
| 生态系统服务因子 | 碳储量 | - | 0.565 | 0.122 | 0.743 | - | 0.598 | 0.566 | 0.945 | |
| 氮输出量 | 0.589 | - | 0.137 | 0.344 | 0.641 | - | 0.343 | 0.636 | ||
| 土壤保持量 | 0.426 | 0.174 | - | 0.401 | 0.752 | 0.370 | - | 0.743 | ||
| 授粉者丰度 | 0.678 | 0.180 | 0.111 | - | 0.946 | 0.615 | 0.564 | - | ||
| 因变量 | 研究尺度 | 自变量 | ||||||||
|---|---|---|---|---|---|---|---|---|---|---|
| X1 | X2 | X3 | X4 | X5 | X6 | X7 | X8 | |||
| 碳储量 | ∩氮输出量 | 千米格网 | 0.657 | 0.678 | 0.617 | 0.704 | 0.623 | 0.634 | 0.684 | 0.669 |
| 二级流域 | 0.919 | 0.919 | 0.802 | 0.966 | 0.744 | 0.899 | 0.857 | 0.868 | ||
| ∩土壤保持量 | 千米格网 | 0.473 | 0.506 | 0.441* | 0.532 | 0.451 | 0.467 | 0.491 | 0.481 | |
| 二级流域 | 0.882 | 0.852 | 0.839* | 0.963 | 0.833 | 0.860 | 0.883 | 0.920 | ||
| ∩授粉者丰度 | 千米格网 | 0.696 | 0.712 | 0.685* | 0.697 | 0.690 | 0.696 | 0.705 | 0.704 | |
| 二级流域 | 0.963 | 0.965 | 0.969* | 0.969 | 0.958 | 0.971 | 0.969 | 0.970 | ||
| 氮输出量 | ∩碳储量 | 千米格网 | 0.668 | 0.654 | 0.673 | 0.649 | 0.668 | 0.645 | 0.646 | 0.645 |
| 二级流域 | 0.753 | 0.693 | 0.788* | 0.662 | 0.714 | 0.665 | 0.828 | 0.847 | ||
| ∩土壤保持量 | 千米格网 | 0.203 | 0.213 | 0.226* | 0.213 | 0.217 | 0.204 | 0.299 | 0.298 | |
| 二级流域 | 0.588 | 0.461 | 0.739* | 0.608 | 0.639 | 0.591 | 0.770 | 0.804 | ||
| ∩授粉者丰度 | 千米格网 | 0.231 | 0.234 | 0.237* | 0.233 | 0.227.0 | 0.219 | 0.333 | 0.331 | |
| 二级流域 | 0.765 | 0.727 | 0.824* | 0.702 | 0.737 | 0.718 | 0.818 | 0.831 | ||
| 土壤保持量 | ∩碳储量 | 千米格网 | 0.177 | 0.195 | 0.152 | 0.144 | 0.150 | 0.170 | 0.147 | 0.169 |
| 二级流域 | 0.803 | 0.842 | 0.812 | 0.713 | 0.774 | 0.771 | 0.689 | 0.717 | ||
| ∩氮输出量 | 千米格网 | 0.213 | 0.244 | 0.175* | 0.189 | 0.180 | 0.216 | 0.188 | 0.209 | |
| 二级流域 | 0.787 | 0.879 | 0.795* | 0.731 | 0.679 | 0.860 | 0.727 | 0.744 | ||
| ∩授粉者丰度 | 千米格网 | 0.165 | 0.192 | 0.150* | 0.136 | 0.136 | 0.167 | 0.140 | 0.164 | |
| 二级流域 | 0.751 | 0.848 | 0.809* | 0.682 | 0.744 | 0.773 | 0.671 | 0.712 | ||
| 授粉者丰度 | ∩碳储量 | 千米格网 | 0.839 | 0.835 | 0.764 | 0.836 | 0.787 | 0.779 | 0.803 | 0.784 |
| 二级流域 | 0.962 | 0.959 | 0.965 | 0.959 | 0.960 | 0.960 | 0.967 | 0.965 | ||
| ∩氮输出量 | 千米格网 | 0.545 | 0.520 | 0.402* | 0.596 | 0.435 | 0.419 | 0.565 | 0.514 | |
| 二级流域 | 0.933 | 0.915 | 0.873* | 0.958 | 0.792 | 0.886 | 0.893 | 0.882 | ||
| ∩土壤保持量 | 千米格网 | 0.531 | 0.532 | 0.439* | 0.577 | 0.469 | 0.451 | 0.530 | 0.493 | |
| 二级流域 | 0.888 | 0.863 | 0.876* | 0.961 | 0.851 | 0.852 | 0.921 | 0.932 | ||
Table 6 Interaction of regulating services with impact factors
| 因变量 | 研究尺度 | 自变量 | ||||||||
|---|---|---|---|---|---|---|---|---|---|---|
| X1 | X2 | X3 | X4 | X5 | X6 | X7 | X8 | |||
| 碳储量 | ∩氮输出量 | 千米格网 | 0.657 | 0.678 | 0.617 | 0.704 | 0.623 | 0.634 | 0.684 | 0.669 |
| 二级流域 | 0.919 | 0.919 | 0.802 | 0.966 | 0.744 | 0.899 | 0.857 | 0.868 | ||
| ∩土壤保持量 | 千米格网 | 0.473 | 0.506 | 0.441* | 0.532 | 0.451 | 0.467 | 0.491 | 0.481 | |
| 二级流域 | 0.882 | 0.852 | 0.839* | 0.963 | 0.833 | 0.860 | 0.883 | 0.920 | ||
| ∩授粉者丰度 | 千米格网 | 0.696 | 0.712 | 0.685* | 0.697 | 0.690 | 0.696 | 0.705 | 0.704 | |
| 二级流域 | 0.963 | 0.965 | 0.969* | 0.969 | 0.958 | 0.971 | 0.969 | 0.970 | ||
| 氮输出量 | ∩碳储量 | 千米格网 | 0.668 | 0.654 | 0.673 | 0.649 | 0.668 | 0.645 | 0.646 | 0.645 |
| 二级流域 | 0.753 | 0.693 | 0.788* | 0.662 | 0.714 | 0.665 | 0.828 | 0.847 | ||
| ∩土壤保持量 | 千米格网 | 0.203 | 0.213 | 0.226* | 0.213 | 0.217 | 0.204 | 0.299 | 0.298 | |
| 二级流域 | 0.588 | 0.461 | 0.739* | 0.608 | 0.639 | 0.591 | 0.770 | 0.804 | ||
| ∩授粉者丰度 | 千米格网 | 0.231 | 0.234 | 0.237* | 0.233 | 0.227.0 | 0.219 | 0.333 | 0.331 | |
| 二级流域 | 0.765 | 0.727 | 0.824* | 0.702 | 0.737 | 0.718 | 0.818 | 0.831 | ||
| 土壤保持量 | ∩碳储量 | 千米格网 | 0.177 | 0.195 | 0.152 | 0.144 | 0.150 | 0.170 | 0.147 | 0.169 |
| 二级流域 | 0.803 | 0.842 | 0.812 | 0.713 | 0.774 | 0.771 | 0.689 | 0.717 | ||
| ∩氮输出量 | 千米格网 | 0.213 | 0.244 | 0.175* | 0.189 | 0.180 | 0.216 | 0.188 | 0.209 | |
| 二级流域 | 0.787 | 0.879 | 0.795* | 0.731 | 0.679 | 0.860 | 0.727 | 0.744 | ||
| ∩授粉者丰度 | 千米格网 | 0.165 | 0.192 | 0.150* | 0.136 | 0.136 | 0.167 | 0.140 | 0.164 | |
| 二级流域 | 0.751 | 0.848 | 0.809* | 0.682 | 0.744 | 0.773 | 0.671 | 0.712 | ||
| 授粉者丰度 | ∩碳储量 | 千米格网 | 0.839 | 0.835 | 0.764 | 0.836 | 0.787 | 0.779 | 0.803 | 0.784 |
| 二级流域 | 0.962 | 0.959 | 0.965 | 0.959 | 0.960 | 0.960 | 0.967 | 0.965 | ||
| ∩氮输出量 | 千米格网 | 0.545 | 0.520 | 0.402* | 0.596 | 0.435 | 0.419 | 0.565 | 0.514 | |
| 二级流域 | 0.933 | 0.915 | 0.873* | 0.958 | 0.792 | 0.886 | 0.893 | 0.882 | ||
| ∩土壤保持量 | 千米格网 | 0.531 | 0.532 | 0.439* | 0.577 | 0.469 | 0.451 | 0.530 | 0.493 | |
| 二级流域 | 0.888 | 0.863 | 0.876* | 0.961 | 0.851 | 0.852 | 0.921 | 0.932 | ||
| [1] |
ALEJANDRE E M, SCHERER L, AIZEN M A, et al., 2023. Characterization factors to assess land use impacts on pollinator abundance in life cycle assessment[J]. Environmental Science and Technology, 57(8): 3445-3454.
DOI PMID |
| [2] | BAI Y, ZHUANG C W, OUYANG Z Y, et al., 2011. Spatial characteristics between biodiversity and ecosystem services in a human-dominated watershed[J]. Ecological Complexity, 8(2): 177-183. |
| [3] |
BENNETT E M, PETERSON G D, GORDON L J, 2009. Understanding relationships among multiple ecosystem services[J]. Ecology Letters, 12(12): 1394-1404.
DOI PMID |
| [4] | BENNETT E M, CRAMER W, BEGOSSI A, et al., 2015. Linking biodiversity, ecosystem services, and human well-being: three challenges for designing research for sustainability[J]. Current Opinion Environmental Sustainability, 14: 76-85. |
| [5] | CLARK C M, THOMAS R Q, HORN K J, 2023. Above-ground tree carbon storage in response to nitrogen deposition in the U.S. is heterogeneous and may have weakened[J]. Communications Earth & Environment, 4(1): 35. |
| [6] | COSTANZA R, GROOT R D, BRAAT L, et al., 2017. Twenty years of ecosystem services: How far have we come and how far do we still need to go?[J]. Ecosystem Services, 28(Part A): 1-16. |
| [7] | GALLOWAY J N, TOWNSEND A R, ERISMAN J W, et al., 2008. Transformation of then nitrogen cycle: Recent trends, questions, and potential solutions[J]. Science, 320(5878): 889-892. |
| [8] | GAO J B, JIANG Y, WANG H, et al., 2020. Identification of dominant factors affecting soil erosion and water yield within ecological red line areas[J]. Remote Sensing, 12(3): 399. |
| [9] | GROFF S C, LOFTIN C S, DRUMMOND F, et al., 2016. Parameterization of the InVEST Crop Pollination Model to spatially predict abundance of wild blueberry (Vaccinium angustifolium Aiton) native bee pollinators in Maine, USA[J]. Environmental Modelling and Software, 79: 1-9. |
| [10] | JIAN Y X, JI X C, YAN X L, 2020. Partitioned responses of ecosystem services and their tradeoffs to human activities in the Belt and Road region[J]. Journal of Cleaner Production, 276: 123205. |
| [11] | KICKLIGHTER D W, MELILLO J M, MONIER E, et al., 2019. Future nitrogen availability and its effect on carbon sequestration in Northern Eurasia[J]. Nature Communication, 10(1): 3024. |
| [12] |
LAL R, 2003. Soil erosion and the global carbon budget[J]. Environment International, 29(4): 437-450.
PMID |
| [13] |
MONTGOMERY D R, 2007. Soil erosion and agricultural sustainability[J]. Proceedings of the National Academy of Sciences of the United States of America, 104(33): 13268-13272.
PMID |
| [14] | ONTL T A, SCHULTE L A, 2012. Soil carbon storage[J]. Nature Education Knowledge, 3(10): 35. |
| [15] | PAN Y D, BIRDSEY R A, PHILLIPS O L, et al., 2013. The structure, distribution, and biomass of the world’s forests[J]. Annual Review of Ecology, Evolution, and Systematics, 44: 593-622. |
| [16] | SONG Y Z, WANG J F, GE Y, et al., 2020. An optimal parameters-based geographical detector model enhances geographic characteristics of explanatory variables for spatial heterogeneity analysis: cases with different types of spatial data[J]. GIScience & Remote Sensing, 57(5): 593-610. |
| [17] | SUN X, WU J, TANG H, et al., 2022. An urban hierarchy-based approach integrating ecosystem services into multiscale sustainable land use planning: The case of China[J]. Resources, Conservation and Recycling, 178: 106097. |
| [18] | SUTHERLAND I J, VILLAMAGNA A M, DALLAIRE C O, et al., 2018. Undervalued and under pressure: A plea for greater attention toward regulating ecosystem services[J]. Ecological Indicators, 94(2): 23-32. |
| [19] | WALTER V R, 2005. Millennium ecosystem assessment: Ecosystems and human well-being[M]. Washington DC: Island Press. |
| [20] | WINGREE R, DUSHOFF J, CRONE E E, et al., 2005. Testing simple indices of habitat proximity[J]. American Naturalist, 165(6): 707-717. |
| [21] | XIA H, YUAN S F, ALEXANDER V, 2023. Spatial-temporal heterogeneity of ecosystem service interactions and their social-ecological drivers: Implications for spatial planning and management[J]. Resources, Conservation and Recycling, 189: 106767. |
| [22] | ZHENG D F, WANG Y H, HAO S, et al., 2020. Spatial-temporal variation and tradeoffs/synergies analysis on multiple ecosystem services: A case study in the Three-River Headwaters region of China[J]. Ecological Indicators, 116: 106494. |
| [23] |
邓钰栎, 王丹, 许涵, 2023. 双尺度下广东韶关市生态系统服务及其权衡/协同关系及社会生态驱动因素[J]. 应用生态学报, 34(11): 3073-3084.
DOI |
|
DENG Y Y, WANG D, XU H, 2023. Trade-offs and synergies relationships of ecosystem services and their socio-ecological driving factors under different spatial scales in Shaoguan City, Guangdong, China[J]. Chinese Journal of Applied Ecology, 34(11): 3073-3084.
DOI |
|
| [24] | 董斯齐, 黄翀, 2021. 粤港澳大湾区陆源氮污染来源结构与空间分布[J]. 环境科学, 42(11): 5384-5393. |
| DONG S Q, HUANG C, 2021. Land-based nitrogen pollution source structure and spatial distribution in Guangdong-Hong Kong-Macao Greater Bay Area[J]. Environmental Science, 42(11): 5384-5393. | |
| [25] |
高阳, 沈振, 张中浩, 等, 2024. 生态系统服务视角下的社会——生态系统耦合模拟研究进展[J]. 地理学报, 79(1): 134-146.
DOI |
|
GAO Y, SHEN Z, ZHANG Z H, et al., 2024. Advance in simulation of social-ecological system coupling under the perspective of ecosystem services[J]. Acta Geographica Sinica, 79(1): 134-146.
DOI |
|
| [26] | 韩会庆, 罗绪强, 游仁龙, 等, 2016. 基于InVEST模型的贵州省珠江流域水质净化功能分析[J]. 南京林业大学学报: 自然科学版, 40(5): 87-92. |
| HAN H Q, LUO X Q, YOU R L, et al., 2016. Analysis of water purification function in the Pearl River basin in Guizhou Province using InVEST model[J]. Journal of Nanjing Forestry University (Natural Sciences Edition), 40(5): 87-92. | |
| [27] |
林媚珍, 刘汉仪, 周汝波, 等, 2021. 多情景模拟下粤港澳大湾区生态系统服务评估与权衡研究[J]. 地理研究, 40(9): 2657-2669.
DOI |
| LIN M Z, LIU H Y, ZHOU R B, et al., 2021. Evaluation and trade-offs of ecosystem services in Guangdong-Hong Kong-Macao Greater Bay Area under multi-scenario simulation[J]. Geographical research, 40(9): 2657-2669. | |
| [28] | 欧阳芳, 王丽娜, 闫卓, 等, 2019. 中国农业生态系统昆虫授粉功能量与服务价值评估[J]. 生态学报, 39(1): 131-145. |
| OU Y F, WANG L N, YAN Z, et al., 2019. Evaluation of insect pollination and service value in China's agricultural ecosystems[J]. Acta Ecologica Sinica, 39(1): 131-145. | |
| [29] |
沈中健, 曾坚, 2021. 闽南三市城镇发展与地表温度的空间关系[J]. 地理学报, 76(3): 566-583.
DOI |
|
SHEN Z J, ZENG J, 2021. Spatial relationship of urban development to land surface temperature in three cities of southern Fujian[J]. Acta Geographica Sinica, 76(3): 566-583.
DOI |
|
| [30] |
孙翠清, 赵芝俊, 2016. 中国农业对蜜蜂授粉的依赖形势分析——基于依赖蜜蜂授粉作物的种植情况[J]. 中国农学通报, 32(8): 13-21.
DOI |
| SUN C Q, ZHAO Z J, 2016. Chinese Agriculture's dependence on bee pollination: Plantation status of crops depending on bee pollination[J]. Chinese Agricultural Science Bulletin, 32(8): 13-21. | |
| [31] |
王成武, 罗俊杰, 唐鸿湖, 2023. 基于InVEST模型的太行山沿线地区生态系统碳储量时空分异驱动力分析[J]. 生态环境学报, 32(2): 215-225.
DOI |
| WANG C W, LUO J J, TANG H H, 2023. Analysis on the driving force of spatial and temporal differentiation of carbon storage in the Taihang Mountains based on InVEST Model[J]. Ecology and Environmental Sciences, 32(2): 215-225. | |
| [32] |
王劲峰, 徐成东, 2017. 地理探测器: 原理与展望[J]. 地理学报, 72(1): 116-134.
DOI |
| WANG J F, XU C D, 2017. Geodetector: Principle and prospective[J]. Acta Geographica Sinic, 72(1): 116-134. | |
| [33] | 王晶, 赵文武, 刘月, 等, 2019. 植物功能性状对土壤保持的影响研究述评[J]. 生态学报, 39(9): 3355-3364. |
| WANG J, ZHAO W W, LIU Y, et al., 2019. Effects of plant functional traits on soil conservation: A review[J]. Acta Ecologica Sinica, 39(9): 3355-3364. | |
| [34] | 王启名, 杨昆, 李立晓, 等, 2023. 滇池流域水文生态系统服务权衡与协同时空异质性及其归因分析[J]. 生态学报, 43(12): 4876-4891. |
| WANG Q M, YANG K, LI L X, et al., 2023. Spatial-temporal heterogeneity and attribution analysis of hydrological ecosystem services tradeoffs and synergies in Dianchi Lake Basin[J]. Acta Ecologica Sinica, 43(12): 4876-4891. | |
| [35] | 王世豪, 黄麟, 徐新良, 等, 2020. 粤港澳大湾区生态系统服务时空演化及其权衡与协同特征[J]. 生态学报, 40(23): 8403-8416. |
| WANG S H, HUANG L, XU X L, et al., 2020. Spatial and temporal evolution of ecosystem services and its trade-offs and synergies in Guangdong-Hong Kong-Macao Greater Bay Area[J]. Acta Ecologica Sinica, 40(23): 8403-8416. | |
| [36] | 王万忠, 焦菊英, 1996. 中国的土壤侵蚀因子定量评价研究[J]. 水土保持通报, 16(5): 1-20. |
| WANG W Z, JIAO J Y, 1996. Quantitative evaluation on factors influencing soil erosion in China[J]. Bulletin of Soil and Water Conservation, 16(5): 1-20. | |
| [37] | 危小建, 辛思怡, 张颖艺, 等, 2023. 不同格网尺度下生态系统服务价值空间分异及其影响因素差异——以大南昌都市圈为例[J]. 生态学报, 43(18): 7585-7597. |
| WEI X J, XIN S Y, ZHANG Y Y, et al., 2023. Spatial difference of ecological services and its influencing factors under different scales: Taking the Nanchang Urban Agglomeration as an example[J]. Acta Ecologica Sinica, 43(18): 7585-7597. | |
| [38] | 吴隽宇, 张一蕾, 江伟康, 2020. 粤港澳大湾区生态系统碳储量时空演变[J]. 风景园林, 27(10): 57-63. |
| WU J Y, ZHANG Y L, JIANG W K, 2020. Spatial-temporal evolution of ecosystem carbon storage in Guangdong-Hong Kong-Macao Greater Bay Area[J]. Landscape Architecture, 27(10): 57-63. | |
| [39] | 吴佩君, 刘小平, 黎夏, 等, 2016. 基于InVEST模型和元胞自动机的城市扩张对陆地生态系统碳储量影响评估——以广东省为例[J]. 地理与地理信息科学, 32(5): 2-28. |
| WU P J, LIU X P, LI X, et al., 2016. Impact of urban expansion on carbon storage in terrestrial ecosystems based on InVEST Model and CA: A case study of Guangdong Province, China[J]. Geography and Geo-information Science, 32(5): 22-28. | |
| [40] | 吴哲, 陈歆, 刘贝贝, 等, 2013. 基于InVEST模型的海南岛氮磷营养物负荷的风险评估[J]. 热带作物学报, 34(9): 1791-1797. |
| WU Z, CHEN X, LIU B B, et al., 2013. Risk Assessment of nitrogen and phosphorus loading in Hainan Island based on InVEST Model[J]. Chinese Journal of Tropical Crops, 34(9): 1791-1797. | |
| [41] | 杨阳, 窦艳星, 王云强, 等, 2022. 黄土丘陵沟壑区典型小流域生态系统服务权衡与协同关系研究[J]. 生态学报, 42(20): 8152-8168. |
| YANG Y, DOU Y X, WANG Y Q, et al., 2022. Ecosystem service tradeoffs and synergies in typical small watersheds of the hilly and gully region of the Loess Plateau[J]. Acta Ecologica Sinica, 42(20): 8152-8168. | |
| [42] |
尹礼唱, 王晓峰, 张琨, 等, 2019. 国家屏障区生态系统服务权衡与协同[J]. 地理研究, 38(9): 2162-2172.
DOI |
| YIN L C, WANG X F, ZHANG K, et al., 2019. Trade-offs and synergy between ecosystem services in National Barrier Zone[J]. Geographical Research, 38(9): 2162-2172. | |
| [43] | 张碧天, 闵庆文, 焦雯珺, 等, 2021. 生态系统服务权衡研究进展[J]. 生态学报, 41(14): 5517-5532. |
| ZHANG B T, MIN Q W, JIAO W J, et al., 2021. Research progress and perspective on ecosystem services trade- offs[J]. Acta Ecologica Sinica, 41(14): 5517-5532. | |
| [44] | 张学锋, 罗岳雄, 梁正之, 2004. 广东蜜源概况及蜜蜂授粉现状[J]. 中国养蜂 (1): 13-14. |
| ZHANG X F, LUO Y X, LIANG Z Z, 2004. Overview of nectar sources in Guangdong and the current situation of honey bee pollination[J]. Apiculture of China (1): 13-14. | |
| [45] | 张永民, 2007. 生态系统与人类福祉: 评估框架: 千年生态系统评估[M]. 北京: 中国环境科学出版社. |
| ZHANG Y M, 2007. Ecosystems and human well-being: Millennium Ecosystem Assessment[M]. Beijing: China Environmental Science Press. | |
| [46] | 周璟, 张旭东, 何丹, 等, 2011. 基于GIS与RUSLE的武陵山区小流域土壤侵蚀评价研究[J]. 长江流域资源与环境, 20(4): 468-474. |
| ZHOU J, ZHANG X D, HE D, et al., 2011. Soil erosion evaluation of small watershed in Wuling mountain based on GIS and RUSLE[J]. Resources and Environment in the Yangtze Basin, 20(4): 468-474. | |
| [47] |
左丽媛, 姜远, 高江波, 等, 2022. 生态保护红线区生态系统服务多维驱动力的定量分离[J]. 地理学报, 77(9): 2174-2188.
DOI |
|
ZUO L Y, JIANG Y, GAO J B, et al., 2022. Quantitative separation of multi-dimensional driving forces of ecosystem services in the ecological conservation red line area[J]. Acta Geographica Sinica, 77(9): 2174-2188.
DOI |
| Viewed | ||||||
|
Full text |
|
|||||
|
Abstract |
|
|||||
Copyright © 2021 Editorial Office of ACTA PETROLEI SINICA
Address:No. 6 Liupukang Street, Xicheng District, Beijing, P.R.China, 510650
Tel: 86-010-62067128, 86-010-62067137, 86-010-62067139
Fax: 86-10-62067130
Email: syxb@cnpc.com.cn
Support byBeijing Magtech Co.ltd, E-mail:support@magtech.com.cn