Ecology and Environment ›› 2022, Vol. 31 ›› Issue (9): 1713-1724.DOI: 10.16258/j.cnki.1674-5906.2022.09.001
• Research Articles • Next Articles
FENG Xianhui1,2,*( ), ZENG Zhilin3
Received:2022-04-11
Online:2022-09-18
Published:2022-11-07
Contact:
FENG Xianhui
冯娴慧1,2,*(), 曾芝琳3
通讯作者:
冯娴慧
作者简介:冯娴慧(1977年生),女,副教授,博士,研究方向为城市与区域生态、绿地生境机理、城市微气候等。E-mail: xhfeng@scut.edu.cn
基金资助:CLC Number:
FENG Xianhui, ZENG Zhilin. Natural Driving Forces of Vegetation Cover Characteristics and Change Trends in the Guangdong-Hong Kong-Macao Greater Bay Area[J]. Ecology and Environment, 2022, 31(9): 1713-1724.
冯娴慧, 曾芝琳. 粤港澳大湾区植被覆盖特征与变化趋势的自然驱动力研究[J]. 生态环境学报, 2022, 31(9): 1713-1724.
Add to citation manager EndNote|Ris|BibTeX
URL: https://www.jeesci.com/EN/10.16258/j.cnki.1674-5906.2022.09.001
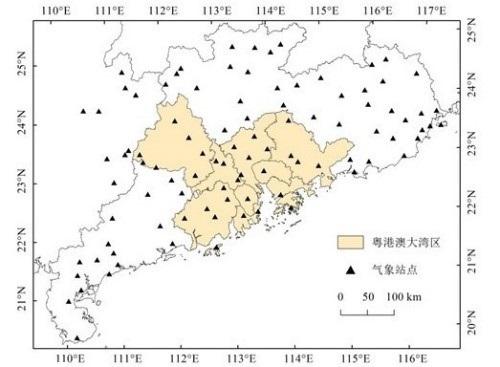
Figure 1 Distribution of Meteorological station
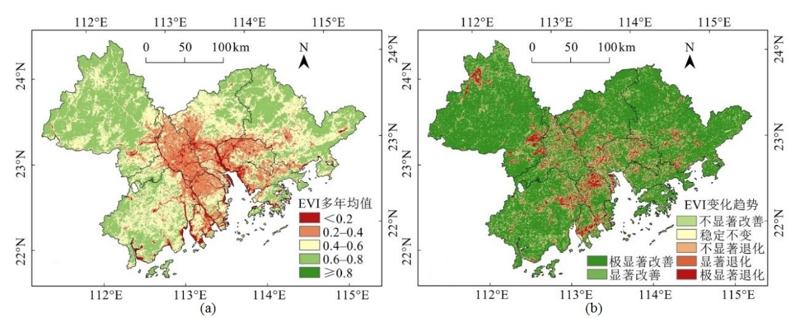
Figure 2 Multi-year mean EVI (a) and EVI trends (b) in The Guangdong-Hong Kong-Macao Greater Bay Area (GBA) from 2001 to 2020
| βEVI | Z值 Z value | 趋势变化 EVI trends | 面积占比 Area proportion/% |
|---|---|---|---|
| S>0.0005 | >2.58 | 极显著改善 | 66.98 |
| S>0.0005 | 1.96<|Z|≤2.58 | 显著改善 | 6.83 |
| S>0.0005 | |Z|≤1.96 | 不显著改善 | 9.91 |
| -0.0005≤S≤0.0005 | - | 稳定不变 | 4.14 |
| S<-0.0005 | |Z|≤1.96 | 不显著退化 | 4.73 |
| S<-0.0005 | 1.96<|Z|≤2.58 | 显著退化 | 1.73 |
| S<-0.0005 | |Z|>2.58 | 极显著退化 | 5.70 |
Table 1 Statistic of EVI trends
| βEVI | Z值 Z value | 趋势变化 EVI trends | 面积占比 Area proportion/% |
|---|---|---|---|
| S>0.0005 | >2.58 | 极显著改善 | 66.98 |
| S>0.0005 | 1.96<|Z|≤2.58 | 显著改善 | 6.83 |
| S>0.0005 | |Z|≤1.96 | 不显著改善 | 9.91 |
| -0.0005≤S≤0.0005 | - | 稳定不变 | 4.14 |
| S<-0.0005 | |Z|≤1.96 | 不显著退化 | 4.73 |
| S<-0.0005 | 1.96<|Z|≤2.58 | 显著退化 | 1.73 |
| S<-0.0005 | |Z|>2.58 | 极显著退化 | 5.70 |
| EVI等级 EVI value | 总面积 占比 Proportion/% | 土地利用类型 Land use type | 植被类型 Vegetation type | ||||||||||||
|---|---|---|---|---|---|---|---|---|---|---|---|---|---|---|---|
| 耕地 Croplands | 林地 Forest | 草地 Grass | 水域 Water | 城乡建设用地 Urban area | 未利用土地 Unused land | 阔叶林 Broad-leaved forest | 针叶林 Coniferous forest | 灌丛 Brush | 草丛 Grass cluster | 栽培植被 Cultivation of vegetation | 高山植被 Alpine vegetation | 其他 Others | |||
| EVI<0.2 (Ⅰ) | 3.92 | 2.01 | 0.26 | 0.93 | 21.12 | 10.03 | 28.57 | 0.04 | 0.45 | 0.66 | 0.43 | 5.05 | 62.96 | 15.52 | |
| 0.2≤EVI<0.4 (Ⅱ) | 17.97 | 20.81 | 2.60 | 5.66 | 46.44 | 58.80 | 57.14 | 0.36 | 3.26 | 6.13 | 4.54 | 36.80 | 25.93 | 25.86 | |
| 0.4≤EVI<0.6 (Ⅲ) | 37.43 | 56.85 | 32.77 | 49.87 | 28.05 | 27.63 | 14.29 | 15.85 | 28.32 | 37.71 | 26.36 | 45.26 | 11.11 | 41.38 | |
| 0.6≤EVI<0.8 (Ⅳ) | 40.66 | 20.33 | 64.34 | 43.53 | 4.38 | 3.53 | 0.00 | 83.74 | 67.97 | 55.46 | 68.67 | 12.90 | 0.00 | 17.24 | |
| EVI≥0.8 (Ⅴ) | 0.02 | 0.00 | 0.03 | 0.00 | 0.00 | 0.01 | 0.00 | 0.00 | 0.00 | 0.04 | 0.00 | 0.00 | 0.00 | 0.00 | |
Table 2 Statistic of EVI in different land use and vegetation type
| EVI等级 EVI value | 总面积 占比 Proportion/% | 土地利用类型 Land use type | 植被类型 Vegetation type | ||||||||||||
|---|---|---|---|---|---|---|---|---|---|---|---|---|---|---|---|
| 耕地 Croplands | 林地 Forest | 草地 Grass | 水域 Water | 城乡建设用地 Urban area | 未利用土地 Unused land | 阔叶林 Broad-leaved forest | 针叶林 Coniferous forest | 灌丛 Brush | 草丛 Grass cluster | 栽培植被 Cultivation of vegetation | 高山植被 Alpine vegetation | 其他 Others | |||
| EVI<0.2 (Ⅰ) | 3.92 | 2.01 | 0.26 | 0.93 | 21.12 | 10.03 | 28.57 | 0.04 | 0.45 | 0.66 | 0.43 | 5.05 | 62.96 | 15.52 | |
| 0.2≤EVI<0.4 (Ⅱ) | 17.97 | 20.81 | 2.60 | 5.66 | 46.44 | 58.80 | 57.14 | 0.36 | 3.26 | 6.13 | 4.54 | 36.80 | 25.93 | 25.86 | |
| 0.4≤EVI<0.6 (Ⅲ) | 37.43 | 56.85 | 32.77 | 49.87 | 28.05 | 27.63 | 14.29 | 15.85 | 28.32 | 37.71 | 26.36 | 45.26 | 11.11 | 41.38 | |
| 0.6≤EVI<0.8 (Ⅳ) | 40.66 | 20.33 | 64.34 | 43.53 | 4.38 | 3.53 | 0.00 | 83.74 | 67.97 | 55.46 | 68.67 | 12.90 | 0.00 | 17.24 | |
| EVI≥0.8 (Ⅴ) | 0.02 | 0.00 | 0.03 | 0.00 | 0.00 | 0.01 | 0.00 | 0.00 | 0.00 | 0.04 | 0.00 | 0.00 | 0.00 | 0.00 | |

Figure 3 EVI trends of vegetation types (a) and EVI trends of land use type (b) in GBA from 2001 to 2020
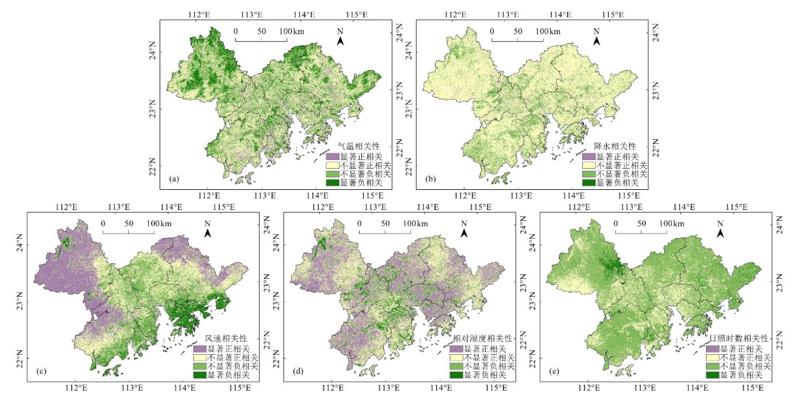
Figure 4 Correlation and significance between EVI trends and climate factors
| 相关性 Correlation | 气温影响区域 Temperature drive area/% | 降水影响区域 Precipitation drive area/% | 风速影响区域 Wind speed drive area/% | 相对湿度影响区域 Relative humidity drive area/% | 日照时数影响区域 Sunshine duration drive area/% |
|---|---|---|---|---|---|
| 显著正相关 Significant positive correlation (r>0, P<0.05) | 7.15 | 2.51 | 32.99 | 37.74 | 0.44 |
| 不显著正相关 No-significant positive correlation (r>0, P≥0.05) | 42.01 | 74.14 | 32.75 | 42.49 | 28.25 |
| 不显著负相关 No-significant negative correlation (r<0, P≥0.05) | 36.43 | 22.63 | 25.06 | 14.00 | 68.22 |
| 显著负相关 Significant negative correlation (r<0, P<0.05) | 14.40 | 0.71 | 9.20 | 5.77 | 3.09 |
Table 3 Correlation area statistics of climate factors influence the proportion of EVI trends
| 相关性 Correlation | 气温影响区域 Temperature drive area/% | 降水影响区域 Precipitation drive area/% | 风速影响区域 Wind speed drive area/% | 相对湿度影响区域 Relative humidity drive area/% | 日照时数影响区域 Sunshine duration drive area/% |
|---|---|---|---|---|---|
| 显著正相关 Significant positive correlation (r>0, P<0.05) | 7.15 | 2.51 | 32.99 | 37.74 | 0.44 |
| 不显著正相关 No-significant positive correlation (r>0, P≥0.05) | 42.01 | 74.14 | 32.75 | 42.49 | 28.25 |
| 不显著负相关 No-significant negative correlation (r<0, P≥0.05) | 36.43 | 22.63 | 25.06 | 14.00 | 68.22 |
| 显著负相关 Significant negative correlation (r<0, P<0.05) | 14.40 | 0.71 | 9.20 | 5.77 | 3.09 |
| EVI值 EVI value | 高程梯度 Elevation gradients/m | 坡度 Slope/(°) | |||||||||
|---|---|---|---|---|---|---|---|---|---|---|---|
| <82 | 82-217 | 217-394 | 394-653 | >653 | ≤2 | 2-6 | 6-15 | 15-25 | >25 | ||
| EVI<0.2 (Ⅰ) | 6.69 | 0.11 | 0.00 | 0.00 | 0.00 | 13.10 | 4.30 | 1.76 | 0.42 | 0.35 | |
| 0.2≤EVI<0.4 (Ⅱ) | 30.37 | 1.38 | 0.12 | 0.08 | 0.12 | 41.28 | 30.03 | 10.42 | 2.09 | 1.20 | |
| 0.4≤EVI<0.6 (Ⅲ) | 47.79 | 3.02 | 14.76 | 10.49 | 11.53 | 37.79 | 47.51 | 40.84 | 28.02 | 21.82 | |
| 0.6≤EVI<0.8 (Ⅳ) | 15.14 | 65.44 | 85.12 | 89.43 | 88.35 | 7.82 | 18.17 | 46.97 | 69.44 | 76.59 | |
| EVI≥0.8 (Ⅴ) | 0.01 | 0.05 | 0.01 | 0.00 | 0.00 | 0.00 | 0.00 | 0.01 | 0.03 | 0.04 | |
Table 4 Statistic of EVI values over different elevation gradients and different slope
| EVI值 EVI value | 高程梯度 Elevation gradients/m | 坡度 Slope/(°) | |||||||||
|---|---|---|---|---|---|---|---|---|---|---|---|
| <82 | 82-217 | 217-394 | 394-653 | >653 | ≤2 | 2-6 | 6-15 | 15-25 | >25 | ||
| EVI<0.2 (Ⅰ) | 6.69 | 0.11 | 0.00 | 0.00 | 0.00 | 13.10 | 4.30 | 1.76 | 0.42 | 0.35 | |
| 0.2≤EVI<0.4 (Ⅱ) | 30.37 | 1.38 | 0.12 | 0.08 | 0.12 | 41.28 | 30.03 | 10.42 | 2.09 | 1.20 | |
| 0.4≤EVI<0.6 (Ⅲ) | 47.79 | 3.02 | 14.76 | 10.49 | 11.53 | 37.79 | 47.51 | 40.84 | 28.02 | 21.82 | |
| 0.6≤EVI<0.8 (Ⅳ) | 15.14 | 65.44 | 85.12 | 89.43 | 88.35 | 7.82 | 18.17 | 46.97 | 69.44 | 76.59 | |
| EVI≥0.8 (Ⅴ) | 0.01 | 0.05 | 0.01 | 0.00 | 0.00 | 0.00 | 0.00 | 0.01 | 0.03 | 0.04 | |
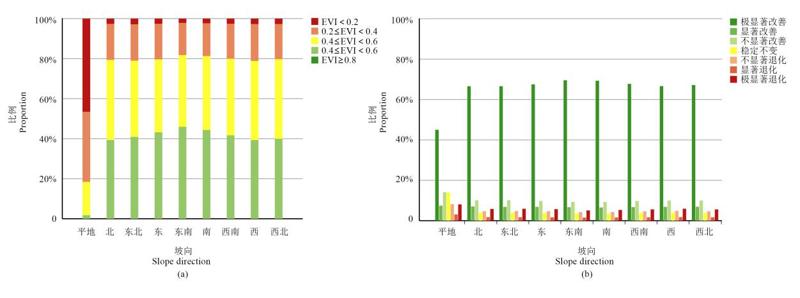
Figure 5 Correlation between EVI Distribution (a), EVI trends (b) and different slope factors
| Z值 Z value | 趋势变化 EVI trends | 高程梯度 Elevation gradients/m | 坡度 Slope/(°) | |||||||||
|---|---|---|---|---|---|---|---|---|---|---|---|---|
| <82 | 82-217 | 217-394 | 394-653 | >653 | ≤2 | 2-6 | 6-15 | 15-25 | >25 | |||
| >2.58 | 极显著改善 | 57.02 | 82.29 | 82.61 | 77.86 | 63.40 | 45.75 | 56.69 | 74.29 | 81.22 | 79.97 | |
| 1.96<|Z|≤2.58 | 显著改善 | 6.74 | 6.14 | 6.91 | 8.38 | 11.18 | 7.10 | 6.90 | 6.52 | 6.65 | 7.34 | |
| |Z|≤1.96 | 不显著改善 | 11.25 | 7.02 | 7.53 | 9.74 | 16.54 | 13.31 | 11.34 | 8.56 | 7.75 | 8.53 | |
| - | 稳定不变 | 5.82 | 1.78 | 1.46 | 1.89 | 3.72 | 8.11 | 5.52 | 2.99 | 1.79 | 1.81 | |
| |Z|≤1.96 | 不显著退化 | 7.01 | 1.58 | 1.12 | 1.62 | 3.84 | 9.09 | 7.16 | 3.26 | 1.59 | 1.62 | |
| 1.96<|Z|≤2.58 | 显著退化 | 2.74 | 0.40 | 0.17 | 0.24 | 0.64 | 3.63 | 2.76 | 1.14 | 0.34 | 0.34 | |
| |Z|>2.58 | 极显著退化 | 9.42 | 0.79 | 0.20 | 0.26 | 0.69 | 12.99 | 9.63 | 3.25 | 0.68 | 0.40 | |
Table 5 Elevation gradient and slope affect the proportion of EVI trends correlation area
| Z值 Z value | 趋势变化 EVI trends | 高程梯度 Elevation gradients/m | 坡度 Slope/(°) | |||||||||
|---|---|---|---|---|---|---|---|---|---|---|---|---|
| <82 | 82-217 | 217-394 | 394-653 | >653 | ≤2 | 2-6 | 6-15 | 15-25 | >25 | |||
| >2.58 | 极显著改善 | 57.02 | 82.29 | 82.61 | 77.86 | 63.40 | 45.75 | 56.69 | 74.29 | 81.22 | 79.97 | |
| 1.96<|Z|≤2.58 | 显著改善 | 6.74 | 6.14 | 6.91 | 8.38 | 11.18 | 7.10 | 6.90 | 6.52 | 6.65 | 7.34 | |
| |Z|≤1.96 | 不显著改善 | 11.25 | 7.02 | 7.53 | 9.74 | 16.54 | 13.31 | 11.34 | 8.56 | 7.75 | 8.53 | |
| - | 稳定不变 | 5.82 | 1.78 | 1.46 | 1.89 | 3.72 | 8.11 | 5.52 | 2.99 | 1.79 | 1.81 | |
| |Z|≤1.96 | 不显著退化 | 7.01 | 1.58 | 1.12 | 1.62 | 3.84 | 9.09 | 7.16 | 3.26 | 1.59 | 1.62 | |
| 1.96<|Z|≤2.58 | 显著退化 | 2.74 | 0.40 | 0.17 | 0.24 | 0.64 | 3.63 | 2.76 | 1.14 | 0.34 | 0.34 | |
| |Z|>2.58 | 极显著退化 | 9.42 | 0.79 | 0.20 | 0.26 | 0.69 | 12.99 | 9.63 | 3.25 | 0.68 | 0.40 | |
| 土壤类型 Soil type | EVI值 EVI value | EVI变化趋势 EVI change trends | |||||||||||
|---|---|---|---|---|---|---|---|---|---|---|---|---|---|
| EVI<0.2 (Ⅰ) | 0.2≤EVI<0.4 (Ⅱ) | 0.4≤EVI<0.6 (Ⅲ) | 0.6≤EVI<0.8 (Ⅳ) | EVI≥0.8 (Ⅴ) | 极显著改善 | 显著 改善 | 不显著改善 | 稳定 不变 | 不显著退化 | 显著 退化 | 极显著退化 | ||
| 水稻土 Paddy soil | 4.47 | 33.34 | 46.28 | 15.91 | 0.00 | 52.07 | 6.85 | 11.77 | 6.01 | 8.00 | 3.19 | 12.11 | |
| 赤红壤 Latosolic red soil | 0.82 | 7.69 | 39.88 | 51.58 | 0.03 | 77.62 | 6.28 | 8.02 | 2.41 | 2.66 | 0.85 | 2.17 | |
| 红壤 Red soil | 0.00 | 0.15 | 11.60 | 88.25 | 0.00 | 76.58 | 8.56 | 10.01 | 2.12 | 1.90 | 0.30 | 0.53 | |
| 风沙土 Aeolian sandy soil | 0.00 | 23.01 | 56.64 | 20.35 | 0.00 | 74.34 | 5.31 | 5.31 | 5.31 | 4.42 | 1.77 | 3.54 | |
| 石灰(岩)土 Limestone soil | 0.00 | 0.00 | 36.73 | 63.27 | 0.00 | 85.09 | 4.82 | 6.80 | 1.75 | 0.77 | 0.33 | 0.44 | |
| 紫色土 Purple soil | 0.00 | 0.19 | 65.55 | 34.27 | 0.00 | 64.24 | 8.44 | 11.87 | 4.58 | 4.31 | 1.57 | 4.98 | |
| 石质土 Rocky soil | 0.30 | 20.08 | 48.93 | 30.69 | 0.00 | 72.88 | 7.39 | 8.68 | 3.47 | 3.82 | 1.14 | 2.63 | |
| 粗骨土 Skeletal soil | 0.19 | 2.87 | 45.35 | 51.58 | 0.00 | 78.57 | 7.16 | 8.52 | 2.14 | 2.44 | 0.49 | 0.68 | |
| 山地草甸土 Mountain meadow soil | 0.00 | 0.00 | 0.83 | 99.17 | 0.00 | 46.40 | 16.76 | 25.62 | 4.43 | 5.26 | 1.11 | 0.42 | |
| 潮土 Moisture soil | 13.66 | 64.18 | 20.67 | 1.49 | 0.00 | 52.12 | 7.33 | 12.72 | 7.10 | 7.48 | 3.37 | 9.88 | |
| 滨海盐土 Seashore saline soil | 42.06 | 37.67 | 19.83 | 0.43 | 0.00 | 41.13 | 5.78 | 13.36 | 9.10 | 11.43 | 4.92 | 14.29 | |
| 酸性硫酸盐土 Acid sulphate soil | 63.55 | 10.53 | 16.96 | 8.97 | 0.00 | 29.63 | 6.24 | 13.84 | 21.05 | 12.67 | 6.82 | 9.75 | |
| 黄壤 Yellow soil | 0.00 | 0.15 | 6.49 | 93.37 | 0.00 | 60.21 | 12.08 | 17.40 | 4.47 | 3.98 | 0.95 | 0.91 | |
| 城区 Urban area soli | 41.43 | 51.19 | 5.66 | 1.71 | 0.00 | 80.48 | 6.86 | 6.71 | 3.43 | 2.16 | 0.15 | 0.22 | |
| 湖泊、水库 Lake and reservoir soil | 6.36 | 31.02 | 45.92 | 16.70 | 0.00 | 68.85 | 6.77 | 11.03 | 3.78 | 4.62 | 1.46 | 3.50 | |
| 江、河 River soil | 30.31 | 47.25 | 20.04 | 2.41 | 0.00 | 44.62 | 7.26 | 14.34 | 9.26 | 9.51 | 3.68 | 11.32 | |
| 沙洲、岛屿 Cay and island soil | 33.33 | 49.48 | 17.19 | 0.00 | 0.00 | 44.79 | 3.65 | 15.10 | 6.77 | 12.50 | 2.60 | 14.58 | |
| 滨海盐场、养殖场 Coastal saltworks and farm soil | 0.00 | 65.00 | 35.00 | 0.00 | 0.00 | 25.00 | 1.67 | 11.67 | 13.33 | 11.67 | 10.00 | 26.67 | |
Table 6 Distribution and trends statistic of EVI on the different type of soil
| 土壤类型 Soil type | EVI值 EVI value | EVI变化趋势 EVI change trends | |||||||||||
|---|---|---|---|---|---|---|---|---|---|---|---|---|---|
| EVI<0.2 (Ⅰ) | 0.2≤EVI<0.4 (Ⅱ) | 0.4≤EVI<0.6 (Ⅲ) | 0.6≤EVI<0.8 (Ⅳ) | EVI≥0.8 (Ⅴ) | 极显著改善 | 显著 改善 | 不显著改善 | 稳定 不变 | 不显著退化 | 显著 退化 | 极显著退化 | ||
| 水稻土 Paddy soil | 4.47 | 33.34 | 46.28 | 15.91 | 0.00 | 52.07 | 6.85 | 11.77 | 6.01 | 8.00 | 3.19 | 12.11 | |
| 赤红壤 Latosolic red soil | 0.82 | 7.69 | 39.88 | 51.58 | 0.03 | 77.62 | 6.28 | 8.02 | 2.41 | 2.66 | 0.85 | 2.17 | |
| 红壤 Red soil | 0.00 | 0.15 | 11.60 | 88.25 | 0.00 | 76.58 | 8.56 | 10.01 | 2.12 | 1.90 | 0.30 | 0.53 | |
| 风沙土 Aeolian sandy soil | 0.00 | 23.01 | 56.64 | 20.35 | 0.00 | 74.34 | 5.31 | 5.31 | 5.31 | 4.42 | 1.77 | 3.54 | |
| 石灰(岩)土 Limestone soil | 0.00 | 0.00 | 36.73 | 63.27 | 0.00 | 85.09 | 4.82 | 6.80 | 1.75 | 0.77 | 0.33 | 0.44 | |
| 紫色土 Purple soil | 0.00 | 0.19 | 65.55 | 34.27 | 0.00 | 64.24 | 8.44 | 11.87 | 4.58 | 4.31 | 1.57 | 4.98 | |
| 石质土 Rocky soil | 0.30 | 20.08 | 48.93 | 30.69 | 0.00 | 72.88 | 7.39 | 8.68 | 3.47 | 3.82 | 1.14 | 2.63 | |
| 粗骨土 Skeletal soil | 0.19 | 2.87 | 45.35 | 51.58 | 0.00 | 78.57 | 7.16 | 8.52 | 2.14 | 2.44 | 0.49 | 0.68 | |
| 山地草甸土 Mountain meadow soil | 0.00 | 0.00 | 0.83 | 99.17 | 0.00 | 46.40 | 16.76 | 25.62 | 4.43 | 5.26 | 1.11 | 0.42 | |
| 潮土 Moisture soil | 13.66 | 64.18 | 20.67 | 1.49 | 0.00 | 52.12 | 7.33 | 12.72 | 7.10 | 7.48 | 3.37 | 9.88 | |
| 滨海盐土 Seashore saline soil | 42.06 | 37.67 | 19.83 | 0.43 | 0.00 | 41.13 | 5.78 | 13.36 | 9.10 | 11.43 | 4.92 | 14.29 | |
| 酸性硫酸盐土 Acid sulphate soil | 63.55 | 10.53 | 16.96 | 8.97 | 0.00 | 29.63 | 6.24 | 13.84 | 21.05 | 12.67 | 6.82 | 9.75 | |
| 黄壤 Yellow soil | 0.00 | 0.15 | 6.49 | 93.37 | 0.00 | 60.21 | 12.08 | 17.40 | 4.47 | 3.98 | 0.95 | 0.91 | |
| 城区 Urban area soli | 41.43 | 51.19 | 5.66 | 1.71 | 0.00 | 80.48 | 6.86 | 6.71 | 3.43 | 2.16 | 0.15 | 0.22 | |
| 湖泊、水库 Lake and reservoir soil | 6.36 | 31.02 | 45.92 | 16.70 | 0.00 | 68.85 | 6.77 | 11.03 | 3.78 | 4.62 | 1.46 | 3.50 | |
| 江、河 River soil | 30.31 | 47.25 | 20.04 | 2.41 | 0.00 | 44.62 | 7.26 | 14.34 | 9.26 | 9.51 | 3.68 | 11.32 | |
| 沙洲、岛屿 Cay and island soil | 33.33 | 49.48 | 17.19 | 0.00 | 0.00 | 44.79 | 3.65 | 15.10 | 6.77 | 12.50 | 2.60 | 14.58 | |
| 滨海盐场、养殖场 Coastal saltworks and farm soil | 0.00 | 65.00 | 35.00 | 0.00 | 0.00 | 25.00 | 1.67 | 11.67 | 13.33 | 11.67 | 10.00 | 26.67 | |
| 编号 Code | 影响因子 Impact factor | 影响因子类型 Type of impact factor |
|---|---|---|
| X1 | 年均气温 | 气候类自然因子 Climate factor |
| X2 | 年均降水量 | |
| X3 | 年均风速 | |
| X4 | 年均相对湿度 | |
| X5 | 年均日照时数 | |
| X6 | 高程 | 非气候类自然因子 Non-climate factor |
| X7 | 坡度 | |
| X8 | 坡向 | |
| X9 | 土壤类型 |
Table 7 Independent variable coding
| 编号 Code | 影响因子 Impact factor | 影响因子类型 Type of impact factor |
|---|---|---|
| X1 | 年均气温 | 气候类自然因子 Climate factor |
| X2 | 年均降水量 | |
| X3 | 年均风速 | |
| X4 | 年均相对湿度 | |
| X5 | 年均日照时数 | |
| X6 | 高程 | 非气候类自然因子 Non-climate factor |
| X7 | 坡度 | |
| X8 | 坡向 | |
| X9 | 土壤类型 |
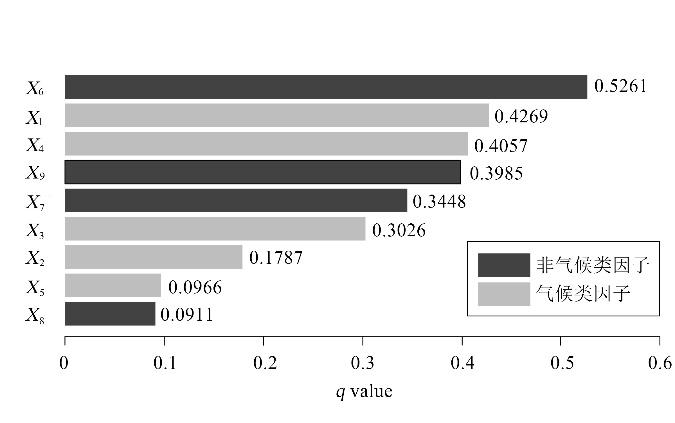
Figure 6 Analysis of driving force of EVI by single natural factor
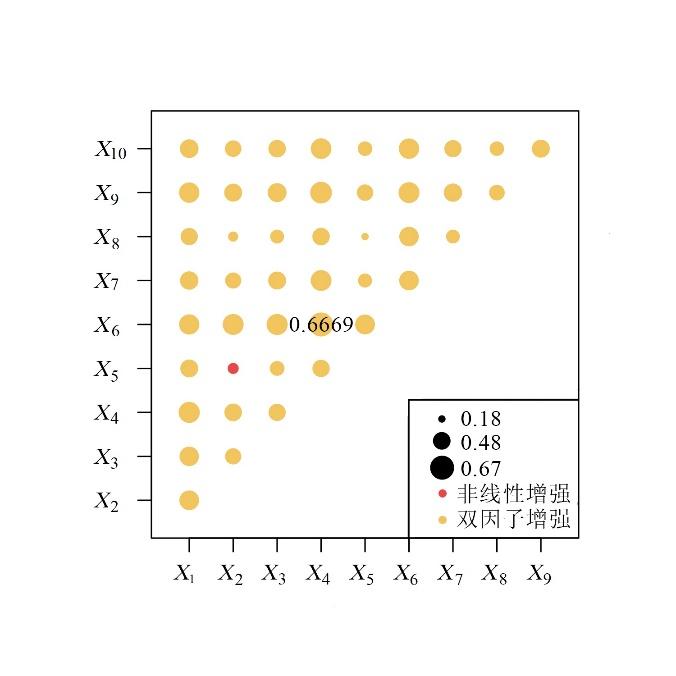
Figure 7 Detection of interaction of two natural factors on EVI driving force
| [1] |
FENSHOLT R, LANGANKE T, RASMUSSEN K, et al., 2012. Greenness in semi-arid areas across the globe 1981-2007-an Earth Observing Satellite based analysis of trends and drivers[J]. Remote Sensing of Environment, 121: 144-58.
DOI URL |
| [2] |
GITELSON A A, KAUFMAN Y J, STARK R, et al., 2002. Novel algorithms for remote estimation of vegetation fraction[J]. Remote Sensing of Environment, 80(1): 76-87.
DOI URL |
| [3] | HU M, XIA B, 2019. A significant increase in the normalized difference vegetation index during the rapid economic development in the Pearl River Delta of China[J]. Land Degradation & Development, 30(4): 359-370. |
| [4] |
MYNENI R B, KEELING C D, TUCKER C J, et al., 1997. Increased plant growth in the northern high latitudes from 1981 to 1991[J]. Nature, 386(6626): 698-702.
DOI URL |
| [5] |
PENG J, LIU Z H, LIU Y H, et al., 2012. Trend analysis of vegetation dynamics in Qinghai-Tibet Plateau using Hurst Exponent[J]. Ecological Indicators, 14(1): 28-39.
DOI URL |
| [6] |
PIAO S L, WANG X H, CIAIS P, et al., 2011. Changes in satellite-derived vegetation growth trend in temperate and boreal Eurasia from 1982 to 2006[J]. Global Change Biology, 17(10): 3228-3239.
DOI URL |
| [7] |
TUCKER C J, SLAYBACK D A, PINZON J E, et al., 2001. Higher northern latitude normalized difference vegetation index and growing season trends from 1982 to 1999[J]. International Journal of Biometeorology, 45(4): 184-190.
PMID |
| [8] |
XIAO J F, MOODY A, 2005. A comparison of methods for estimating fractional green vegetation cover within a desert-to-upland transition zone in central New Mexico, USA[J]. Remote Sensing of Environment, 98(2-3): 237-250.
DOI URL |
| [9] | 陈超男, 朱连奇, 田莉, 等, 2019. 秦巴山区植被覆盖变化及气候因子驱动分析[J]. 生态学报, 39(9): 3257-3266. |
| CHEN C N, ZHU L Q, TIAN L, et al., 2019. Spatial-temporal changes in vegetation characteristics and climate in the Qinling-Daba Mountains[J]. Acta Ecologica Sinica, 39(9): 3257-3266. | |
| [10] | 陈丹, 钱峻屏, 张虹鸥, 等, 2006. 基于遥感数据的广东植被指数时空变化研究[J]. 生态科学, 25(5): 412-416. |
| CHEN D, QIAN J P, ZHANG H O, et al., 2006. The Spatio-temporal Patterns of NDVI in Guangdong Based RS Data[J]. Ecologic Science, 25(5): 412-416. | |
| [11] | 陈云浩, 李晓兵, 史培军, 2001. 1983-1992年中国陆地NDVI变化的气候因子驱动分析[J]. 植物生态学报, 25(6): 716-720. |
| CHEN Y H, LI X B, SHI P J, 2001. Variation in NDVI driven by climate factors across China, 1983-1992 [J]. Acta Phytoecologica Sinica, 25(6): 716-720. | |
| [12] | 程红芳, 章文波, 陈锋, 2008. 植被覆盖度遥感估算方法研究进展[J]. 国土资源遥感, 75(1): 13-18. |
| CHENG H F, ZHANG W B, CHEN F, 2008. Advance in researches on application of remote sensing method to estimating vegetation coverage[J]. Remote sensing for Land & Resources, 75(1): 13-18. | |
| [13] | 邓玉娇, 王捷纯, 徐杰, 等, 2021. 广东省NDVI时空变化特征及其对气候因子的响应[J]. 生态环境学报, 30(1): 37-43. |
| DENG Y J, WANG J C, XU J, et al., 2021. Spatiotemporal variation of NDVI and its response to climatic factors in Guangdong Province[J]. Ecology and Environmental Sciences, 30(1): 37-43. | |
| [14] |
董晨炜, 曹宇, 谭永忠, 2017. 基于夜间灯光数据的环杭州湾城市扩张及植被变化[J]. 应用生态学报, 28(1): 231-238.
DOI |
| DONG C W, CAO Y, TAN Y Z, 2017. Urban expansion and vegetation changes in Hangzhou Bay area using night-light data[J]. Chinese Journal of Applied Ecology, 28(1): 231-238. | |
| [15] | 冯娴慧, 曾芝琳, 张德顺, 2022. 基于MODIS NDVI数据的粤港澳大湾区植被覆盖时空演变[J]. 中国城市林业, 20(1): 1-6, 28. |
| FENG X H, ZENG Z L, ZHANG D S, 2022. Temporal-spatial evolution of vegetation coverage in the Guangdong-Hong Kong-Macao Greater Bay Area on MODIS NDVI data[J]. Journal of Chinese Urban Forestry, 20(1): 1-6, 28. | |
| [16] | 甘春英, 王兮之, 李保生, 等, 2011. 连江流域近18年来植被覆盖度变化分析[J]. 地理科学, 31(8): 1019-1024. |
|
GAN C Y, WANG X Z, LI B S et al., 2011. Changes of vegetation coverage during recent 18 years in Lianjiang River watershed[J]. Scientia Geographica Sinica, 31(8): 1019-1024.
DOI |
|
| [17] | 高照忠, 魏海霞, 黄铁兰, 2021. 粤港澳大湾区土地覆盖及景观格局时空变化分析[J]. 测绘通报 (5): 25-29. |
| GAO Z Z, WEI H X, HUANG T L, 2021. Analysis of spatial-temporal changes of land cover and landscape pattern in Guangdong-Hong Kong-Macao Greater Bay Area[J]. Bulletin of Surveying and Mapping (5): 25-29. | |
| [18] | 何全军, 2019. 基于MODIS数据的珠三角地区NDVI时空变化特征及对气象因素的响应[J]. 生态环境学报, 28(9): 1722-1730. |
| HE Q J, 2019. Spatio-temporal variation of NDVI and its response to meteorological factors in Pearl River Delta based on MODIS data[J]. Ecology and Environmental Sciences, 28(9): 1722-1730. | |
| [19] | 贺忠华, 张育慧, 何月, 等, 2020. 浙江省近20年植被变化趋势及驱动因子分析[J]. 生态环境学报, 29(8): 1530-1539. |
| HE Z H, ZHANG Y H, HE Y, et al., 2020. Trends of vegetation change and driving factor analysis in recent 20 years over Zhejiang province[J]. Ecology and Environmental Sciences, 29(8): 1530-1539. | |
| [20] |
贾坤, 姚云军, 魏香琴, 等, 2013. 植被覆盖度遥感估算研究进展[J]. 地球科学进展, 28(7): 774-782.
DOI |
|
JIA K, YAO Y J, WEI X Q, et al., 2013. A review on fractional vegetation cover estimation using remote sensing[J]. Advances in Earth Science, 28(7): 774-782.
DOI |
|
| [21] | 李卓, 孙然好, 张继超, 等, 2017. 京津冀城市群地区植被覆盖动态变化时空分析[J]. 生态学报, 37(22): 7418-7426. |
| LI Z, SUN R H, ZHANG J C et al., 2017. Temporal-spatial analysis of vegetation coverage dynamics in Beijing-Tianjin-Hebei metropolitan regions[J]. Acta Ecologica Sinica, 37(22): 7418-7426. | |
| [22] | 刘宪锋, 杨勇, 任志远, 等, 2013. 2000-2009年黄土高原地区植被覆盖度时空变化[J]. 中国沙漠, 33(4): 1244-1249. |
| LIU X F, YANG Y, REN ZH Y, et al., 2013. Changes of vegetation coverage in the Loess Plateau in 2000-2009[J]. Journal of Desert Research, 33(4): 1244-1249. | |
| [23] |
刘彦随, 李进涛, 2017. 中国县域农村贫困化分异机制的地理探测与优化决策[J]. 地理学报, 72(1): 161-173.
DOI |
|
LIU Y S, LI J T, 2017. Geographic detection and optimizing decision of the differentiation mechanism of rural poverty in China[J]. Acta Geographica Sinica, 72(1): 161-173.
DOI |
|
| [24] | 穆少杰, 李建龙, 陈奕兆, 等, 2012. 2001-2010年内蒙古植被覆盖度时空变化特征[J]. 地理学报, 67(9): 1255-1268. |
|
MU S J, LI J L, CHEN Y Z, et al., 2012. Spatial differences of variations of vegetation coverage in Inner Mongolia during 2001-2010[J]. Acta Geographica Sinica, 67(9): 1255-1268.
DOI |
|
| [25] |
王劲峰, 徐成东, 2017. 地理探测器: 原理与展望[J]. 地理学报, 72(1): 116-134.
DOI |
|
WANG J F, XU C D, 2017. Geodetector: Principle and prospective[J]. Acta Geographica Sinica, 72(1): 116-134.
DOI |
|
| [26] | 王思, 张路路, 林伟彪, 等, 2022. 基于MODIS-NDVI的广东省植被覆盖与土地利用变化研究[J]. 生态学报, 42(6): 1-15. |
| WANG S, ZHANG L L, LIN W B, et al., 2022. Study on vegetation coverage and land-use change of Guangdong Province based on MODIS-NDVI[J]. Acta Ecologica Sinica, 42(6): 1-15. | |
| [27] | 解晗, 同小娟, 李俊, 等, 2022. 2000-2008年黄河流域生长季NDVI、EVI变化及其对气候因子的响应[J]. 生态学报, 42(11): 1-16. |
| XIE H, TONG X J, LI J, et al., 2022. Changes of NDVI and EVI and their responses to climatic variables in the Yellow River Basin during the growing season of 2000-2018[J]. Acta Ecologica Sinica, 42(11): 1-16. | |
| [28] | 徐勇, 黄雯婷, 靖娟利, 等, 2020. 京津冀地区植被NDVI动态变化及其与气候因子的关系[J]. 水土保持通报, 40(5): 319-327. |
| XU Y, HUANG W T, JIANG J L, et al., 2020. Dynamic variation of vegetation cover and its relation with climate variables in Beijing-Tianjin-Heibei region[J]. Bulletin of soil and water conversation, 40(5): 319-327. | |
| [29] | 晏利斌, 刘晓东, 2011. 1982-2006年京津冀地区植被时空变化及其与降水和地面气温的联系[J]. 生态环境学报, 20(2): 226-32. |
| YAN L B, LIU X D, 2011. Spatial-temporal changes in vegetation cover and their relationships with precipitation and surface air temperature over the Beijing-Tianjin-Hebei region from 1982 to 2006[J]. Ecology and Environmental Sciences, 20(2): 226-232. | |
| [30] | 张顾萍, 陈国民, 邵怀勇, 等, 2021. 近16年金沙江流域植被覆盖时空特征及其对气候的响应[J]. 长江流域资源与环境, 30(7): 1638-1648. |
| ZHANG G P, CHEN G M, SHAO H Y, et al., 2021. Spatial-temporal characteristics of vegetation coverage and its response to climate from 2000 to 2015 in Jinsha River Basin, China[J]. Resources and Environment in the Yangtze Basin, 30(7): 1638-1648. | |
| [31] | 张杰, 李清泉, 吴祥茵, 等, 2021. 基于土地利用的粤港澳大湾区生态系统服务价值及承载力演变分析[J]. 生态学报, 41(21): 8375-8386. |
| ZHANG J, LI Q Q, WU X Y, et al., 2021. Evolution of the ecosystem services value and carrying capacity in the Guangdong-Hong Kong-Macao Greater Bay Area based on land use changes[J]. Acta Ecologica Sinica, 41(21): 8375-8386. | |
| [32] | 赵桔超, 张韶华, 尹晓雪, 等, 2022. 粤港澳大湾区植被覆盖变化及其影响因素分析[J]. 测绘科学, 47(3): 75-84. |
| ZHANG J C, ZHANG S H, YIN X X, et al., 2022. Changes in vegetation coverage and its influencing factors across the Guangdong-Hong Kong-Macao Greater Bay Area[J]. Science of Surveying and Mapping, 47(3): 75-84. | |
| [33] | 张凯选, 范鹏鹏, 王军邦, 等, 2019. 西南喀斯特地区植被变化及其与气候因子关系研究[J]. 生态环境学报, 28(6): 1080-1091. |
| ZHANG K X, FAN P P, WANG J B, et al., 2019. Study on vegetation changes and climate factors in a karst region of southwest China[J]. Ecology and Environmental Sciences, 28(6): 1080-1091. |
| [1] | XIAO Bo, WANG Shaojun, XIE Lingling, WANG Zhengjun, GUO Zhipeng, ZHANG Kunfeng, ZHANG Lulu, FAN Yuxiang, GUO Xiaofei, LUO Shuang, XIA Jiahui, LI Rui, LAN Mengjie, YANG Shengqiu. Effect of Ant Nesting Activity on Soil Nitrogen Component Allocation in the Xishuangbanna Tropical Forests [J]. Ecology and Environment, 2023, 32(6): 1026-1036. |
| [2] | HAO Lei, ZHAI Yongguang, QI Wenchao, LAN Qiongqiong. Spatial-temporal Dynamics of Vegetation Carbon Sources/sinks in Inner Mongolia from 2001 to 2020 and Its Response to Climate Change [J]. Ecology and Environment, 2023, 32(5): 825-834. |
| [3] | HOU Hui, YAN Peixuan, XIE Qinmi, ZHAO Hongliang, PANG Danbo, CHEN Lin, LI Xuebin, HU Yang, LIANG Yongliang, NI Xilu. Characterization of Arbuscular Mycorrhizal Fungal Community Diversity in the Rhizosphere Soils of Prunus mongolica Scrub of Helan Mountain [J]. Ecology and Environment, 2023, 32(5): 857-865. |
| [4] | ZHAO Hongbin, BAI Xue, FAN Yufeng, ZHANG Xiaofu, ZHANG Tao, LI Shufen. Cloning and Differential Expression Analysis of Stipa Breviflora StbCRY1 and StbCRY2 Genes [J]. Ecology and Environment, 2023, 32(5): 866-877. |
| [5] | CHEN Junfang, WU Xian, LIU Xiaolin, LIU Juan, YANG Jiarong, LIU Yu. Shaping Characteristics of Elemental Stoichiometry on Microbial Diversity under Different Soil Water Contents [J]. Ecology and Environment, 2023, 32(5): 898-909. |
| [6] | LI Hui, LI Bilong, GE Lili, HAN Chenhui, YANG Qian, ZHANG Yuejun. Temporal and Spatial Characteristics of Vegetation Evolution and Topographic Effects in Fenhe River Basin from 2000 to 2021 [J]. Ecology and Environment, 2023, 32(3): 439-449. |
| [7] | QI Yue, ZHANG Qiang, HU Shujuan, CAI Dihua, ZHAO Funian, ZHANG Kai, WANG Heling, WANG Runyuan. Climate Change and Its Impact on Winter Wheat Potential Productivity of Loess Plateau in China [J]. Ecology and Environment, 2022, 31(8): 1521-1529. |
| [8] | DENG Tianle, XIE Liyong, ZHANG Fengzhe, ZHAO Hongliang, JIANG Yutong. Competition for Growth Space between Barnyard Grass and Rice under Elevated Atmospheric CO2 Concentration [J]. Ecology and Environment, 2022, 31(8): 1566-1572. |
| [9] | LU Yanyu, SUN Wei, FANG Yanqiu, TANG Weian, DENG Hanqing, HE Dongyan. Estimating the Climatic Potential Productivity and the Climatic Capacity of Food Security Based on the Cropping Structure in Anhui Province [J]. Ecology and Environment, 2022, 31(7): 1293-1305. |
| [10] | LI Dengke, WANG Zhao. Quantitative Analysis of the Impact of Climate Change and Human Activities on Vegetation NPP in Shaanxi Province [J]. Ecology and Environment, 2022, 31(6): 1071-1079. |
| [11] | CAO Xiaoyun, ZHU Cunxiong, CHEN Guoqian, SUN Shujiao, ZHAO Huifang, ZHU Wenbin, ZHOU Bingrong. Surface Greenness Change and Topographic Differentiation over Qaidam Basin from 2000 to 2021 [J]. Ecology and Environment, 2022, 31(6): 1080-1090. |
| [12] | GAO Siqi, DONG Guotao, JIANG Xiaohui, NIE Tong, GUO Xinwei, DANG Suzhen, LI Xinyu, LI Haoyang. Analysis of Vegetation Coverage Changes and Natural Driving Forces of Spatial Distribution in the Source Region of the Yellow River [J]. Ecology and Environment, 2022, 31(3): 429-439. |
| [13] | YE Youhua, XIAO Bing, FENG Hongjuan, HE Yulin, CHEN Ping, CHEN Xiaoyi, WANG Dandan, ZENG Zhixiang, GUO Xin. Researches on the Pattern and Route of Ecological Product Value Realization from the Perspective of Rural Revitalization [J]. Ecology and Environment, 2022, 31(2): 421-428. |
| [14] | CAO Yun, SUN Yinglong, JIANG Yueqing, WAN Jun. Analysis on Temporal-spatial Variations and Driving Factors of Net Ecosystem Productivity in the Yellow River Basin [J]. Ecology and Environment, 2022, 31(11): 2101-2110. |
| [15] | SHI Zhiyu, WANG Yating, ZHAO Qing, ZHANG Lianpeng, ZHU Changming. The Spatiotemporal Changes of NPP and Its Driving Mechanisms in China from 2001 to 2020 [J]. Ecology and Environment, 2022, 31(11): 2111-2123. |
| Viewed | ||||||
|
Full text |
|
|||||
|
Abstract |
|
|||||
Copyright © 2021 Editorial Office of ACTA PETROLEI SINICA
Address:No. 6 Liupukang Street, Xicheng District, Beijing, P.R.China, 510650
Tel: 86-010-62067128, 86-010-62067137, 86-010-62067139
Fax: 86-10-62067130
Email: syxb@cnpc.com.cn
Support byBeijing Magtech Co.ltd, E-mail:support@magtech.com.cn