Ecology and Environmental Sciences ›› 2025, Vol. 34 ›› Issue (8): 1293-1304.DOI: 10.16258/j.cnki.1674-5906.2025.08.014
• Research Article [Environmental Science] • Previous Articles Next Articles
FENG Shanshan1( ), TAO Liang2, LIANG Junfen1,*()
Received:2025-02-18
Online:2025-08-18
Published:2025-08-01
冯珊珊1(), 陶亮2, 梁俊芬1,*()
通讯作者:
*E-mail: 作者简介:冯珊珊(1994年生),女,助理研究员,博士,主要从事农业地理与遥感应用研究。E-mail: fengshanshan@gdaas.cn
基金资助:CLC Number:
FENG Shanshan, TAO Liang, LIANG Junfen. Spatiotemporal Evolution and Driving Mechanisms of County-Level Agricultural Industry Agglomeration under High-Quality Development: A Case Study of Vegetable Production in Guangdong Province[J]. Ecology and Environmental Sciences, 2025, 34(8): 1293-1304.
冯珊珊, 陶亮, 梁俊芬. 高质量发展视角下县域农业产业集聚的时空演化与驱动机制——以广东省蔬菜生产为例[J]. 生态环境学报, 2025, 34(8): 1293-1304.
Add to citation manager EndNote|Ris|BibTeX
URL: https://www.jeesci.com/EN/10.16258/j.cnki.1674-5906.2025.08.014
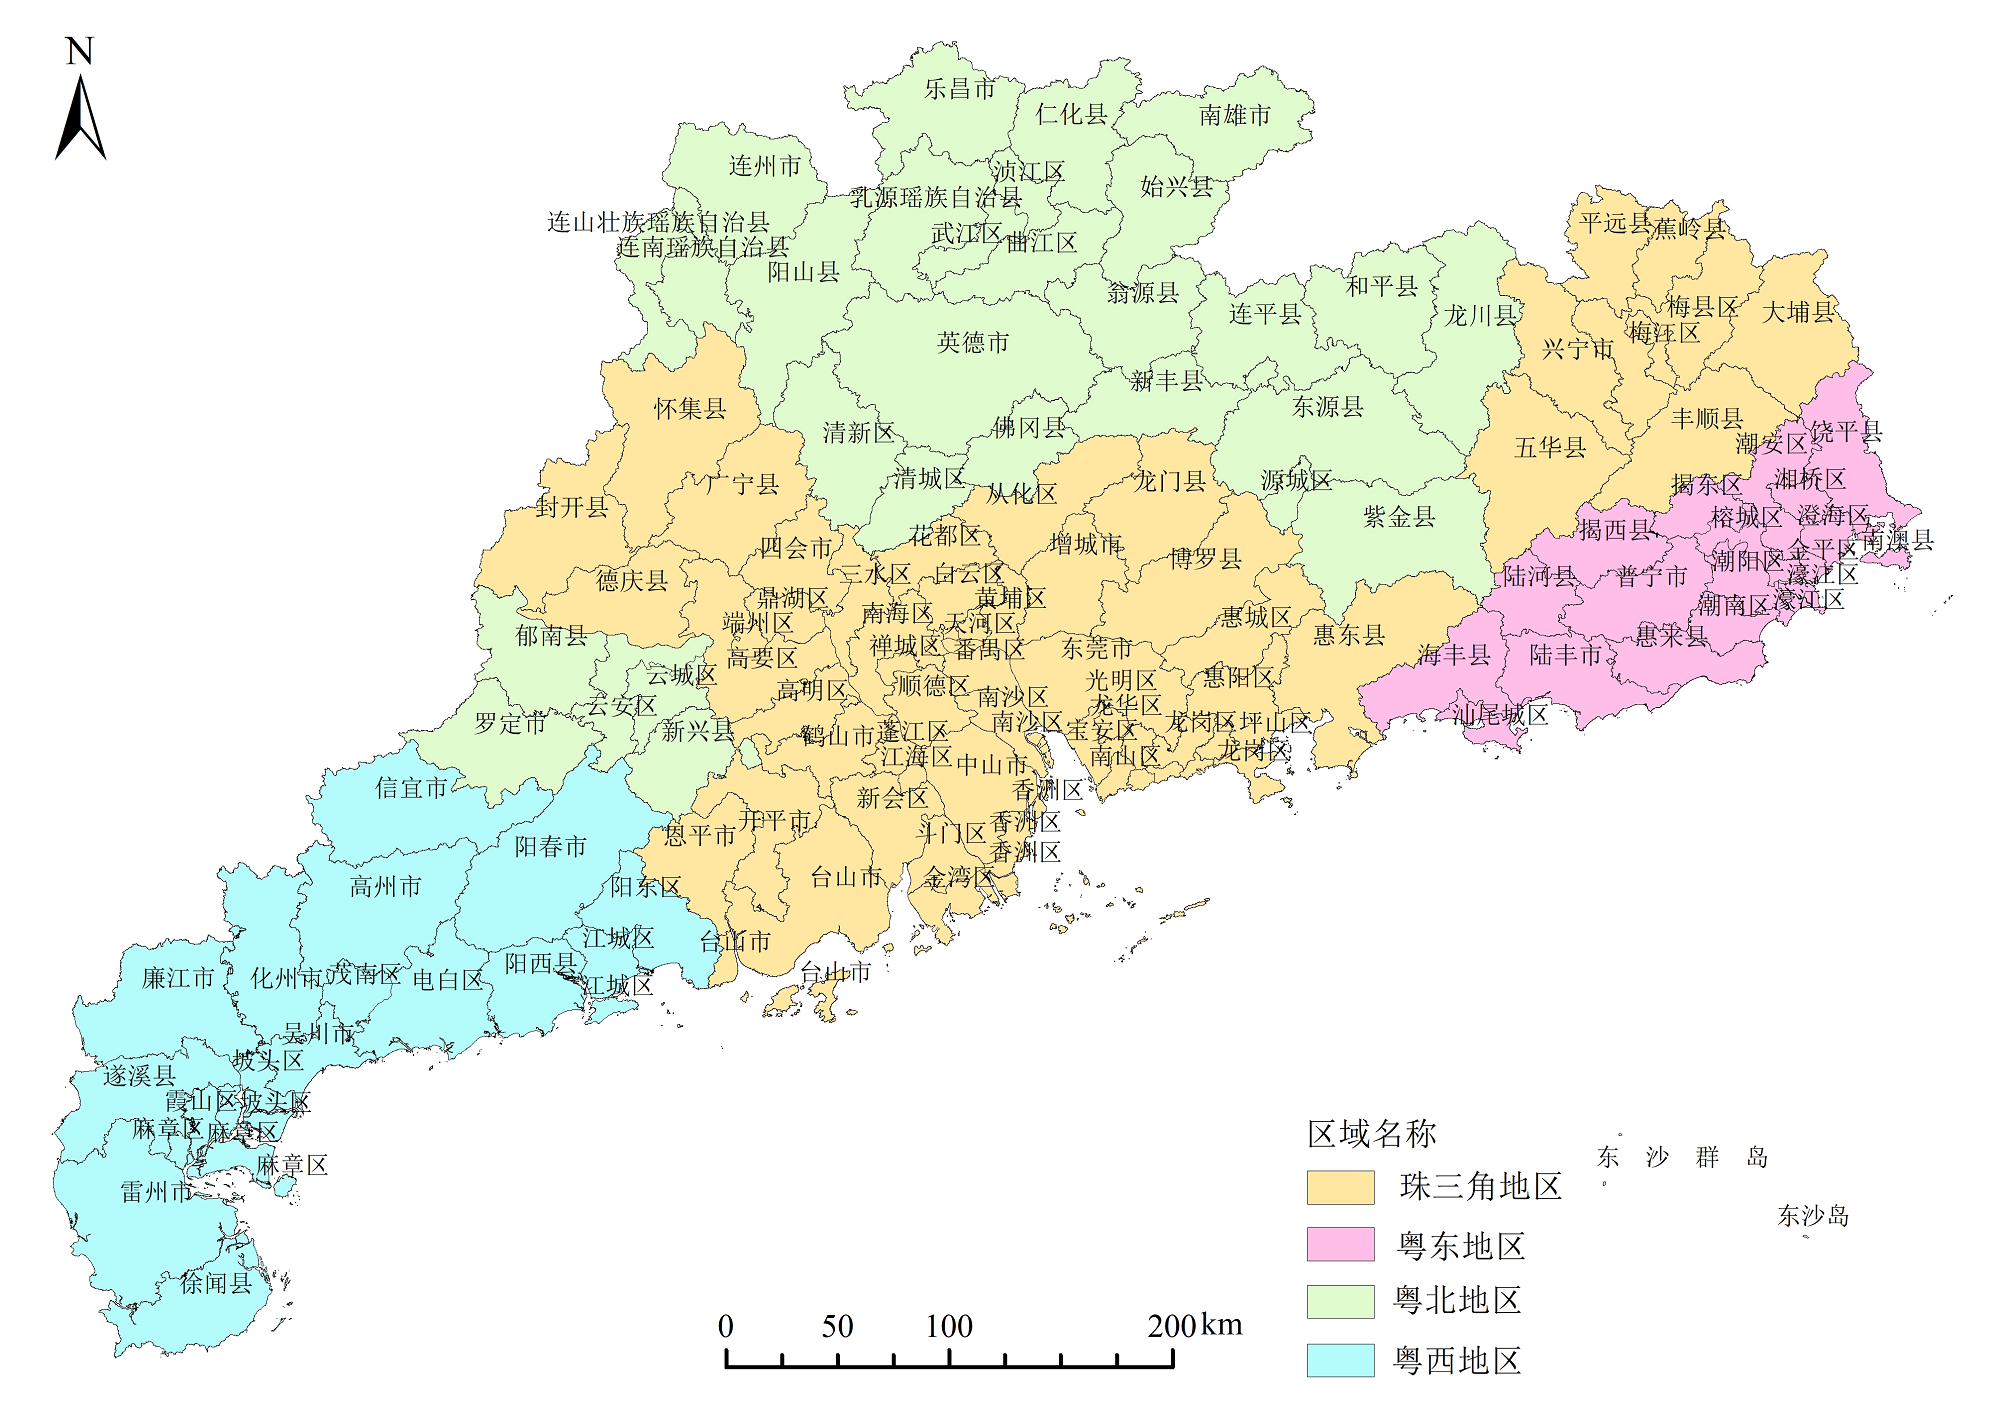
Figure 1 Administrative map of Guangdong Province
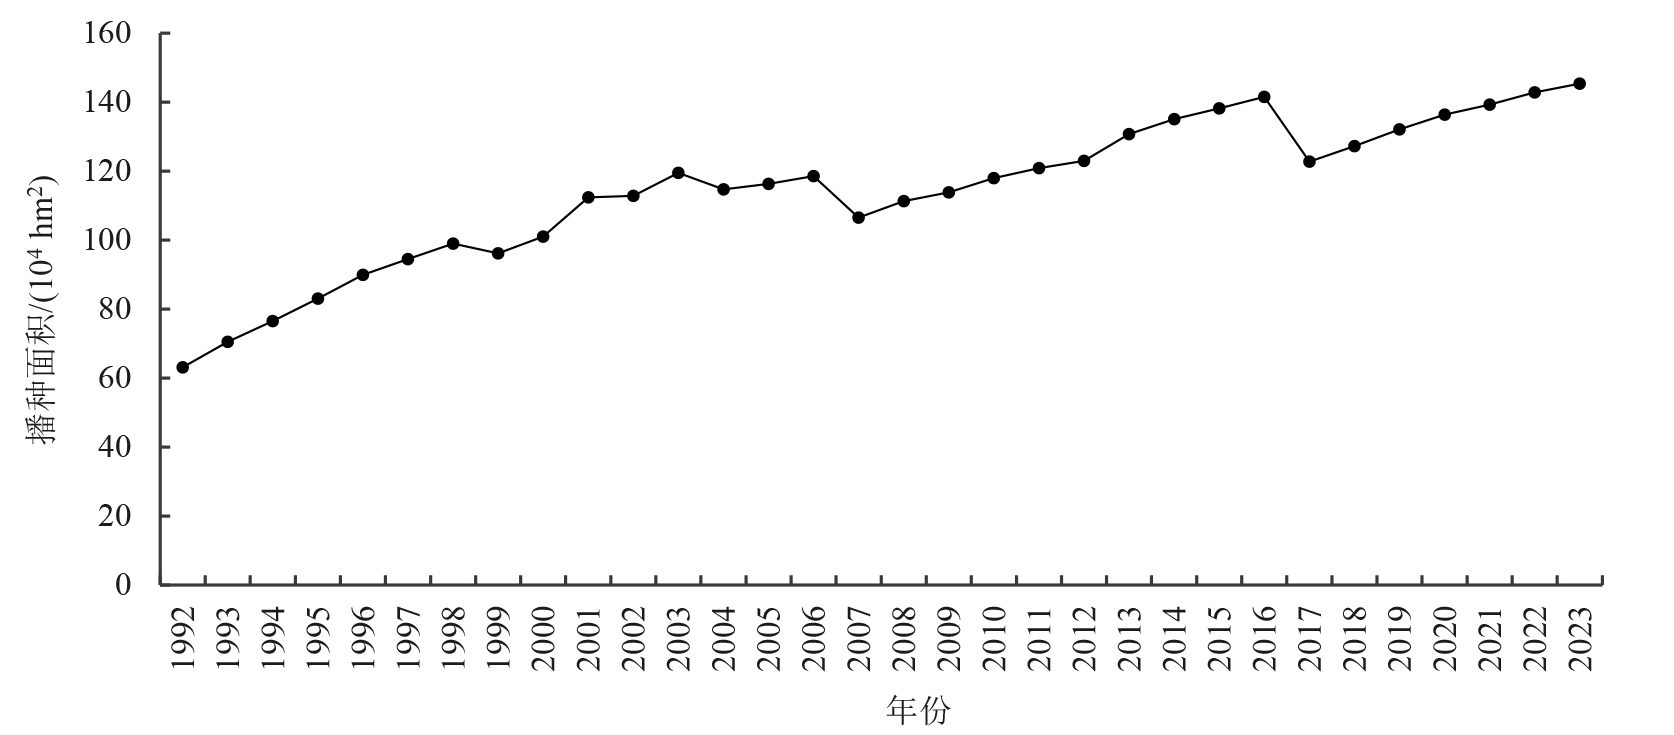
Figure 2 Changes in vegetable production in Guangdong Province from 1992 to 2023
| 播种面积/ (104 hm2) | 1992年 | 1998年 | 2006年 | 2016年 | 2023年 | |||||||||
|---|---|---|---|---|---|---|---|---|---|---|---|---|---|---|
| 个数 | 比例/% | 个数 | 比例/% | 个数 | 比例/% | 个数 | 比例/% | 个数 | 比例/% | |||||
| ≥2.0 | 2 | 1.61 | 10 | 8.06 | 19 | 15.32 | 21 | 16.94 | 24 | 19.35 | ||||
| 1.5-2.0 | 4 | 3.23 | 7 | 5.65 | 16 | 12.90 | 15 | 12.10 | 8 | 6.45 | ||||
| 1.0-1.5 | 9 | 7.26 | 25 | 20.16 | 15 | 12.10 | 14 | 11.29 | 21 | 16.94 | ||||
| 0.5-1.0 | 39 | 31.45 | 28 | 22.58 | 32 | 25.81 | 33 | 26.61 | 30 | 24.19 | ||||
| 0.3-0.5 | 14 | 11.29 | 16 | 12.90 | 13 | 10.48 | 13 | 10.48 | 12 | 9.68 | ||||
| <0.3 | 56 | 45.16 | 38 | 30.65 | 29 | 23.39 | 28 | 22.58 | 29 | 23.39 | ||||
Table 1 Statistics of vegetable sowing area in counties of Guangdong Province in 1992, 1998, 2006, 2016, and 2023
| 播种面积/ (104 hm2) | 1992年 | 1998年 | 2006年 | 2016年 | 2023年 | |||||||||
|---|---|---|---|---|---|---|---|---|---|---|---|---|---|---|
| 个数 | 比例/% | 个数 | 比例/% | 个数 | 比例/% | 个数 | 比例/% | 个数 | 比例/% | |||||
| ≥2.0 | 2 | 1.61 | 10 | 8.06 | 19 | 15.32 | 21 | 16.94 | 24 | 19.35 | ||||
| 1.5-2.0 | 4 | 3.23 | 7 | 5.65 | 16 | 12.90 | 15 | 12.10 | 8 | 6.45 | ||||
| 1.0-1.5 | 9 | 7.26 | 25 | 20.16 | 15 | 12.10 | 14 | 11.29 | 21 | 16.94 | ||||
| 0.5-1.0 | 39 | 31.45 | 28 | 22.58 | 32 | 25.81 | 33 | 26.61 | 30 | 24.19 | ||||
| 0.3-0.5 | 14 | 11.29 | 16 | 12.90 | 13 | 10.48 | 13 | 10.48 | 12 | 9.68 | ||||
| <0.3 | 56 | 45.16 | 38 | 30.65 | 29 | 23.39 | 28 | 22.58 | 29 | 23.39 | ||||

Figure 3 Spatial-temporal Changes of vegetable sowing area in Guangdong Province in 1992?2023
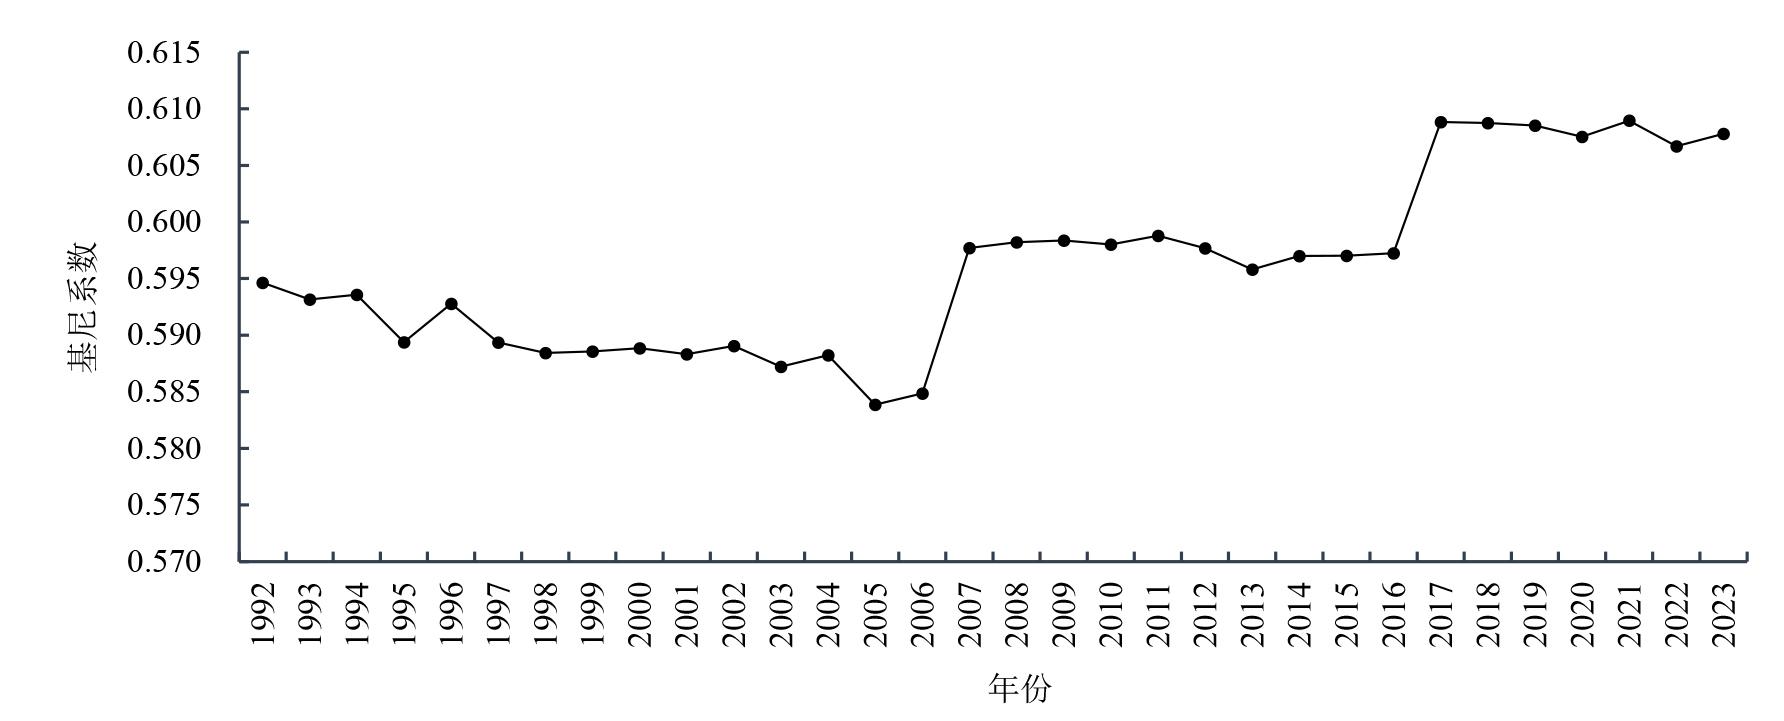
Figure 4 Trend of Gini coefficient changes in vegetable production in Guangdong Province from 1992 to 2023
| 年份 | 莫兰指数 | 期望值 | 方差 | Z得分 | p值 | 显著性水平 |
|---|---|---|---|---|---|---|
| 1992 | 0.0658 | −0.0081 | 0.0035 | 1.2400 | 0.2151 | - |
| 1993 | 0.0371 | −0.0081 | 0.0036 | 0.7501 | 0.4532 | - |
| 1994 | 0.0421 | −0.0081 | 0.0036 | 0.8376 | 0.4022 | - |
| 1995 | 0.0358 | −0.0081 | 0.0036 | 0.7293 | 0.4658 | - |
| 1996 | 0.0405 | −0.0081 | 0.0036 | 0.8052 | 0.4207 | - |
| 1997 | 0.0368 | −0.0081 | 0.0036 | 0.7444 | 0.4566 | - |
| 1998 | 0.0367 | −0.0081 | 0.0037 | 0.7401 | 0.4593 | - |
| 1999 | 0.0235 | −0.0081 | 0.0037 | 0.5216 | 0.6020 | - |
| 2000 | 0.0320 | −0.0081 | 0.0037 | 0.6633 | 0.5071 | - |
| 2001 | 0.0123 | −0.0081 | 0.0036 | 0.3374 | 0.7358 | - |
| 2002 | 0.0121 | −0.0081 | 0.0036 | 0.3333 | 0.7389 | - |
| 2003 | 0.0673 | −0.0081 | 0.0036 | 1.2499 | 0.2114 | - |
| 2004 | 0.0799 | −0.0081 | 0.0036 | 1.4592 | 0.1445 | - |
| 2005 | 0.1057 | −0.0081 | 0.0036 | 1.8833 | 0.0597 | 10% |
| 2006 | 0.1129 | −0.0081 | 0.0036 | 2.0044 | 0.0450 | 5% |
| 2007 | 0.1101 | −0.0081 | 0.0036 | 1.9562 | 0.0504 | 10% |
| 2008 | 0.1110 | −0.0081 | 0.0037 | 1.9707 | 0.0488 | 5% |
| 2009 | 0.1156 | −0.0081 | 0.0037 | 2.0468 | 0.0407 | 5% |
| 2010 | 0.1293 | −0.0081 | 0.0037 | 2.2713 | 0.0231 | 5% |
| 2011 | 0.1328 | −0.0081 | 0.0037 | 2.3283 | 0.0199 | 5% |
| 2012 | 0.1408 | −0.0081 | 0.0037 | 2.4605 | 0.0139 | 5% |
| 2013 | 0.1672 | −0.0081 | 0.0037 | 2.8968 | 0.0038 | 1% |
| 2014 | 0.1843 | −0.0081 | 0.0037 | 3.1819 | 0.0015 | 1% |
| 2015 | 0.1977 | −0.0081 | 0.0037 | 3.4044 | 0.0007 | 1% |
| 2016 | 0.2005 | −0.0081 | 0.0037 | 3.4504 | 0.0006 | 1% |
| 2017 | 0.2418 | −0.0081 | 0.0037 | 4.1363 | 0.0000 | 1% |
| 2018 | 0.2454 | −0.0081 | 0.0037 | 4.1935 | 0.0000 | 1% |
| 2019 | 0.2507 | −0.0081 | 0.0037 | 4.2804 | 0.0000 | 1% |
| 2020 | 0.2533 | −0.0081 | 0.0037 | 4.3213 | 0.0000 | 1% |
| 2021 | 0.2589 | −0.0081 | 0.0037 | 4.4144 | 0.0000 | 1% |
| 2022 | 0.2667 | −0.0081 | 0.0037 | 4.5399 | 0.0000 | 1% |
| 2023 | 0.2679 | −0.0081 | 0.0037 | 4.5401 | 0.0000 | 1% |
Table 2 Moran’s I of vegetable production in Guangdong Province from 1992 to 2023
| 年份 | 莫兰指数 | 期望值 | 方差 | Z得分 | p值 | 显著性水平 |
|---|---|---|---|---|---|---|
| 1992 | 0.0658 | −0.0081 | 0.0035 | 1.2400 | 0.2151 | - |
| 1993 | 0.0371 | −0.0081 | 0.0036 | 0.7501 | 0.4532 | - |
| 1994 | 0.0421 | −0.0081 | 0.0036 | 0.8376 | 0.4022 | - |
| 1995 | 0.0358 | −0.0081 | 0.0036 | 0.7293 | 0.4658 | - |
| 1996 | 0.0405 | −0.0081 | 0.0036 | 0.8052 | 0.4207 | - |
| 1997 | 0.0368 | −0.0081 | 0.0036 | 0.7444 | 0.4566 | - |
| 1998 | 0.0367 | −0.0081 | 0.0037 | 0.7401 | 0.4593 | - |
| 1999 | 0.0235 | −0.0081 | 0.0037 | 0.5216 | 0.6020 | - |
| 2000 | 0.0320 | −0.0081 | 0.0037 | 0.6633 | 0.5071 | - |
| 2001 | 0.0123 | −0.0081 | 0.0036 | 0.3374 | 0.7358 | - |
| 2002 | 0.0121 | −0.0081 | 0.0036 | 0.3333 | 0.7389 | - |
| 2003 | 0.0673 | −0.0081 | 0.0036 | 1.2499 | 0.2114 | - |
| 2004 | 0.0799 | −0.0081 | 0.0036 | 1.4592 | 0.1445 | - |
| 2005 | 0.1057 | −0.0081 | 0.0036 | 1.8833 | 0.0597 | 10% |
| 2006 | 0.1129 | −0.0081 | 0.0036 | 2.0044 | 0.0450 | 5% |
| 2007 | 0.1101 | −0.0081 | 0.0036 | 1.9562 | 0.0504 | 10% |
| 2008 | 0.1110 | −0.0081 | 0.0037 | 1.9707 | 0.0488 | 5% |
| 2009 | 0.1156 | −0.0081 | 0.0037 | 2.0468 | 0.0407 | 5% |
| 2010 | 0.1293 | −0.0081 | 0.0037 | 2.2713 | 0.0231 | 5% |
| 2011 | 0.1328 | −0.0081 | 0.0037 | 2.3283 | 0.0199 | 5% |
| 2012 | 0.1408 | −0.0081 | 0.0037 | 2.4605 | 0.0139 | 5% |
| 2013 | 0.1672 | −0.0081 | 0.0037 | 2.8968 | 0.0038 | 1% |
| 2014 | 0.1843 | −0.0081 | 0.0037 | 3.1819 | 0.0015 | 1% |
| 2015 | 0.1977 | −0.0081 | 0.0037 | 3.4044 | 0.0007 | 1% |
| 2016 | 0.2005 | −0.0081 | 0.0037 | 3.4504 | 0.0006 | 1% |
| 2017 | 0.2418 | −0.0081 | 0.0037 | 4.1363 | 0.0000 | 1% |
| 2018 | 0.2454 | −0.0081 | 0.0037 | 4.1935 | 0.0000 | 1% |
| 2019 | 0.2507 | −0.0081 | 0.0037 | 4.2804 | 0.0000 | 1% |
| 2020 | 0.2533 | −0.0081 | 0.0037 | 4.3213 | 0.0000 | 1% |
| 2021 | 0.2589 | −0.0081 | 0.0037 | 4.4144 | 0.0000 | 1% |
| 2022 | 0.2667 | −0.0081 | 0.0037 | 4.5399 | 0.0000 | 1% |
| 2023 | 0.2679 | −0.0081 | 0.0037 | 4.5401 | 0.0000 | 1% |

Figure 5 Spatial Changes in geographical agglomeration of vegetable production in Guangdong Province from 2005 to 2023
| 序号 | 地区 | 产业园蔬菜 类型 | 序号 | 地区 | 产业园蔬菜类型 |
|---|---|---|---|---|---|
| 1 | 广州市增城区 | 迟菜心 | 16 | 汕尾市海丰县 | 蔬菜 |
| 2 | 广州市增城区 | 菜稻轮作 | 17 | 韶关市乳源县 | 蔬菜 |
| 3 | 广州市白云区 | 设施蔬菜 | 18 | 韶关市武江区 | 蔬菜 |
| 4 | 惠州市博罗县 | 蔬菜 | 19 | 韶关市新丰县 | 蔬菜 |
| 5 | 惠州市惠东县 | 蔬菜 | 20 | 韶关市乐昌市 | 香芋 |
| 6 | 惠州市惠阳区 | 蔬菜 | 21 | 韶关市始兴县 | 蔬菜 |
| 7 | 肇庆市怀集县 | 蔬菜 | 22 | 韶关市曲江区 | 食用菌 |
| 8 | 湛江市坡头区 | 莲藕 | 23 | 韶关市武江区 | 食用菌 |
| 9 | 湛江市徐闻县 | 玉米 | 24 | 梅州市梅江区 | 蔬菜 |
| 10 | 清远市连州市 | 菜心 | 25 | 梅州市丰顺县 | 特色蔬菜 |
| 11 | 清远市阳山县 | 蔬菜 | 26 | 梅州市五华县 | 蔬菜 |
| 12 | 清远市英德市 | 连樟村果菜茶 | 27 | 汕头市澄海区 | 蔬菜 |
| 13 | 清远市英德市 | 西牛麻竹笋 | 28 | 揭阳市揭东区 | 竹笋 |
| 14 | 河源市源城区 | 蔬菜 | 29 | 揭阳市揭西县 | 苦笋 |
| 15 | 汕尾市陆丰市 | 萝卜 | 30 | 揭阳市普宁市 | 稻蔬 |
Table 3 Provincial-level modern agricultural industrial park for vegetables created from 2018 to 2023
| 序号 | 地区 | 产业园蔬菜 类型 | 序号 | 地区 | 产业园蔬菜类型 |
|---|---|---|---|---|---|
| 1 | 广州市增城区 | 迟菜心 | 16 | 汕尾市海丰县 | 蔬菜 |
| 2 | 广州市增城区 | 菜稻轮作 | 17 | 韶关市乳源县 | 蔬菜 |
| 3 | 广州市白云区 | 设施蔬菜 | 18 | 韶关市武江区 | 蔬菜 |
| 4 | 惠州市博罗县 | 蔬菜 | 19 | 韶关市新丰县 | 蔬菜 |
| 5 | 惠州市惠东县 | 蔬菜 | 20 | 韶关市乐昌市 | 香芋 |
| 6 | 惠州市惠阳区 | 蔬菜 | 21 | 韶关市始兴县 | 蔬菜 |
| 7 | 肇庆市怀集县 | 蔬菜 | 22 | 韶关市曲江区 | 食用菌 |
| 8 | 湛江市坡头区 | 莲藕 | 23 | 韶关市武江区 | 食用菌 |
| 9 | 湛江市徐闻县 | 玉米 | 24 | 梅州市梅江区 | 蔬菜 |
| 10 | 清远市连州市 | 菜心 | 25 | 梅州市丰顺县 | 特色蔬菜 |
| 11 | 清远市阳山县 | 蔬菜 | 26 | 梅州市五华县 | 蔬菜 |
| 12 | 清远市英德市 | 连樟村果菜茶 | 27 | 汕头市澄海区 | 蔬菜 |
| 13 | 清远市英德市 | 西牛麻竹笋 | 28 | 揭阳市揭东区 | 竹笋 |
| 14 | 河源市源城区 | 蔬菜 | 29 | 揭阳市揭西县 | 苦笋 |
| 15 | 汕尾市陆丰市 | 萝卜 | 30 | 揭阳市普宁市 | 稻蔬 |
| 序号 | 产品名称 | 地区 | 序号 | 产品名称 | 地区 |
|---|---|---|---|---|---|
| 1 | 增城迟菜心 | 广州市增城区 | 17 | 西牛麻竹笋 | 清远市英德市 |
| 2 | 派潭凉粉草 | 广州市增城区 | 18 | 阳山淮山 | 清远市阳山县 |
| 3 | 庙南粉葛 | 广州市南沙区 | 19 | 阳山西洋菜 | 清远市阳山县 |
| 4 | 新垦莲藕 | 广州市南沙区 | 20 | 连州菜心 | 清远市连州市 |
| 5 | 炭步槟榔香芋 | 广州市花都区 | 21 | 星子红葱 | 清远市连州市 |
| 6 | 合水粉葛 | 佛山市高明区 | 22 | 连山大肉姜 | 清远市连山县 |
| 7 | 三水黑皮冬瓜 | 佛山市三水区 | 23 | 竹山粉葛 | 清远市佛冈县 |
| 8 | 矮陂梅菜 | 惠州市惠城区 | 24 | 北乡马蹄 | 韶关市乐昌市 |
| 9 | 福田菜心 | 惠州市博罗县 | 25 | 张溪香芋 | 韶关市乐昌市 |
| 10 | 杜阮凉瓜 | 江门市蓬江区 | 26 | 火山粉葛 | 韶关市曲江区 |
| 11 | 鹤山粉葛 | 江门市鹤山市 | 27 | 新丰佛手瓜 | 韶关市新丰县 |
| 12 | 恩平簕菜 | 江门市恩平市 | 28 | 三圳淮山 | 梅州市蕉岭县 |
| 13 | 甜水萝卜 | 江门市新会区 | 29 | 蕉岭冬笋 | 梅州市蕉岭县 |
| 14 | 活道粉葛 | 肇庆市高要区 | 30 | 高堂菜脯 | 潮州市饶平县 |
| 15 | 水东芥菜 | 茂名市电白区 | 31 | 埔田竹笋 | 揭阳市揭东区 |
| 16 | 徐闻良姜 | 湛江市徐闻县 | 32 | 吴厝淮山 | 揭阳市揭东区 |
| 33 | 虎噉金针菜 | 汕尾市海丰县 |
Table 4 National geographical indication protection products for vegetables and geographical indication products for agricultural products in Guangdong Province
| 序号 | 产品名称 | 地区 | 序号 | 产品名称 | 地区 |
|---|---|---|---|---|---|
| 1 | 增城迟菜心 | 广州市增城区 | 17 | 西牛麻竹笋 | 清远市英德市 |
| 2 | 派潭凉粉草 | 广州市增城区 | 18 | 阳山淮山 | 清远市阳山县 |
| 3 | 庙南粉葛 | 广州市南沙区 | 19 | 阳山西洋菜 | 清远市阳山县 |
| 4 | 新垦莲藕 | 广州市南沙区 | 20 | 连州菜心 | 清远市连州市 |
| 5 | 炭步槟榔香芋 | 广州市花都区 | 21 | 星子红葱 | 清远市连州市 |
| 6 | 合水粉葛 | 佛山市高明区 | 22 | 连山大肉姜 | 清远市连山县 |
| 7 | 三水黑皮冬瓜 | 佛山市三水区 | 23 | 竹山粉葛 | 清远市佛冈县 |
| 8 | 矮陂梅菜 | 惠州市惠城区 | 24 | 北乡马蹄 | 韶关市乐昌市 |
| 9 | 福田菜心 | 惠州市博罗县 | 25 | 张溪香芋 | 韶关市乐昌市 |
| 10 | 杜阮凉瓜 | 江门市蓬江区 | 26 | 火山粉葛 | 韶关市曲江区 |
| 11 | 鹤山粉葛 | 江门市鹤山市 | 27 | 新丰佛手瓜 | 韶关市新丰县 |
| 12 | 恩平簕菜 | 江门市恩平市 | 28 | 三圳淮山 | 梅州市蕉岭县 |
| 13 | 甜水萝卜 | 江门市新会区 | 29 | 蕉岭冬笋 | 梅州市蕉岭县 |
| 14 | 活道粉葛 | 肇庆市高要区 | 30 | 高堂菜脯 | 潮州市饶平县 |
| 15 | 水东芥菜 | 茂名市电白区 | 31 | 埔田竹笋 | 揭阳市揭东区 |
| 16 | 徐闻良姜 | 湛江市徐闻县 | 32 | 吴厝淮山 | 揭阳市揭东区 |
| 33 | 虎噉金针菜 | 汕尾市海丰县 |
| [1] | ANSELIN L, 1995. Local indicators of spatial association-LISA[J]. Geographical Analysis, 27(2): 93-115. |
| [2] | ANSELIN L, GETIS A, 1992. Spatial statistical analysis and geographic information systems[J]. Annals of Regional Science, 26(1): 19-33. |
| [3] | CEI L, STEFANI G, DEFRANCESCO E, et al., 2018. Geographical indications: A first assessment of the impact on rural development in Italian NUTS3 regions[J]. Land Use Policy, 75: 620-630. |
| [4] | MORAN P, 1948. The interpretation of statistical maps[J]. Journal of the Royal Statistical Society (B), 10: 243-251. |
| [5] | 杜姗姗, 蔡建明, 郭华, 等, 2012. 食品安全导向下的都市农业发展模式——以北京蔬菜生产为例[J]. 地理科学进展, 31(6): 783-791. |
|
DU S S, CAI J M, GUO H, et al., 2012. Food security-oriented urban agriculture development typologies: A case study of vegetable production in peri-urban Beijing[J]. Progress in Geography, 31(6): 783-791.
DOI |
|
| [6] | 冯珊珊, 刘序, 梁俊芬, 等, 2023. 广东1992-2020年蔬菜生产时空变化特征分析[J]. 广东农业科学, 50(1): 50-59. |
| FENG S S, LIU X, LIANG J F, et al., 2023. Analysis on temporal and spatial characteristics of vegetable production in Guangdong Province from 1992 to 2020[J]. Guangdong Agricultural Sciences, 50(1): 50-59. | |
| [7] | 宫殿清, 王兆锋, 张镱锂, 2020. 2008-2018年拉萨市温室蔬菜地时空变化特征[J]. 农业工程学报, 36(13): 233-241. |
| GONG D Q, WANG Z F, ZHANG Y L, 2020. Spatial-temporal variation characteristics of greenhouse-vegetable land in Lhasa of Tibet from 2008 to 2018[J]. Transactions of the Chinese Society of Agricultural Engineering (Transactions of the CSAE), 36(13): 233-241. | |
| [8] | 黄坤明, 2025. 在广东省高质量发展大会上的讲话[EB/OL]. 广东省人民政府, [2025-03-09]. http://www.gd.gov.cn/gdywdt/gdyw/content/post_4663413.html. |
| HUANG K M, 2025. Speech at the Guangdong Province High - Quality Development Conference[EB/OL]. People’s Government of Guangdong Province, [2025-03-09]. http://www.gd.gov.cn/gdywdt/gdyw/content/post_4663413.html. | |
| [9] | 纪龙, 吴文劼, 2015. 我国蔬菜生产地理集聚的时空特征及影响因素[J]. 经济地理, 35(9): 141-148. |
| JI L, WU W J, 2015. Spatial-temporal characteristics and affecting factors of vegetable produce geographic agglomeration in China[J]. Economic Geography, 35(9): 141-148. | |
| [10] | 李艳梅, 孙焱鑫, 刘玉, 等, 2015. 京津冀地区蔬菜生产的时空分异及分区研究[J]. 经济地理, 35(1): 89-95. |
| LI Y M, SUN Y X, LIU Y, et al., 2015. Zoning of vegetable production in Beijing-Tianjin-Hebei Region at county level[J]. Economic Geography, 35(1): 89-95. | |
| [11] |
李裕瑞, 卜长利, 王鹏艳, 2021. 中国农产品地理标志的地域分异特征[J]. 自然资源学报, 36(4): 827-840.
DOI |
| LI Y R, BU C L, WANG P Y, 2021. Spatial pattern of agro-product geographical indications in China[J]. Journal of Natural Resources, 36(4): 827-840. | |
| [12] | 李岳云, 卢中华, 凌振春, 2007. 中国蔬菜生产区域化的演化与优化——基于31个省区的实证分析[J]. 经济地理, 27(2): 191-195. |
| LI Y Y, LU Z H, LING Z C, 2007. The evolution and optimization of vegetable productive regionalization in China: Positive analysis based on 31 provinces of China[J]. Economic Geography, 27(2): 191-195. | |
| [13] | 刘序, 冯珊珊, 胡韵菲, 等, 2023. 粤港澳大湾区蔬菜生产时空格局演变及其影响因素分析[J]. 广东农业科学, 50(1): 40-49. |
| LIU X, FENG S S, HU Y F, et al., 2023. Analysis of spatial-temporal pattern evolution and influencing factors of vegetable production in Guangdong-Hong Kong-Macao Greater Bay Area[J]. Guangdong Agricultural Sciences, 50(1): 40-49. | |
| [14] | 刘小燕, 金龙新, 皮向红, 等, 2018. 湖南省蔬菜产业时空分布特征及发展建议[J]. 湖南农业科学 (8): 100-104. |
| LIU X Y, JIN L X, PI X H, et al., 2018. Temporal and spatial distribution characteristics and development suggestions of vegetable industry in Hunan[J]. Hunan Agricultural Sciences (8): 100-104. | |
| [15] | 毛昭庆, 董晓波, 陈良正, 等, 2022. 云南省蔬菜产业发展的时空演变特征分析[J]. 湖北农业科学, 61(22): 99-104. |
| MAO Z Q, DONG X B, CHEN L Z, et al., 2022. Analysis on temporal and spatial evolution characteristics of vegetable industry development in Yunnan Province[J]. Hubei Agricultural Sciences, 61(22): 99-104. | |
| [16] | 苗晓颖, 胡继连, 王秀鹃, 2021. 山东蔬菜生产格局演变及空间集聚效应分析[J]. 山东农业科学, 53(9): 148-156. |
| MIAO X Y, HU J L, WANG X J, 2021. Evolution of vegetable production pattern and spatial agglomeration effects in Shandong Province[J]. Shandong Agricultural Sciences, 53(9): 148-156. | |
| [17] | 彭晖, 张嘉望, 李博阳, 2017. 我国农产品生产集聚的时空格局及影响因素——以蔬菜生产为例[J]. 西北农林科技大学学报(社会科学版), 17(6): 81-90. |
| PENG H, ZHANG J W, LI B Y, 2017. Spatial-temporal characteristics and affecting factors of agricultural production agglomeration in China[J]. Journal of Northwest A & F University (Social Science Edition), 17(6): 81-90. | |
| [18] |
商世民, 2016. 地理标志集群品牌对农产品产业集聚的影响——以湖北省为例[J]. 科技进步与对策, 33(23): 40-43.
DOI |
| SHANG S M, 2016. The effect of geographic indications cluster brand on agricultural products industrial agglomeration[J]. Science & Technology Progress and Policy, 33(23): 40-43. | |
| [19] | 田亚军, 朱孟帅, 周向阳, 等, 2022. 我国蔬菜生产布局演化及其影响因素分析[J]. 中国食物与营养, 28(11): 5-10. |
| TIAN Y J, ZHU M S, ZHOU X Y, et al., 2022. Evolution of Chinese vegetable production distribution and its influencing factors[J]. Food and Nutrition in China, 28(11): 5-10. | |
| [20] |
王弘儒, 秦文晋, 2023. 中国地理标志产品的空间分布与集聚特征研究[J]. 世界地理研究, 32(6): 157-166.
DOI |
|
WANG H R, QIN W J, 2023. Research on the spatial distribution and agglomeration characteristics of geographical indication products in China[J]. World Regional Studies, 32(6): 157-166.
DOI |
|
| [21] | 王静, 曾玉珍, 2017. 天津设施蔬菜种植户的生产决策行为及其影响因素分析[J]. 中国农业资源与区划, 38(8): 183-187. |
| WANG J, ZENG Y Z, 2017. Analysis on vegetable farmers’ decision-making and influencing factors[J]. Chinese Journal of Agricultural Resources and Regional Planning, 38(8): 183-187. | |
| [22] |
吴建寨, 沈辰, 王盛威, 等, 2015. 中国蔬菜生产空间集聚演变、机制、效应及政策应对[J]. 中国农业科学, 48(8): 1641-1649.
DOI |
| WU J Z, SHEN C, WANG S W, et al., 2015. Spatial evolution, mechanism, effect and policies of vegetable production agglomeration in China[J]. Scientia Agricultura Sinica, 48(8): 1641-1649. | |
| [23] |
谢永顺, 王成金, 吴爱玲, 2022. 地理标志农产品和农业经济的时空演变及交互响应[J]. 地理科学, 42(9): 1577-1587.
DOI |
| XIE Y S, WANG C J, WU A L, 2022. Spatiotemporal evolution and interactive effects of geographical indication agricultural products and agricultural economy[J]. Scientia Geographica Sinica, 42(9): 1577-587. | |
| [24] |
徐广才, 李春媛, 张蕊, 等, 2019. 北京市蔬菜专业村发展时空动态研究[J]. 中国农学通报, 35(20): 158-164.
DOI |
| XU G C, LI C Y, ZHANG R, et al., 2019. Spatial-temporal analysis of vegetable specialty village development in Beijing[J]. Chinese Agriculture Science Bulletin, 35(20): 158-164. | |
| [25] | 余超然, 李嘉炜, 宋钊, 等, 2021. 基于县域尺度的茂名蔬菜产地专业化及集聚化程度分析[J]. 广东农业科学, 48(9): 157-164. |
| YU C R, LI J W, SONG Z, et al., 2021. Analysis on the degree of specialization and aggregation of vegetable production areas in Maoming based on county scale[J]. Guangdong Agricultural Sciences, 48(9): 157-164. | |
| [26] | 于丽艳, 穆月英, 2019. 蔬菜生产区域变迁、差异分解及其成因[J]. 华南理工大学学报(社会科学版), 21(3): 39-49. |
| YU L Y, MU Y Y, 2019. Regional changes, differences and influencing factors of vegetable production[J]. Journal of South China University of Technology (Social Science Edition), 21(3): 39-49. | |
| [27] | 于丽艳, 穆月英, 侯玲玲, 等, 2022. 县域农业生产集聚形成的影响因素——以环渤海区域蔬菜生产为例[J]. 中国农业大学学报, 27(8): 303-312. |
| YU L Y, MU Y Y, HOU L L, et al., 2022. Influencing factors of the formation of agricultural production agglomeration in counties: Taking vegetable production in the Bohai Rim Region as an example[J]. Journal of China Agricultural University, 27(8): 303-312. | |
| [28] | 张建华, 2007. 一种简便易用的基尼系数计算方法[J]. 山西农业大学学报社会科学版, 6(3): 275-283. |
| ZHANG J H, 2007. An convenient method to calculate gini coefficient[J]. Journal of Shanxi Agricultural University (Social Science Edition), 6(3): 275-283. | |
| [29] | 张倩, 平阳, 于峰, 等, 2020. 京津冀地区蔬菜生产空间集聚演变分析[J]. 中国农业资源与区划, 41(7): 94-101. |
| ZHANG Q, PING Y, YU F, et al., 2020. Spatial agglomeration evolution analysis of vegetable production in Beijing-Tianjing-Hebei Region[J]. Chinese Journal of Agricultural Resources and Regional Planning, 41(7): 94-101. | |
| [30] | 张哲晰, 穆月英, 潘彪, 2023. 产业集聚推动农业高质量生产的机制研究: 来自专业村的证据[J]. 宏观质量研究, 11(4): 119-128. |
| ZHANG Z X, MU Y Y, PAN B, 2023. Research on the mechanism of industrial agglomeration promoting high quality agricultural production: Evidence from specialized villages[J]. Journal of Macro-quality Research, 11(4): 119-128. | |
| [31] | 周应恒, 吕超, 周德, 2012. 我国蔬菜主产地形成的影响因素——以山东寿光为例[J]. 地理研究, 31(4): 687-700. |
| ZHOU Y H, LÜ C, ZHOU D, 2012. Analysis of the influencing factors of the formation of main vegetable production areas in China: A case study of Shouguang in Shandong Province[J]. Geographical Research, 31(4): 687-700. | |
| [32] | 朱大威, 朱方林, 2019. 基于GIS的江苏省蔬菜种植土地适宜性评价及其空间异质性分析[J]. 南方农业学报, 50(8): 1878-1884. |
| ZHU D W, ZHU F L, 2019. Suitability evaluation and spatial heterogeneity analysis of vegetable planting land in Jiangsu Province based on GIS[J]. Journal of Southern Agriculture, 50(8): 1878-1884. |
| [1] | CHEN Peng, MA Yujun, ZHANG Mengya, CHEN Wanting, JIANG Xiaopeng. Analysis of Vegetation Dynamic in Guangdong Province Based on kNDVI [J]. Ecology and Environmental Sciences, 2025, 34(4): 499-510. |
| [2] | WANG Wen, HOU Qingqing, PEI Tingting. Impact of the Slope on Ecosystem Services in Hedong District of Gansu Province, China [J]. Ecology and Environmental Sciences, 2024, 33(7): 1117-1129. |
| [3] | XIANG Nan, WANG Mingxu, ZHANG Hongfeng, LIAO Baogan. Research on Zoning of Ecological Conservation Importance and Its Spatio-temporal Differentiation of Habitat Status Over a Long Time Sequence: A Case Study in Guangdong Province [J]. Ecology and Environmental Sciences, 2024, 33(6): 958-968. |
| [4] | HE Muquan, SHI Yanjun, WANG Chenxi, LUO Zuhong, ZHANG Shaotong. Spatiotemporal Distribution Characteristics of Vegetation Ecology and Its Meteorological Contribution in Guangdong Province [J]. Ecology and Environmental Sciences, 2024, 33(5): 679-688. |
| [5] | NING Jian, CHENG Xiaobo, SU Chaoli, TANG Zeping, YU Zefeng. Analysis of Soil Radioactivity Levels around NORM Facilities in Guangdong Province [J]. Ecology and Environmental Sciences, 2023, 32(9): 1692-1699. |
| [6] | WANG Jiali, FENG Jingke, YANG Yuanzheng, ZU Jiaxing, CAI Wenhua, YANG Jian. Research on Spatial Relations between Impervious Surfaces and the Urban Thermal Environment in the Central Metropolitan Area of Nanning City [J]. Ecology and Environmental Sciences, 2023, 32(3): 525-534. |
| [7] | LI Hui, LI Bilong, GE Lili, HAN Chenhui, YANG Qian, ZHANG Yuejun. Temporal and Spatial Characteristics of Vegetation Evolution and Topographic Effects in Fenhe River Basin from 2000 to 2021 [J]. Ecology and Environmental Sciences, 2023, 32(3): 439-449. |
| [8] | LU Yanbo, CHEN Zhanfeng, LI Tong. An Analysis of Water Quality Characteristics of Major Lakes and Reservoirs in Guangdong Province Based on Improved TOPSIS Model [J]. Ecology and Environmental Sciences, 2023, 32(12): 2194-2206. |
| [9] | FAN Yanxiang, LEI Sheping, XIE Jiancang. Comprehensive Evaluation and Differentiation Characteristics of Eutrophication in River Waters of Guangdong Province: Based on Game Theory Combined Empowerment Method and VIKOR Model [J]. Ecology and Environmental Sciences, 2023, 32(10): 1811-1821. |
| [10] | WANG Chenxi, ZHANG Qiongrui, ZHANG Ruoqi, SUN Xuechao, XU Songjun. Effects of Landscape Pattern on Water Quality Purification Service in the Pearl River Basin in Guangdong Province [J]. Ecology and Environmental Sciences, 2022, 31(7): 1425-1433. |
| [11] | LIU Xianghua, WANG Xiuming, LIU Xuchen, ZHANG Yinbo, LIU Piao. Ecological Compensation Mechanism Study of Guangdong Province Based on Spilled Ecosystem Service Value [J]. Ecology and Environmental Sciences, 2022, 31(5): 1024-1031. |
| [12] | HUANG Qiaoyi, YU Junhong, HUANG Jianfeng, HUANG Xu, LI Ping, FU Hongting, TANG Shuanhu, LIU Yifeng, XU Peizhi. Nutrient Resources of Main Crop Straw and Its Potential of Substituting for Chemical Fertilizer in Guangdong Province [J]. Ecology and Environmental Sciences, 2022, 31(2): 297-306. |
| [13] | CHEN Yaoyao, LIAO Tong, WANG Yu, SHEN Jin, ZHAI Yuhong, YE Siqi, CHEN Duohong, CHEN Jingyang. Characteristics of Ozone Pollution in Guangdong Province from 2016 to 2020 [J]. Ecology and Environmental Sciences, 2022, 31(12): 2374-2381. |
| [14] | ZHAO Anzhou, TIAN Xinle. Spatiotemporal Evolution and Influencing Factors of Vegetation Coverage in the Loess Plateau from 1986 to 2021 Based on GEE Platform [J]. Ecology and Environmental Sciences, 2022, 31(11): 2124-2133. |
| Viewed | ||||||
|
Full text |
|
|||||
|
Abstract |
|
|||||
Copyright © 2021 Editorial Office of ACTA PETROLEI SINICA
Address:No. 6 Liupukang Street, Xicheng District, Beijing, P.R.China, 510650
Tel: 86-010-62067128, 86-010-62067137, 86-010-62067139
Fax: 86-10-62067130
Email: syxb@cnpc.com.cn
Support byBeijing Magtech Co.ltd, E-mail:support@magtech.com.cn